1129
Evaluating of Deep Brain Nuclei Iron Deposition in Primary Grade 1 Hypertension Patients by QSM: A Preliminary Study1Dali university, Dali, China, 2The First People's Hospital of Yunnan Province, Kunming, China, 3MR Scientific Marketing, Siemens Healthineers, Shanghai, China, 4Kunming University of Science and Technology, Kunming, China
Synopsis
Hypertension is becoming a common health problem all over the world. In this study, Quantitative Susceptibility Mapping (QSM) was used to compare the differences of iron deposition in deep brain nuclei between 28 primary grade 1 hypertension (PG1H) patients and 28 age-sex-matched healthy controls (HC). The results showed that the iron deposition in six deep brain nuclei ROIs were higher in PG1H than in HC. This study laid a foundation for exploring the relationship between the hypertension severity and iron deposition in deep brain nuclei. It was also of great significance for clinical exploration of the physiological and pathological mechanism of hypertension and the correct selection of the treatment scheme of hypertension.
Introduction and Purpose
Hypertension is a major risk factor for cardiovascular disease and can be modified through lifestyle and pharmacological interventions to reduce cardiovascular attacks and mortality [1]. Hypertension may affect the change of iron deposition in deep brain nuclei during the course of its development, and the incidence rate of its complications may be related to the severity of hypertension. SWI is most widely used in clinical practice to qualitative observation brain iron deposition. Compared with SWI, Quantitative Susceptibility Mapping (QSM) has higher spatial resolution and clarity, and can quantify iron deposition more accurately [2,3]. Unfortunately, among many QSM studies related to brain iron deposition, there were few studies related to hypertension, which is still in the primary exploration stage. Therefore, this study used QSM sequence to quantitatively analyze the relationship between brain iron deposition and hypertension, to explore and analyze the correlation between different severity of blood pressure and brain iron deposition, so as to lay a foundation for exploring the pathogenesis, prevention, treatment and prognosis of hypertension.Materials and Methods
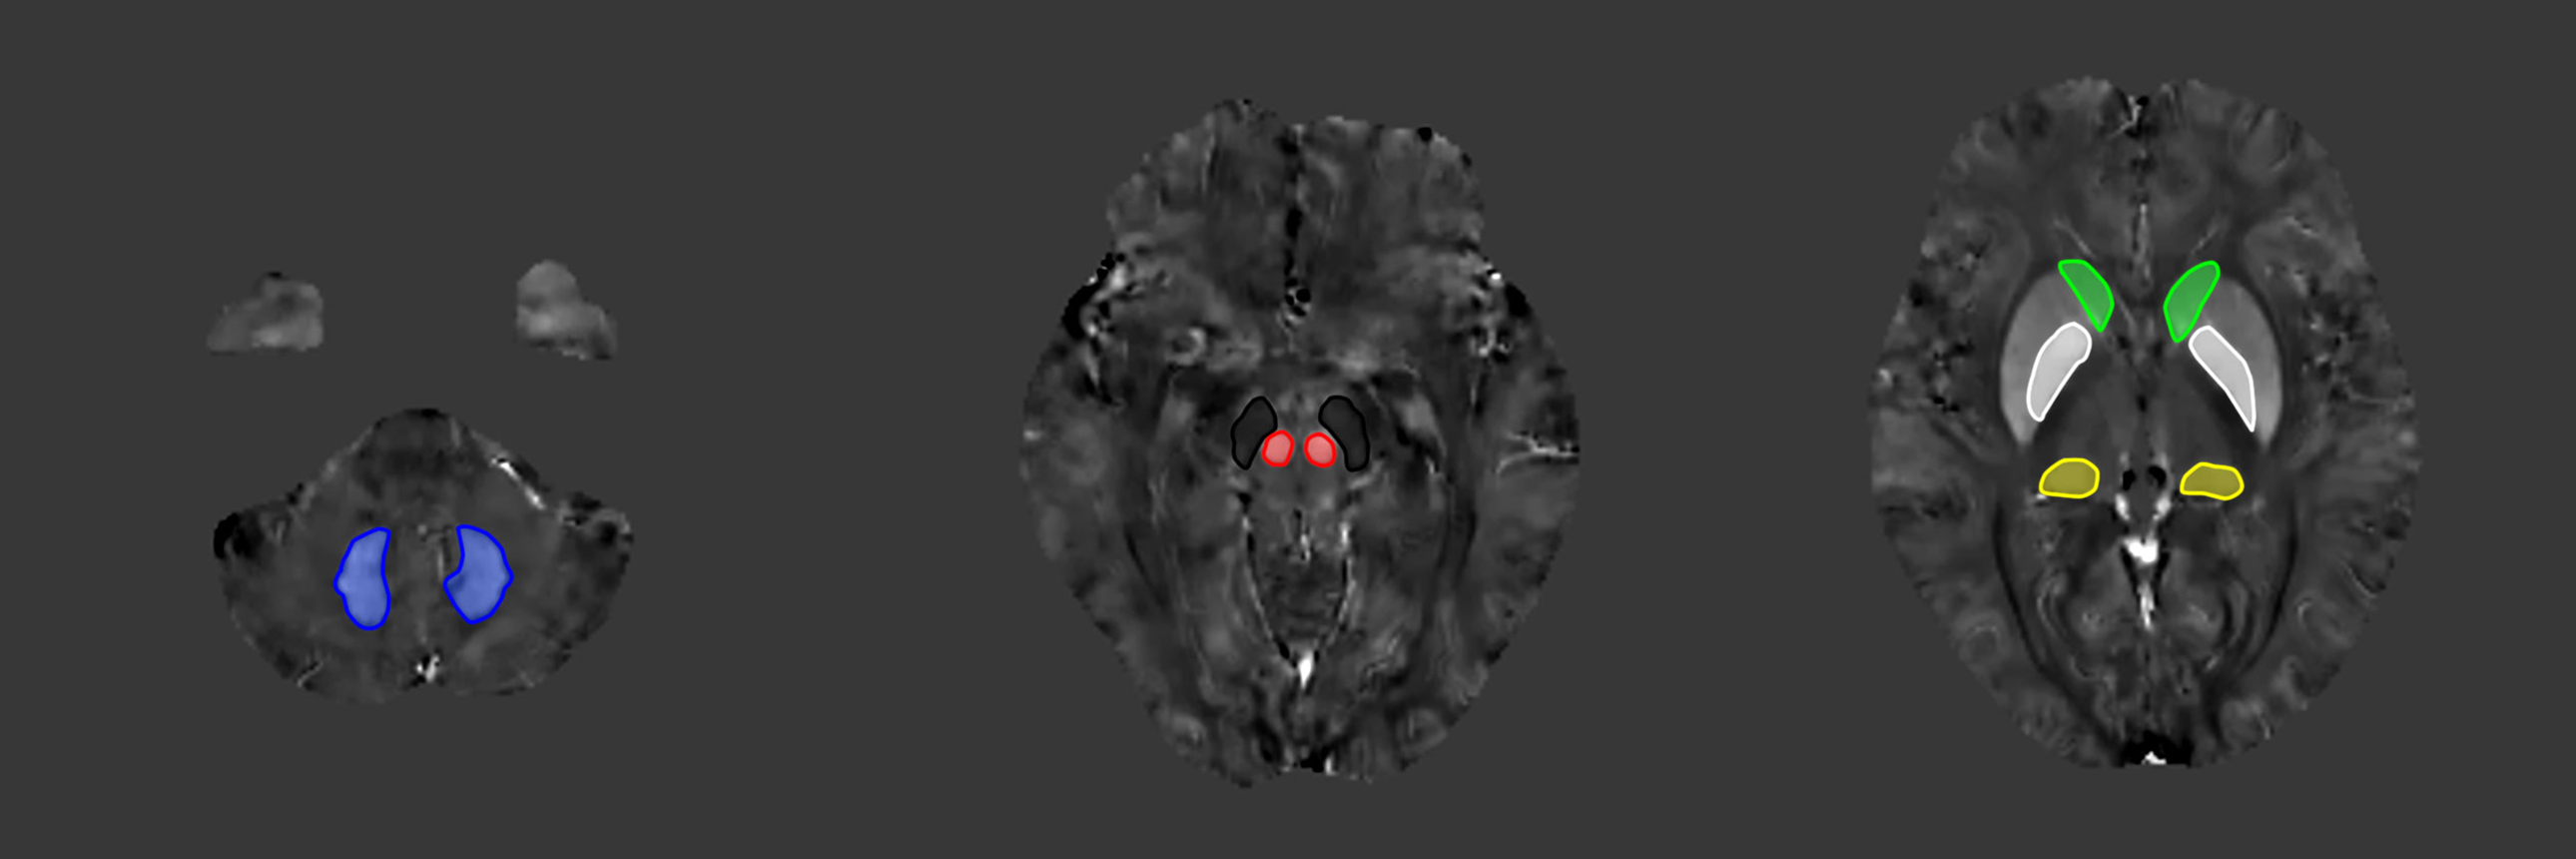
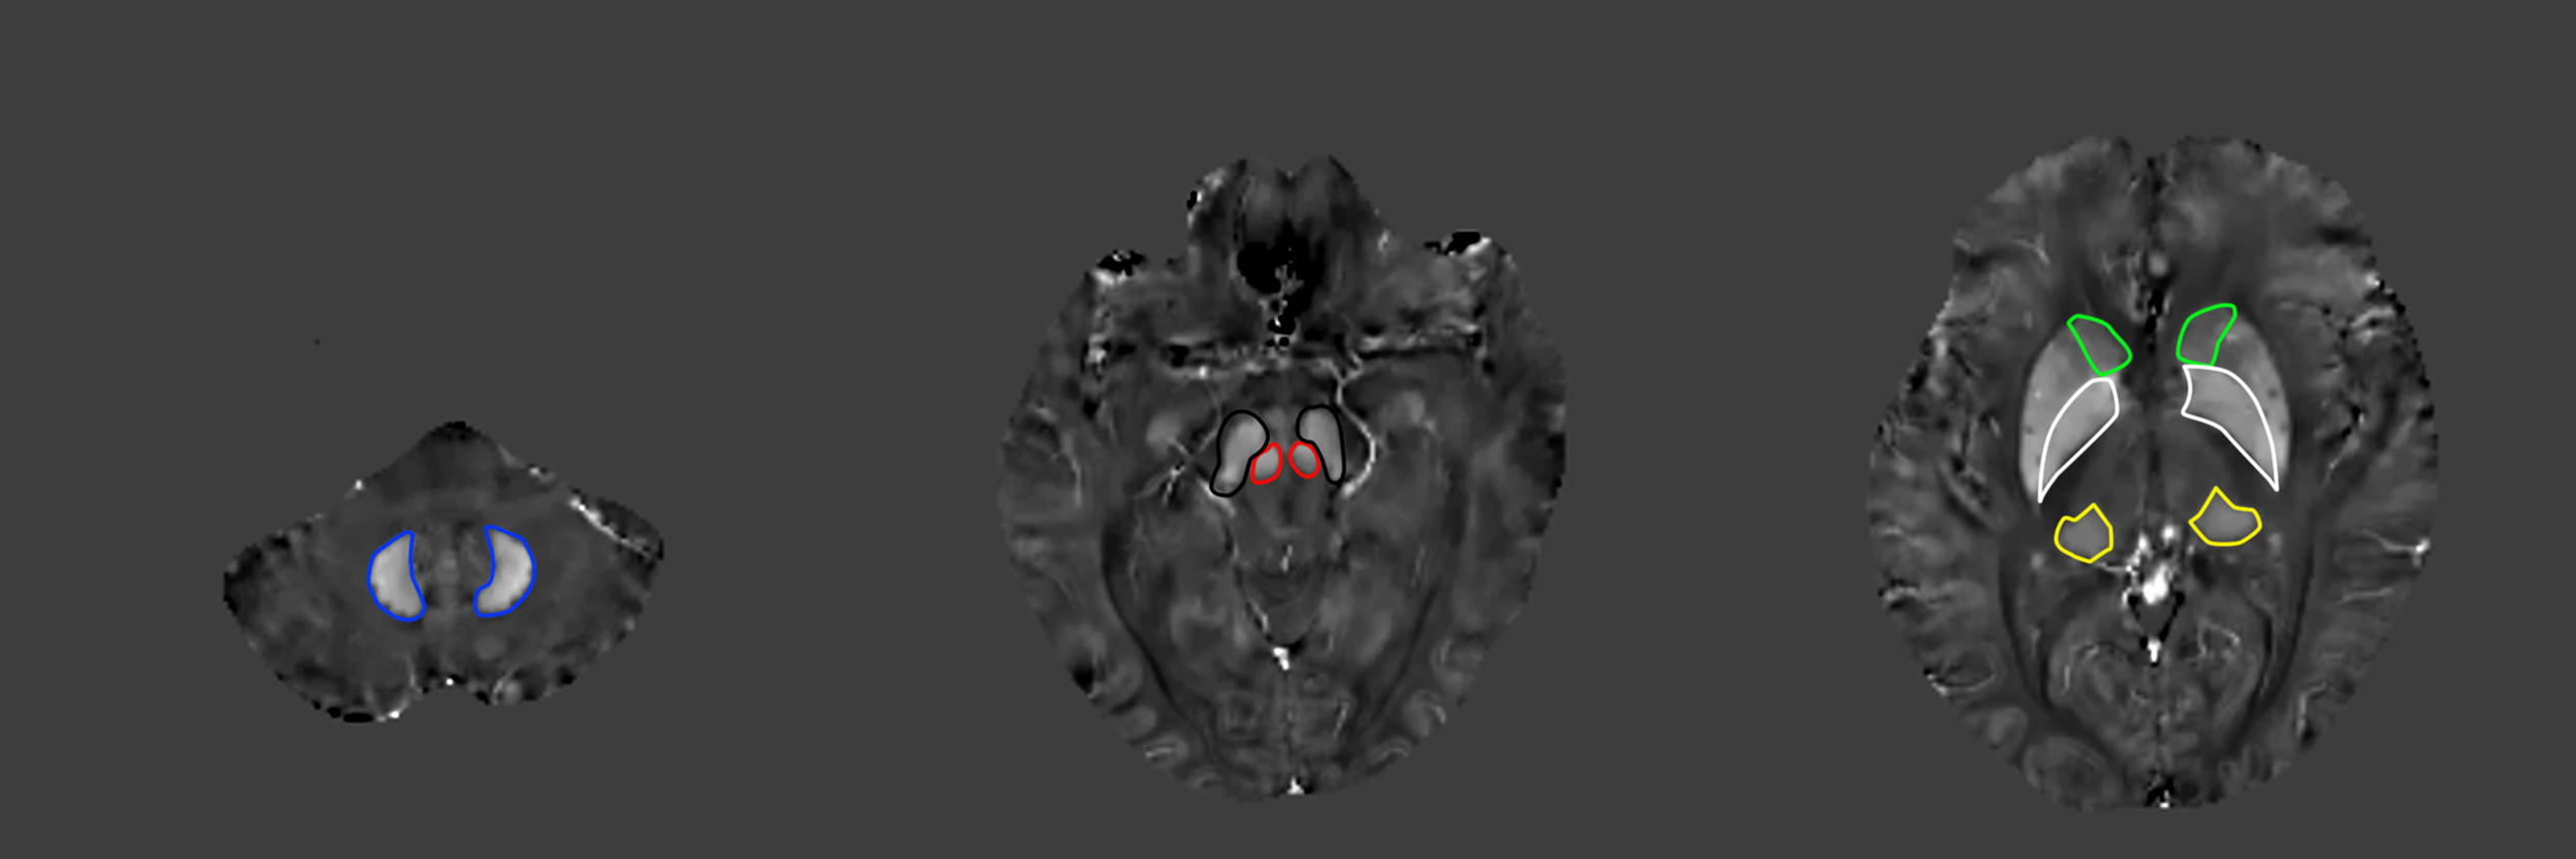
Two groups of age-sex-matched subjects: 28 patients with primary grade 1 hypertension (PG1H, 12 males, 16 females; mean age =49.1 ± 4.1 years) and 28 healthy controls (HC, 14 males, 14 females; mean age = 50.3 ± 5.5 years) were enrolled in this study. All subjects were scanned on a 3.0T MR scanner (Magnetom Prisma, Siemens Healthineers, Erlangen, Germany) using a 20-channel head-neck combined coil. The imaging protocals were as follows: repetition time (TR) = 50 ms, TE1/ΔTE/TE8 = 8.22 ms/6 ms/45 ms, slice thickness = 2 mm, flip angle = 15 deg, FOV = 240 mm × 210 mm, bandwidth = 240 Hz/Px, and slices number = 64, total acquisition time = 6 minutes 34 seconds.The magnitude and phase images were post-processed to generate susceptibility maps using the MEDI toolbox based on Matlab (R2016b, Mathworks, Natick, MA, USA). The regions of interest at the bilateral globus pallidus (GP), red nucleus(RN), substantia nigra(SN), dorsal thalamus (TH), caudate (CA), dental nucleus (DN) within the lateral ventricle were manually drawn on the susceptibility maps to extract tissue susceptibility values (Fig. 1 and Fig. 2). The susceptibility values of each structure were calculated as the average of bilateral sides. Statistical analysis was performed using SPSS software (version 25.0, IBM Corp., Armonk, NY, USA). The measurement data were expressed as mean ± standard deviation (SD). P < 0.05 was considered as statistically significant.
Results
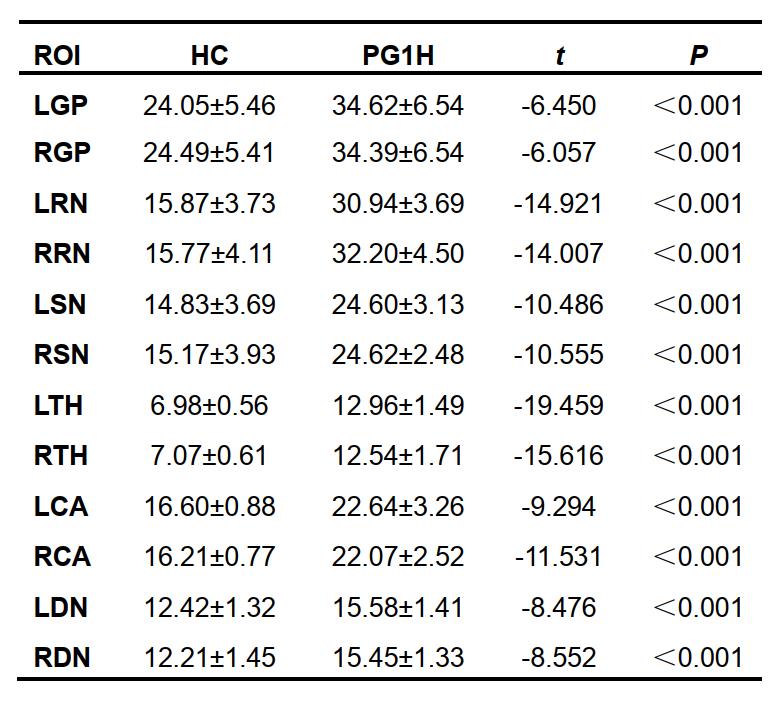
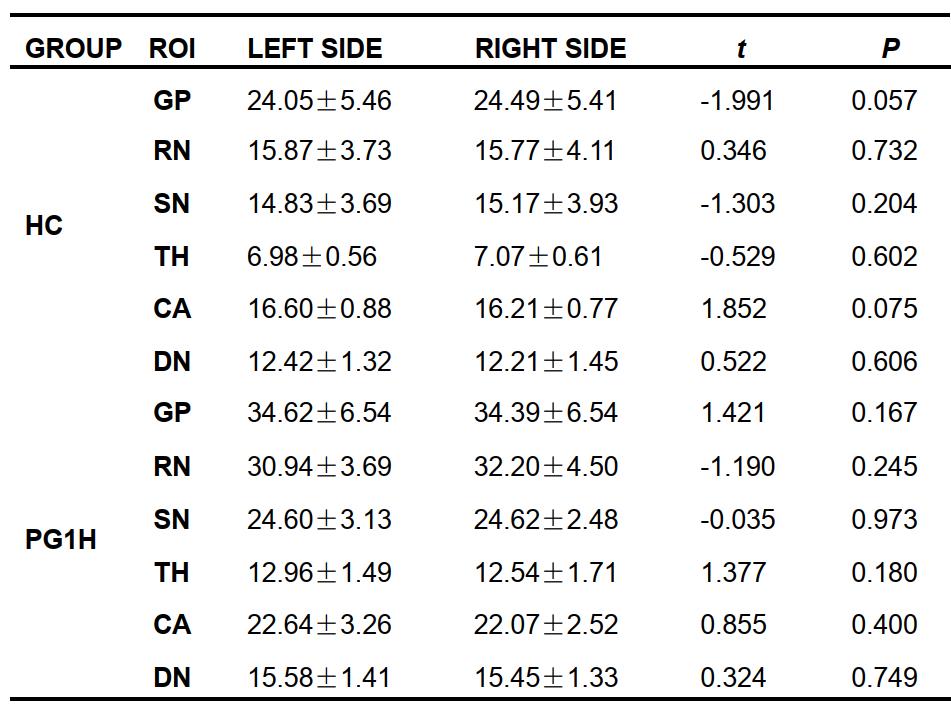
Independent samples T-test was performed between PG1H and HC. The results showed that the susceptibility values of the bilateral GP, RN, SN, TH, CA and DN of PG1H were higher than those of the HC (P < 0.05). The sensitivity values of RN, GP and SN were significantly high, followed by TH and CA moderate higher, and finally DN (Table 1). Paired T-test was performed on bilateral ROIs of PG1H and HC. The results showed that the magnetic susceptibility of PG1H and HC showed no statistically remarkable difference in bilateral GP, RN, SN, TH, CA and DN. (P > 0.05) (Table 2).Discussion
In this study, we used QSM to explore the changes of iron deposition in deep brain nuclei in patients with primary grade 1 hypertension. The results showed that the magnetic sensitivity of deep brain nuclei in PG1H group was higher than that in normal control group, suggesting that hypertension would cause pathological increase of brain iron deposition. Whether there would be an inevitable or linear relationship between the severity of hypertension and the increase of iron deposition needs to be further collected and analyzed.Conclusion
Through magnetic resonance QSM technology, we detected that the iron deposition content of brain nuclei in patients with primary grade 1 hypertension has increased, which would further deepen the understanding of the physiological and pathological changes of hypertension and provide an objective and helpful basis for clinical diagnosis and treatment in the future.Acknowledgements
We sincerely thank the participants in this study.References
[1] Guirguis-Blake JM, Evans CV, Webber EM, Coppola EL, Perdue LA, Weyrich MS. Screening for Hypertension in Adults: Updated Evidence Report and Systematic Review for the US Preventive Services Task Force. JAMA. 2021 Apr 27;325(16):1657-1669.
[2] Li Y, Sethi SK, Zhang C, Miao Y, Yerramsetty KK, Palutla VK, Gharabaghi S, Wang C, He N, Cheng J, Yan F, Haacke EM. Iron Content in Deep Gray Matter as a Function of Age Using Quantitative Susceptibility Mapping: A Multicenter Study. Front Neurosci. 2021 Jan 6;14:607705.
[3] Ruetten PPR, Gillard JH, Graves MJ. Introduction to Quantitative Susceptibility Mapping and Susceptibility Weighted Imaging. Br J Radiol. 2019 Sep;92(1101):20181016.
Figures