1128
Neurogenic metabolites after intravenous autologous stem cells infusion in Stroke: a high resolution NMR spectroscopic analysis of human sera
Ashu Bhasin1, Pawan Kumar2, S Senthil Kumaran2, Sujeet Mewar2, and MV Padma Srivastava1
1Department of Neurology, All India Institute of Medical Sciences, New Delhi, India, 2Department of NMR and MRI Facility, All India Institute of Medical Sciences, New Delhi, India
1Department of Neurology, All India Institute of Medical Sciences, New Delhi, India, 2Department of NMR and MRI Facility, All India Institute of Medical Sciences, New Delhi, India
Synopsis
High resolution NMR spectroscopy to study the neural and cellular metabolites from serum samples of 14 chronic stroke patients after autologous bone marrow derived mononuclear stem cells and neurorehabilitation using 700 MHz NMR spectrometer. The data were processed using the Agilent software, Vnmrj2.3A. PLS-DA multivariate analysis was performed to explore biochemical shifts and upregulation between patients with stem cell infusion and controls. Using MetaboAnalyst (3.0) software, we observed elevated levels of myoinositol, choline, NAA, ML in one group 1 as compared to group 2 (groups undisclosed).
Background
Bone marrow derived mononuclear stem cells (MNC) secrete neural metabolites which help in recovery after stroke. In this study in vitro H-NMR spectroscopy of serum samples in stroke patients were studied after intravenous stem cell transplantation and physiotherapy.Methods
Fourteen patients were randomized to autologous bone marrow mononuclear stem cells (BM-MNC) infusion (active) and saline (comparator) followed by 8 weeks of physiotherapy (groups 1 and 2 undisclosed). Serum venous samples were drawn at baseline and 8 weeks for 1H-NMR spectroscopy. 340μl serum and 30μl TSP (0.5mM) were added in 200ml of D2O using 700 MHz NMR spectrometer (M/s. Agilent Technologies, USA). Proton NMR spectra of serum samples were acquired using 1D CPMG with presaturation using 90˚ pulse sequence, with 64 scans; relaxation delay=70 s; spectral width= 9000 Hz; data points=32k; echo time=15 ms. Data was processed and binning values (0.04ppm) were obtained using the Vnmrj2.3A (M/s Agilent Technologies) and Mnova software (Mestrelab Research, S.L. Spain) respectively.Statistical Analysis: PLS-DA multivariate analysis was performed to explore biochemical dissimilarities between baseline and 8th week using MetaboAnalyst (3.0), a web-based metabolomics data processing software.
Results
No adverse reactions were reported in any of the patients. Mean age for all patients was 52.3+4.7 years, 8M/6F. PLS-DA analysis of group 1 patients revealed significant difference in cellular metabolites (Figure 1). It was also observed that variable projection analysis (VIP) of metabolites showed a trend of an increased choline (3.2ppm), myelin lipids (ML; 1.28ppm), lactate (1.3ppm) and glutamate (2.4ppm) in group 2 patients (Figure 2). Two sample t-test between group 1 and 2 revealed moderately significant levels of NAA and myelin lipids (ML) peaks at 8 weeks (95% CI: 3.2 to 12.6, p=0.045; 95 % CI; 6.2-5.4, p=0.05 respectively) as compared to other peaks (p<0.05).Discussion
From the 28 metabolites identified from the NMR spectra, seven (choline, myoinositol, lactate, glutamate, histidine, tyrosine, NAA, NAA/Cr and myelin lipids) were significantly different between the two groups post treatment (8 weeks). The neural metabolites responsible for dendritic sprouting are NAA, ML, myoinositol which might have been released by BM MNC aiding in neural plasticity and recovery. An increase in glutamate and NAD, which are involved in glycolysis and citric acid cycle, indicate a shift from oxidative phosphorylation to glycolysis during neural differentiation. As it is RCT once the groups are disclosed, the efficacy of either regimes can be ascertained.Conclusion
In vitro NMR metabolomics revealed the role of paracrine signalling of intravenous stem cells in endogenous recovery mechanisms post stroke.Abbreviations
BM MNC: Bone marrow derived mononuclear stem cells, NAD: Nicotinamide adenine dinucleotide; D2O: deuterium oxide; TSP: trimethylsilyl propionateAcknowledgements
AB acknowledges DST for DST-INSPIRE, Govt. India faculty fellowshipReferences
- Jansen et al. Stem cell profiling by nuclear magnetic resonance spectroscopy. 2006;56(3):666-702.
- Bang Y, Kim H et al. Adult stem cell therapy for stroke: challenges and progresses. J stroke 2016;18:256-266.
- Castigline F, Ferro M, Pelliterri R. NMR metabolomics of stem cell type discrimination. Sci Rep. 2017; 7:15808.
Figures
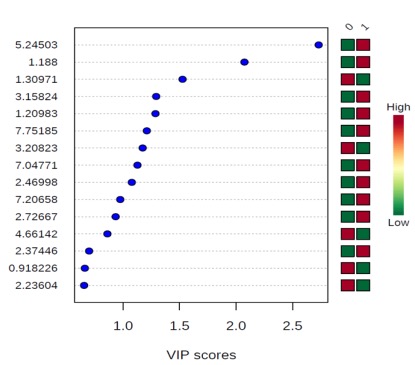
Figure 1. Partial least square discrimination analysis (PLS-DA) analysis scores plot of 1H NMR spectral bins of human blood sera of nine patients (group 1) from baseline (Green) and follow-up patients (Red).
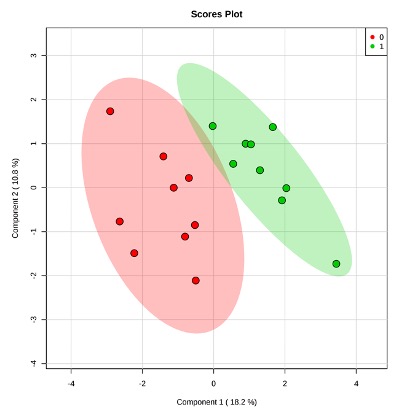
Figure 2. VIP Score of metabolites [choline (3.2ppm), myelin lipids (ML;1.28ppm), lactate (1.3ppm) and glutamate (2.4ppm)] in group 2 patients.
DOI: https://doi.org/10.58530/2022/1128