1126
Quantitative Susceptibility Mapping and R2* Mapping Suggest Demyelination in Silent Cerebral Infarcts in Sickle Cell Anaemia1Department of Medical Physics and Biomedical Engineering, University College London, London, United Kingdom, 2Imaging and Biophysics, Developmental Neurosciences, UCL Great Ormond Street Institute of Child Health, London, United Kingdom
Synopsis
To investigate the composition of silent cerebral infarcts (SCI) in sickle cell anaemia (SCA), we compared the magnetic susceptibility (χ) and transverse relaxation rates (R2*) of segmented SCI lesions to
Introduction
Silent Cerebral Infarcts (SCI) are defined as lesions, present in subjects with a normal neurological examination, which appear hyperintense on T2-weighted FLAIR images and are visible in two planes1. SCI are the most common neurologic injury in sickle cell anaemia (SCA) and the presence of SCI in white matter has been linked to a decline in Full Scale IQ and increased risk of clinical stroke2. Little information is available on the histopathology of SCI in SCA, and novel imaging techniques can now be used to characterize SCI, moving beyond lesion volumes and magnitude intensities3. Quantitative susceptibility mapping (QSM) calculates the spatial distribution of magnetic susceptibility (χ) and can be used to quantitatively examine changes in tissue composition4. It is expected that lesions which arise from distinct pathological mechanisms will have different compositions. QSM has previously shown χ heterogeneity between segmented SCI lesions as a function of brain lobe5 but it was unclear whether this was caused by anatomical differences or pathological processes.To investigate this, we compared the χ and transverse relaxation rates (R2*) of SCI lesions to normal appearing white matter (NAWM) in SCA and healthy control (HC) subjects. In white matter, myelin and iron are key χ/R2* sources and χ/R2* changes may indicate demyelination which has been linked to SCI presence6, or iron accumulation, observed in some multiple sclerosis lesions7. As myelin is diamagnetic and iron is paramagnetic, both iron accumulation and demyelination cause an increase in tissue χ. R2* information can be used to disentangle changes in positive and negative susceptibility sources and was included in this study to further understand the changes in χ observed in SCA8.
We aimed to understand SCI lesion composition and investigate factors which may alter lesion pathophysiology. SCI-NAWM differences were investigated as a function of subject age and SCA status as well as lesion characteristics including the lesion brain lobe and volume.
Methods
All SCA and HC subjects underwent MRI on a 3T Siemens Magnetom Prisma, with the cohorts described in Figure 1a. The MRI protocol included T2-weighted Fluid-Attenuated Inversion Recovery (FLAIR) (Figure 2a), used to segment SCI, and multi-echo gradient echo (ME-GRE) used to calculate the χ and R2* maps (Figure 2b-d). χ maps were calculated from the ME-GRE using a previously described pipeline9. R2* maps were calculated from a linear fit of the log-transformed ME-GRE magnitude images.Each FLAIR image was examined by a neuroradiologist to identify SCI lesions and the lobes in which they were located. A generous region of interest (ROI) was manually drawn around each lesion. To remove any normal appearing WM from the lesion ROIs, a minimum intensity threshold was derived from the mean FLAIR magnitude intensity across the segmented cortex (1.02xmeanFLAIR CORTEX)10 and voxels with FLAIR intensities below this threshold were removed. NAWM ROIs in the contralateral hemisphere were segmented by mirroring each segmented SCI across the brain midline and shifting the segmentation to a manually selected position in NAWM in the same transverse slice, avoiding any SCI in the contralateral hemisphere.
FLAIR images were registered to the native QSM space using NiftyReg11 and the resultant transformations were applied to the SCI and NAWM segmentations. Mean ROI χ/R2* and standard deviations were then calculated in each SCI and NAWM ROI. SCI and NAWM χ/R2* were compared using correlation and Bland-Altman analysis, and groupwise SCI-NAWM differences were assessed using paired t-tests.
Results
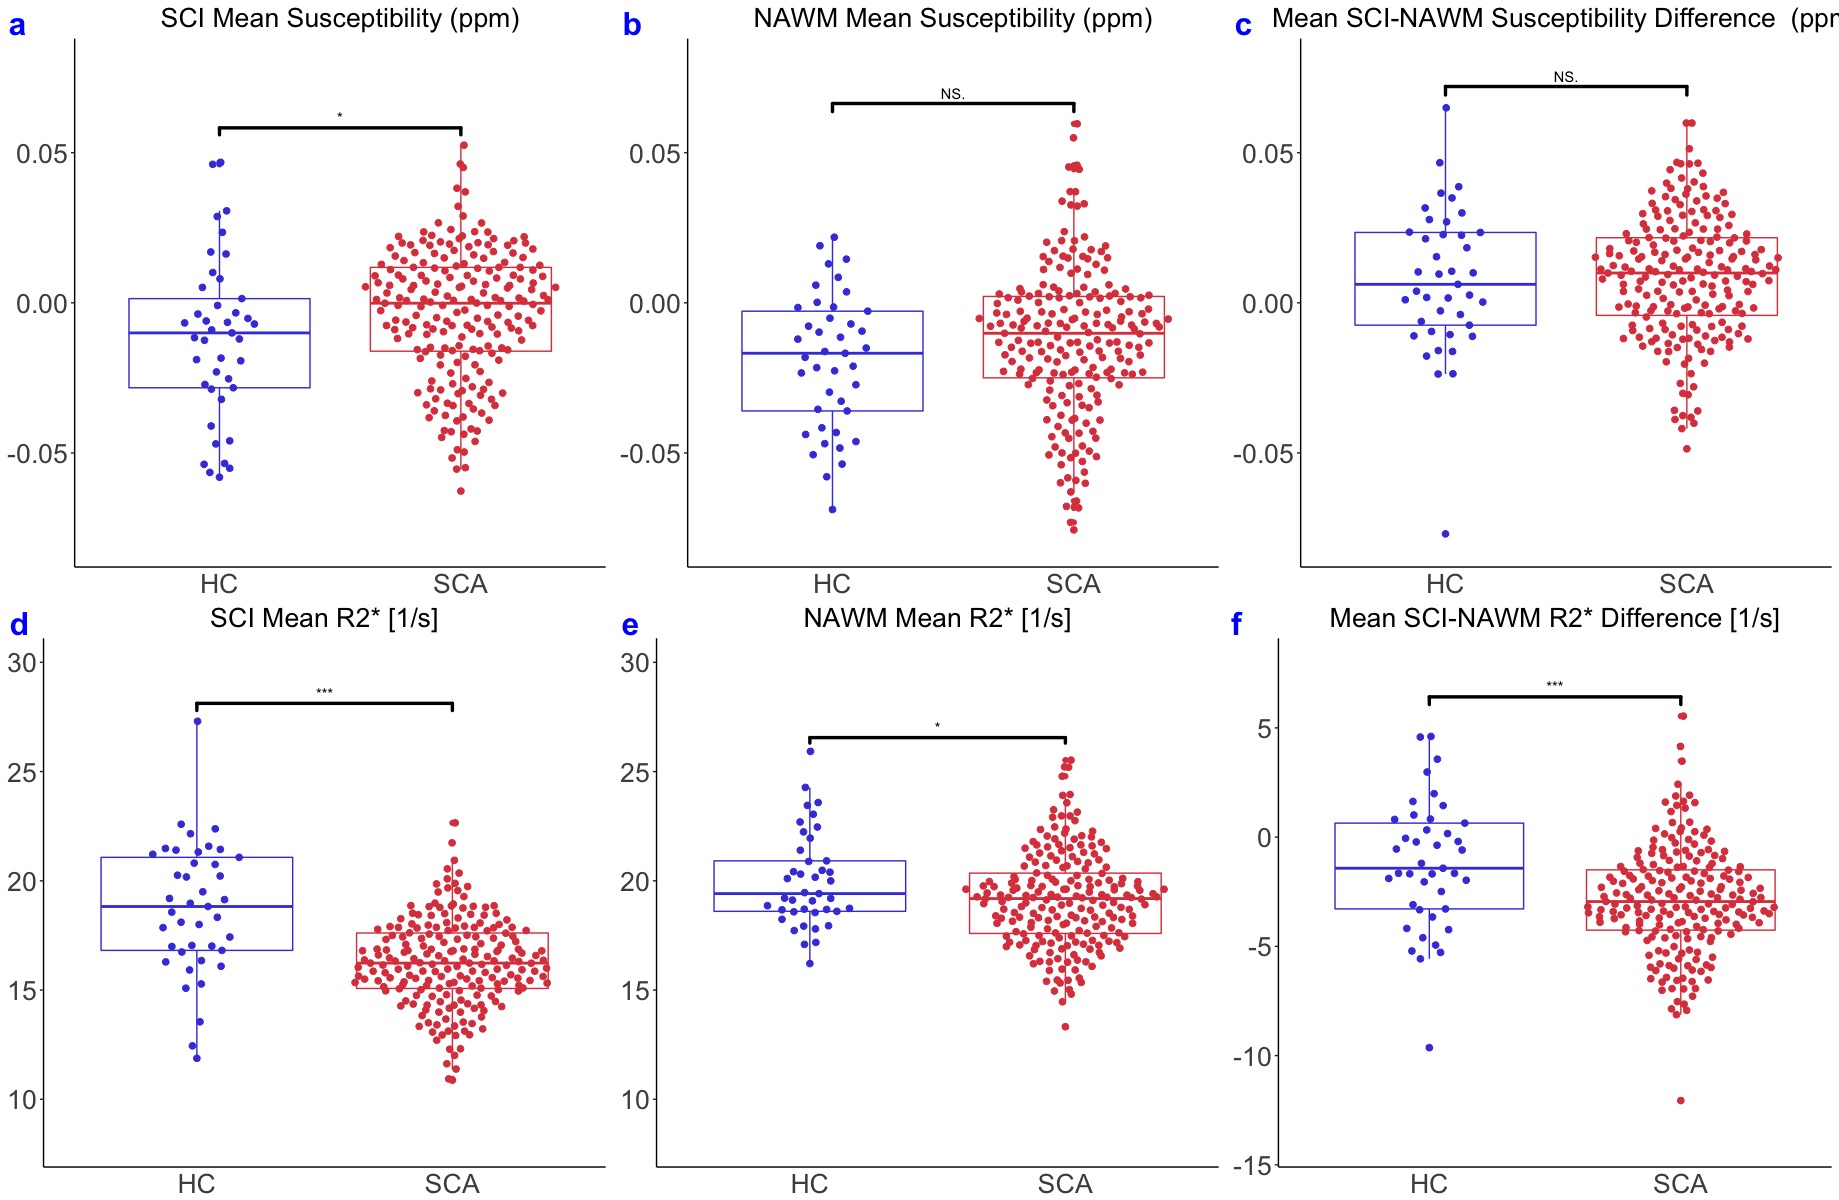
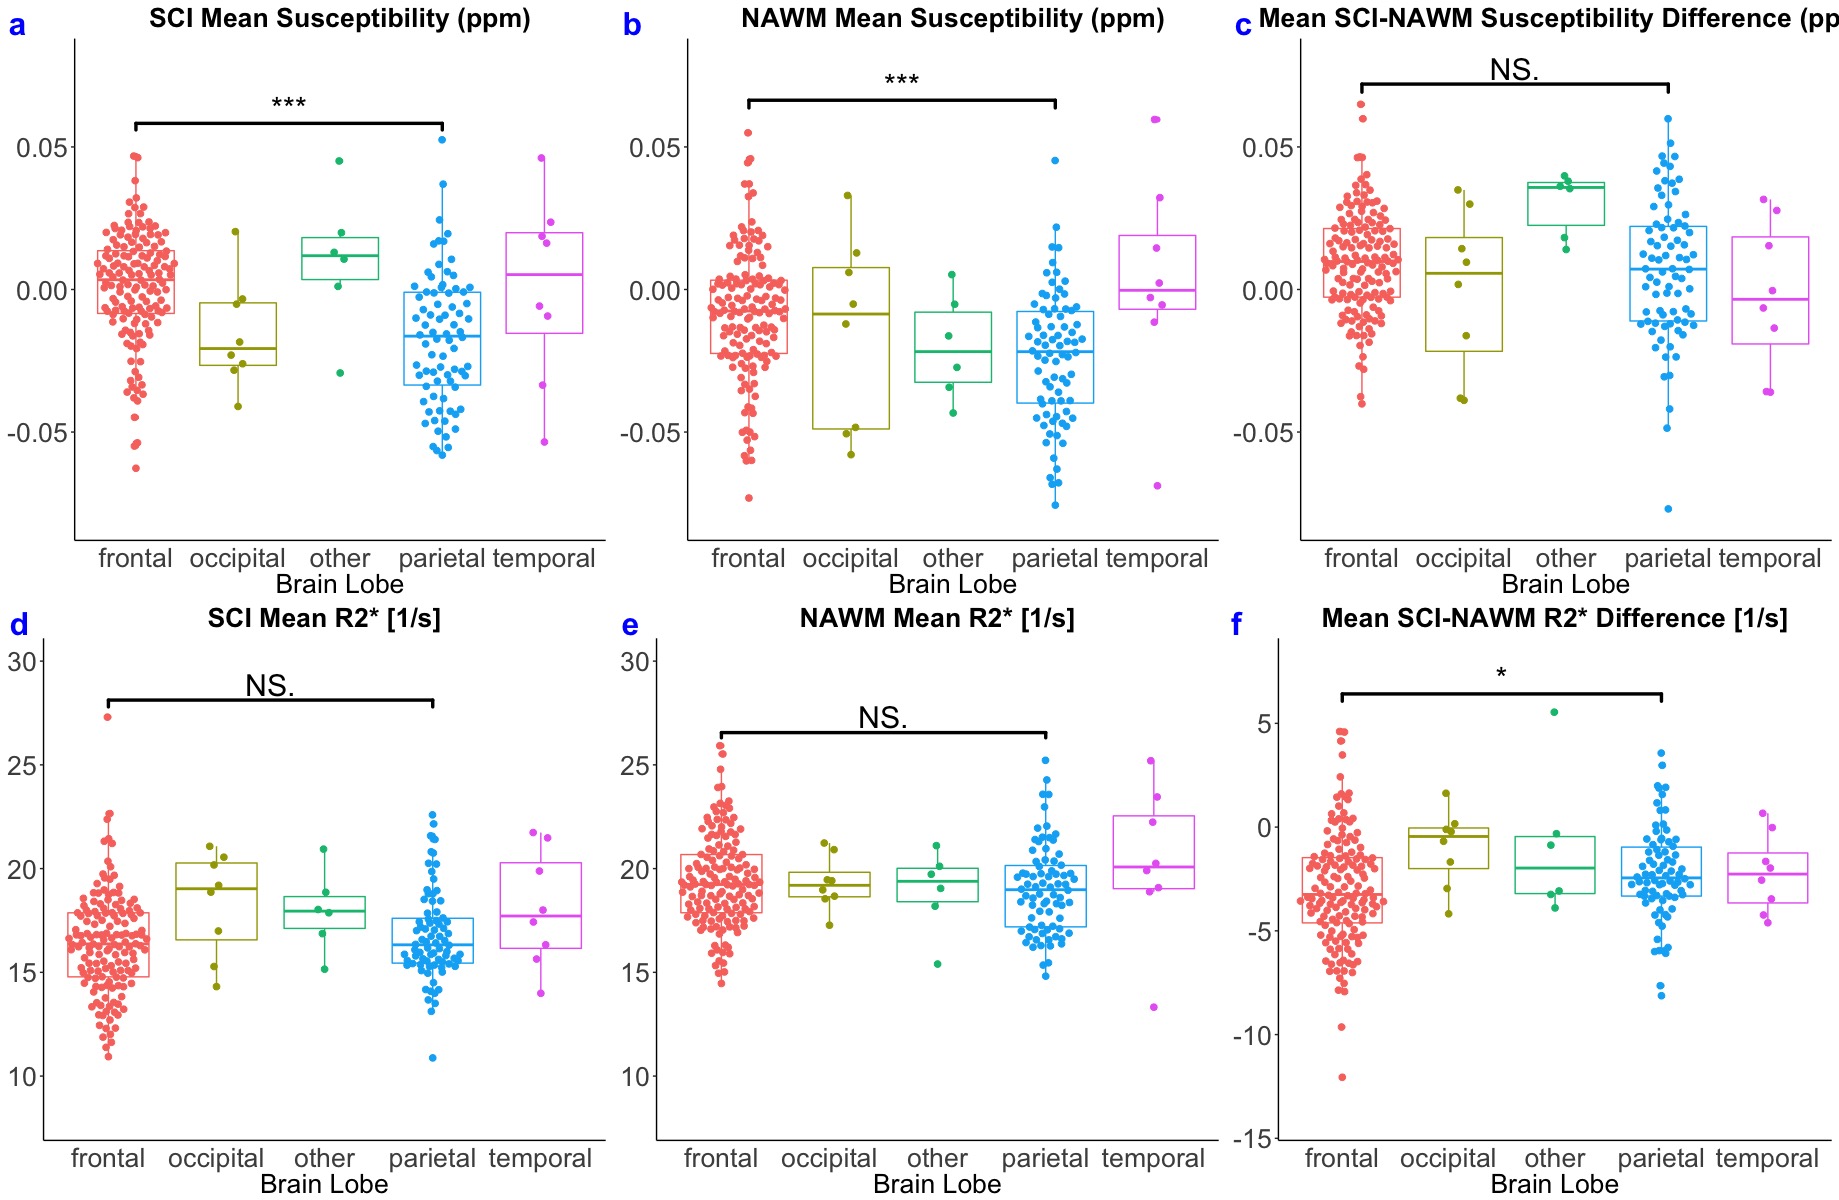
Strong correlations in χ and R2* were observed between the SCI lesions and the contralateral NAWM (Figure 3). SCI were significantly less diamagnetic compared to NAWM (χ= ‒0.005 vs ‒0.013 ppm, p<0.001) and R2* was significantly reduced in the SCI compared to NAWM (R2*= 16.7 vs 19.3 s-1, p<0.001).Both SCI and NAWM χ and R2* were correlated with age12 but no significant effect of age was observed on the SCI-NAWM χ or R2* differences. Similarly, lesion volume was found to have no effect on the SCI-NAWM χ or R2* differences. SCI-NAWM R2* differences were significantly larger in SCA patients relative to those observed in healthy controls (Figure 4). Increased χ within SCI in the frontal lobe, relative to the parietal lobe, mirrored increased χ observed in NAWM, and no significant SCI-NAWM χ differences were observed between brain lobes (Figure 5).
Discussion
The increased mean χ of SCI relative to NAWM could be caused by either iron accumulation or demyelination within the lesions. The reduction of R2* in SCI suggests that demyelination is more likely, as iron accumulation would increase R2* within the lesions.The greater R2* decrease observed in SCA patients than HC indicates that demyelination may be more severe in the SCA subjects. This is likely due to the increased ischaemia and haemodynamic stress present in SCA13. Measures of R2* may be more sensitive to changes in tissue composition within these white matter lesions, due to the relatively weak, fibre-orientation-dependent14 χ values of white matter.
Conclusion
In both subjects with sickle cell anaemia and healthy controls, we observed that silent cerebral infarcts have increased χ and reduced R2* relative to normal appearing white matter, consistent with demyelination. R2* was further decreased in SCA subjects relative to healthy controls, suggesting that the demyelination was more profound.Acknowledgements
Karin Shmueli is supported by European Research Council Consolidator Grant DiSCo MRI SFN 770939. Hanne Stotesbury was funded by Action Medical Research (GN2509) and Jamie Kawadler was funded by Great Ormond Street Children’s Charity (V4615). The National Institute for Health Research (UK; PB-PG-1112-29099) and NHLBI (R01HL079937) provided funding for patient recruitment. The work was supported by the National Institute for Health Research and Biomedical Research Centre at Great Ormond Street Hospital for Children NHS Foundation Trust and the Institute of Child Health (IS-BRC-1215-20012).References
1. Casella JF, King AA, Barton B, et al. Design of the silent cerebral infarct transfusion (SIT) trial. Pediatric hematology and oncology. 2010;27(2):69–89.
2. Kugler S, Anderson B, Cross D, et al. Abnormal cranial magnetic resonance imaging scans in sickle-cell disease. Neurological correlates and clinical implications. Archives of Neurology. 1993;50(6):629–635.
3. Maillard P, Carmichael O, Harvey D, et al. FLAIR and diffusion MRI signals are independent predictors of white matter hyperintensities. American Journal of Neuroradiology. 2013;34(1):54-61.
4 Langkammer C, Schweser F, Krebs N, et al. Quantitative susceptibility mapping (QSM) as a means to measure brain iron? A post mortem validation study. Neuroimage. 2012;62(3):1593-9.
5. Murdoch R, Stotesbury H, Kawadler J, et al. Investigating the Magnetic Susceptibility of Silent Cerebral Infarcts in Sickle Cell Anaemia Using Two Different Gradient Echo Acquisitions, ISMRM & SMRT Annual Meeting & Exhibition, 15th-20th May 2021, #3994
6. DeBaun MR, Armstrong FD, McKinstry RC, et al. Silent cerebral infarcts: a review on a prevalent and progressive cause of neurologic injury in sickle cell anemia. Blood. 2012;119(20):4587-96.
7. Wisnieff C, Ramanan S, Olesik J, et al. Quantitative susceptibility mapping (QSM) of white matter multiple sclerosis lesions: interpreting positive susceptibility and the presence of iron. Magnetic resonance in medicine. 2015;74(2):564-70.
8. Shina HG, Leeb J, Yunc YH, et al. 𝜒-separation: Magnetic susceptibility source separation toward iron and myelin mapping in the brain. NeuroImage. 2021;240:118371.
9. Murdoch R, Stotesbury H, Kawadler J, et al. Investigating the Effect of Positive Airways Pressure on Venous Oxygenation in Sickle Cell Anemia with Quantitative Susceptibility Mapping ISMRM & SMRT Annual Meeting & Exhibition, 15th-20th May 2021, #3992
10. van der Land V, Hijmans CT, de Ruiter M, et al. Volume of white matter hyperintensities is an independent predictor of intelligence quotient and processing speed in children with sickle cell disease. British journal of haematology. 2015;168(4):553-6.
11. Modat M, Cash DM, Daga P, et al. Global image registration using a symmetric block-matching approach. Journal of Medical Imaging. 2014 Sep;1(2):024003.
12. Li W, Wu B, Batrachenko A, et al. Differential developmental trajectories of magnetic susceptibility in human brain gray and white matter over the lifespan. Human brain mapping. 2014;35(6):2698-713.
13. Stotesbury H, Kawadler JM, Hales PW, et al. Vascular instability and neurological morbidity in sickle cell disease: an integrative framework. Frontiers in neurology. 2019;10:871.
14. Lee J, Shmueli K, Fukunaga M, et al. Sensitivity of MRI resonance frequency to the orientation of brain tissue microstructure. Proceedings of the National Academy of Sciences. 2010;107(11):5130-5.
Figures