1124
Characterizing Brain Structural Differences in Hemodialysis Patients using MAP MRI1Biomedical Engineering, Marquette Medical College of Wisconsin, Milwaukee, WI, United States, 2Department of Medicine, Medical College of Wisconsin, Wauwatosa, WI, United States
Synopsis
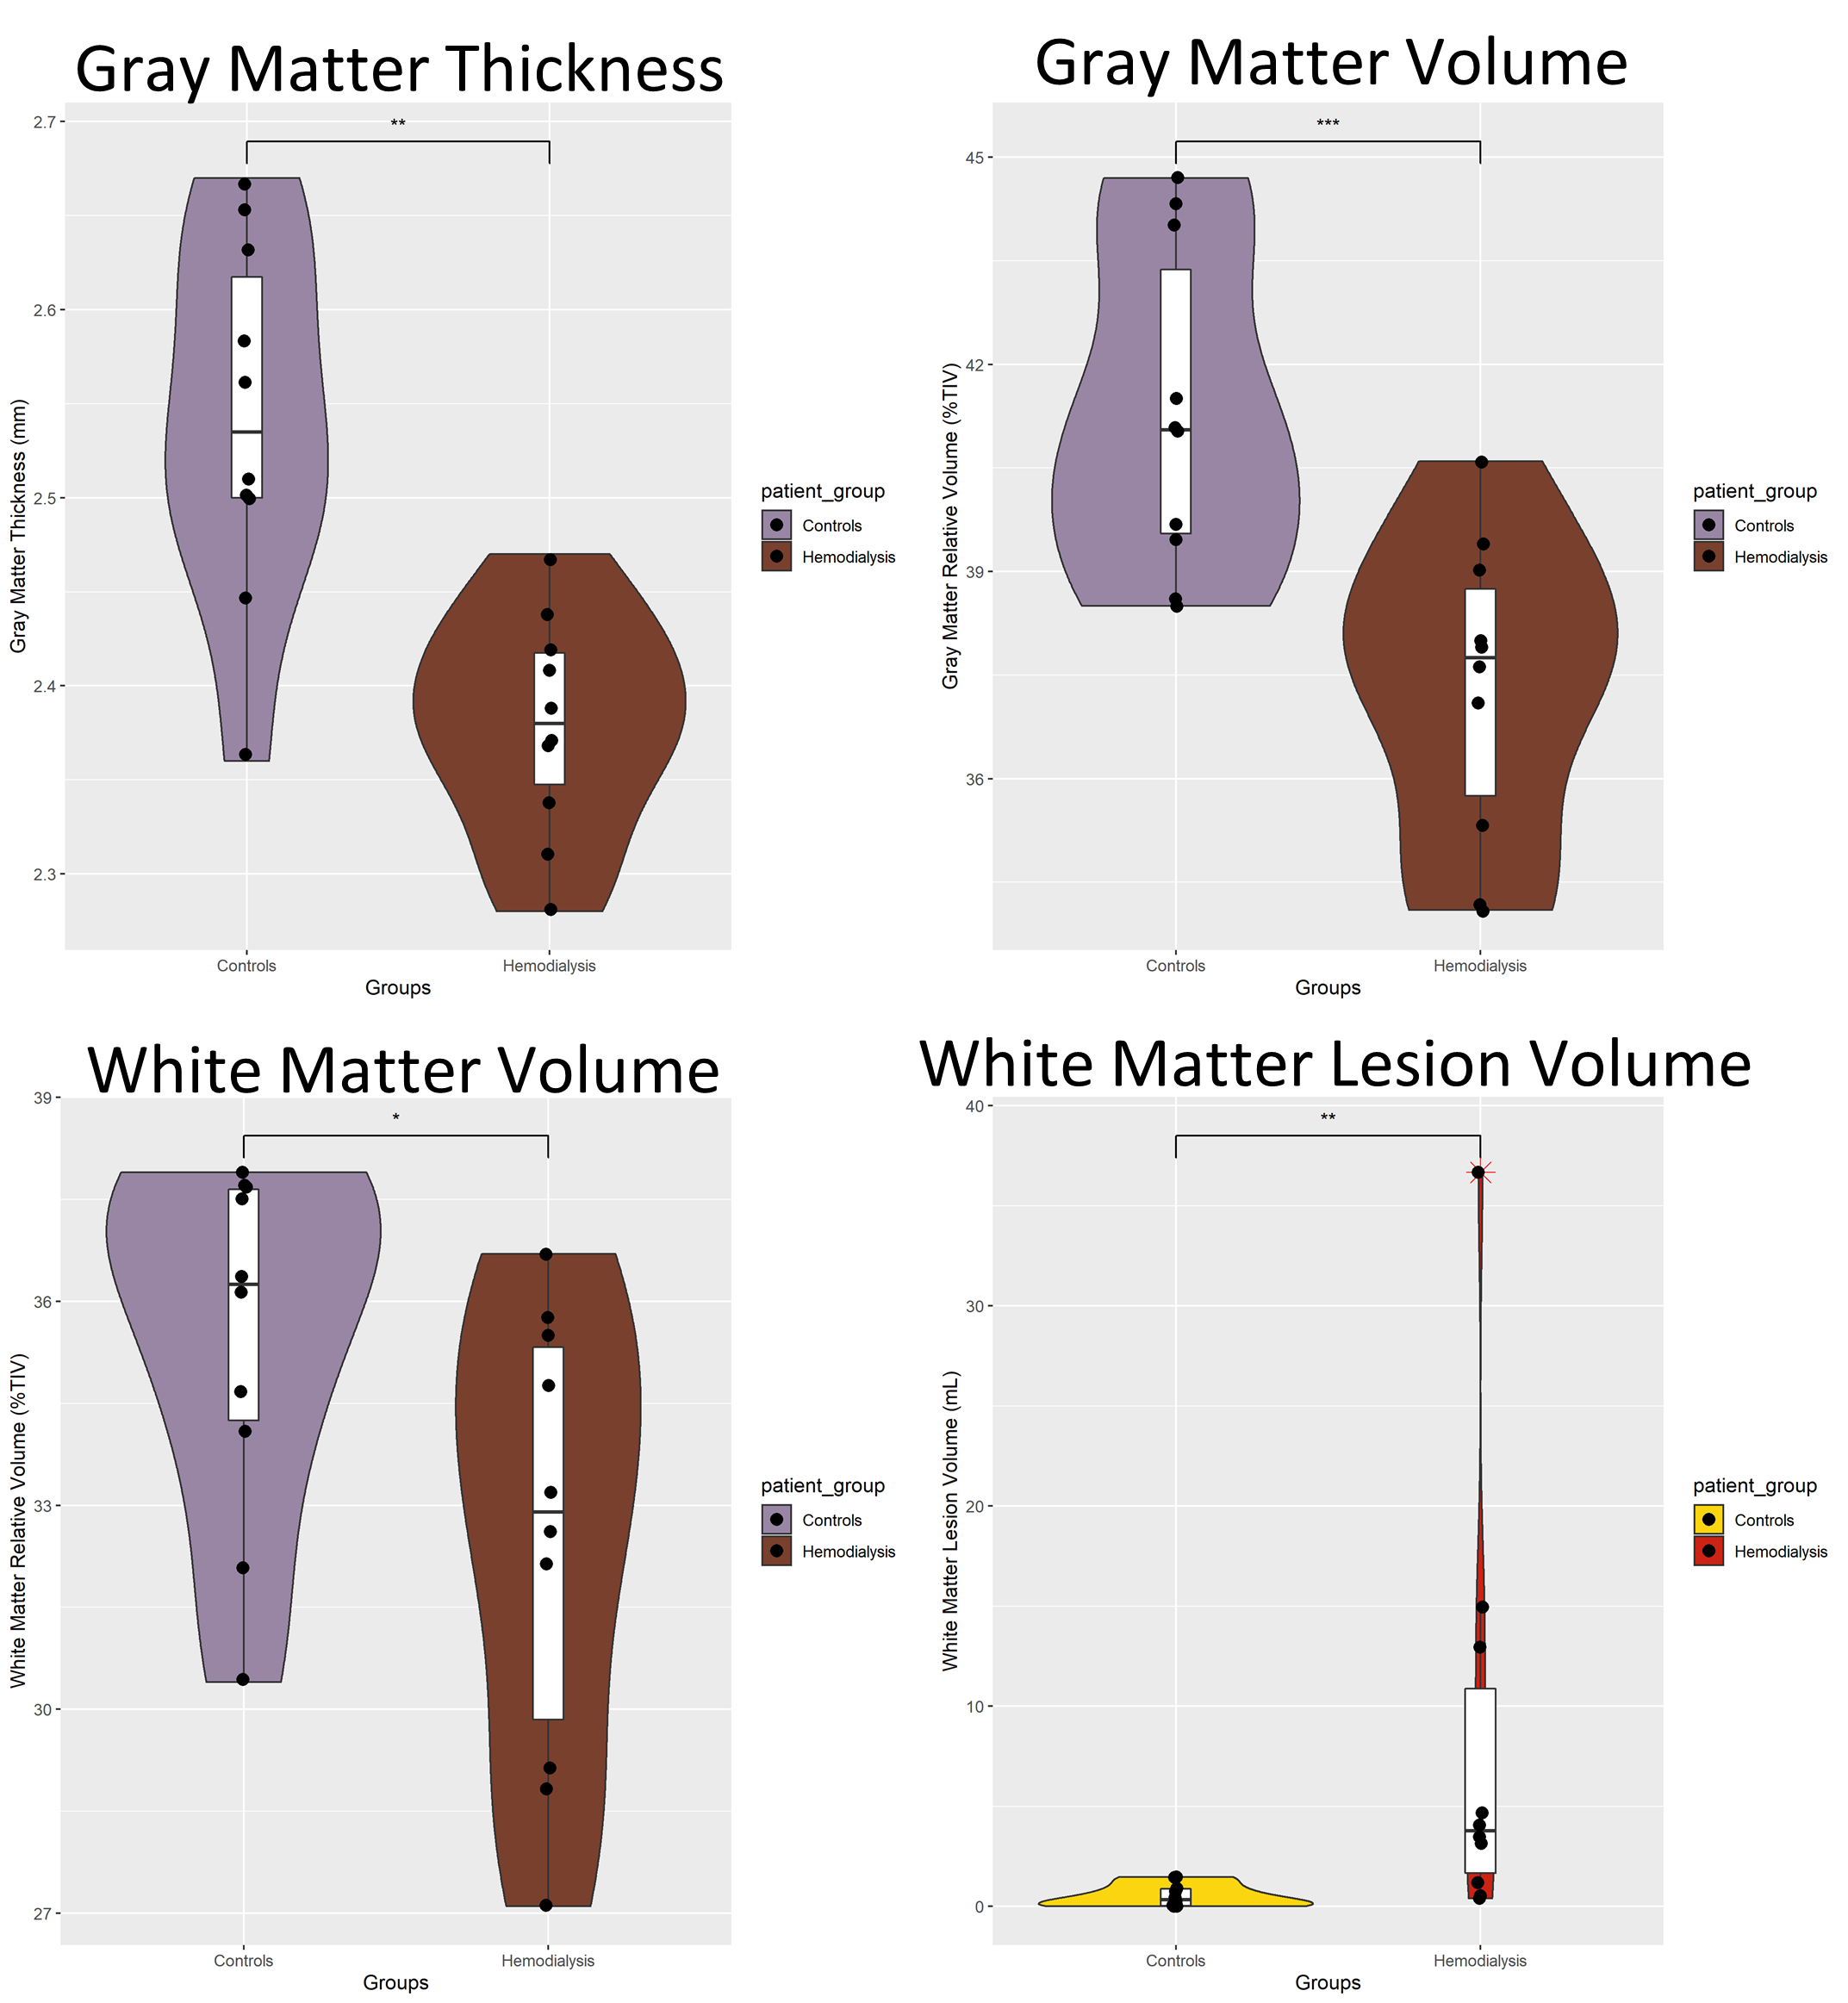
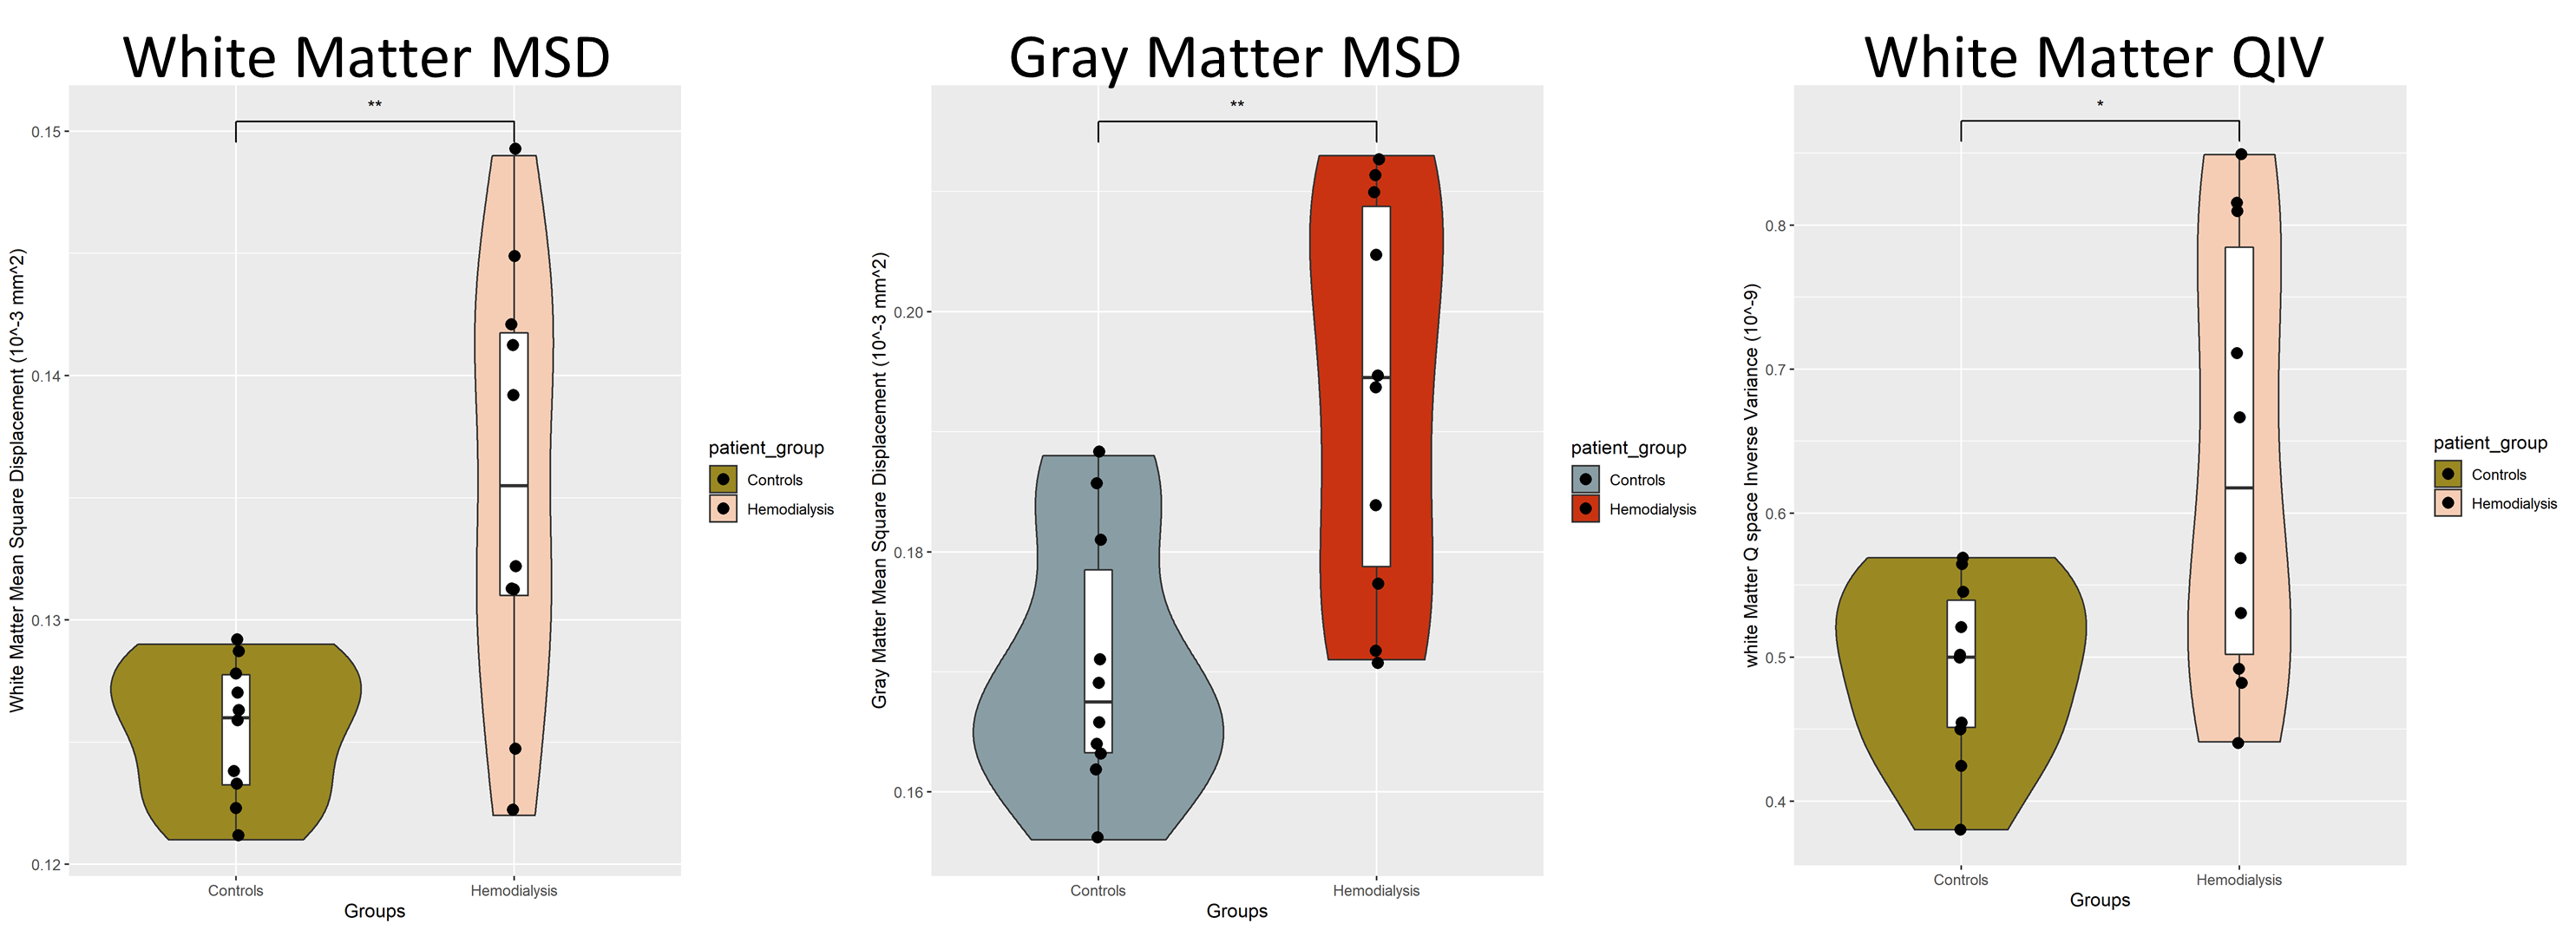
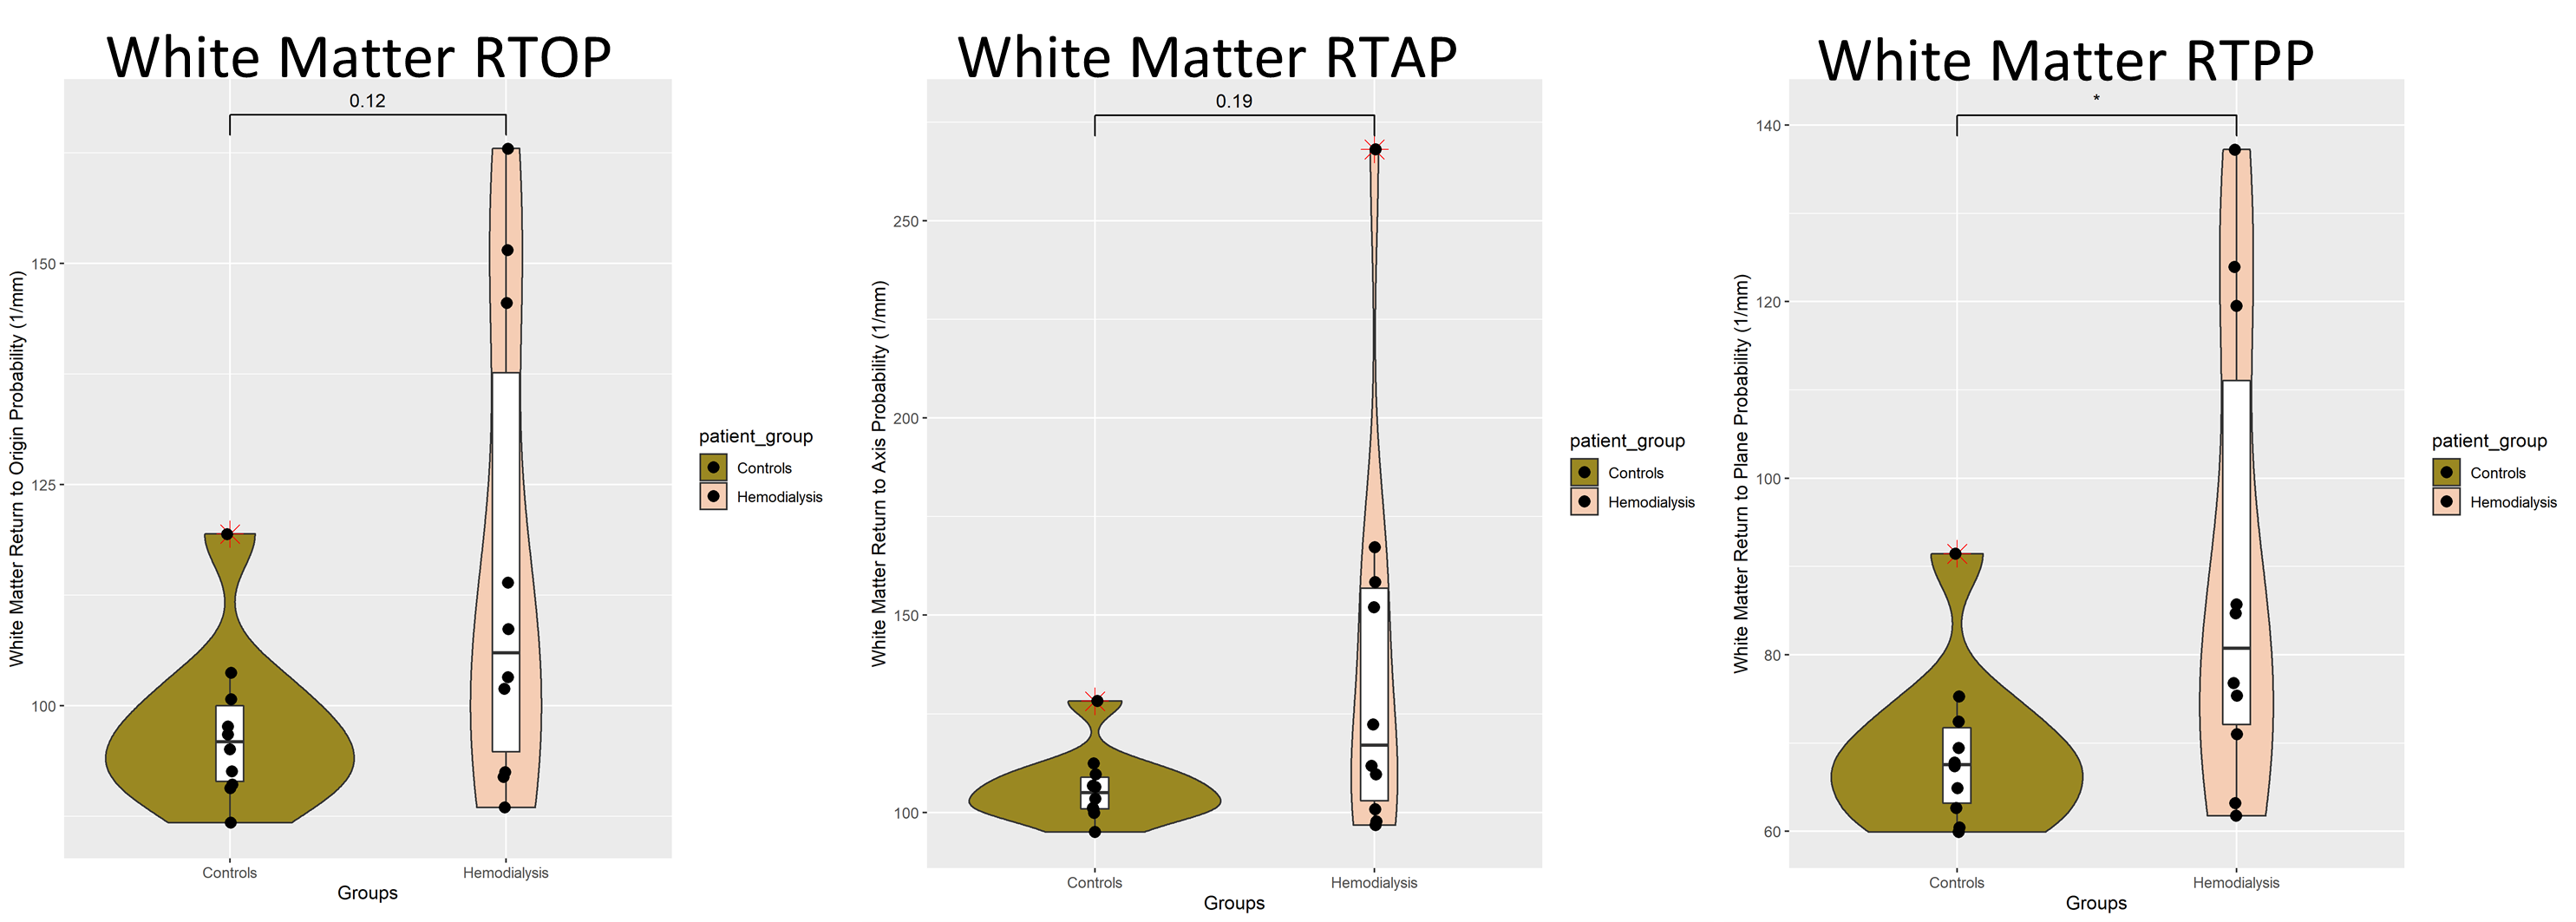
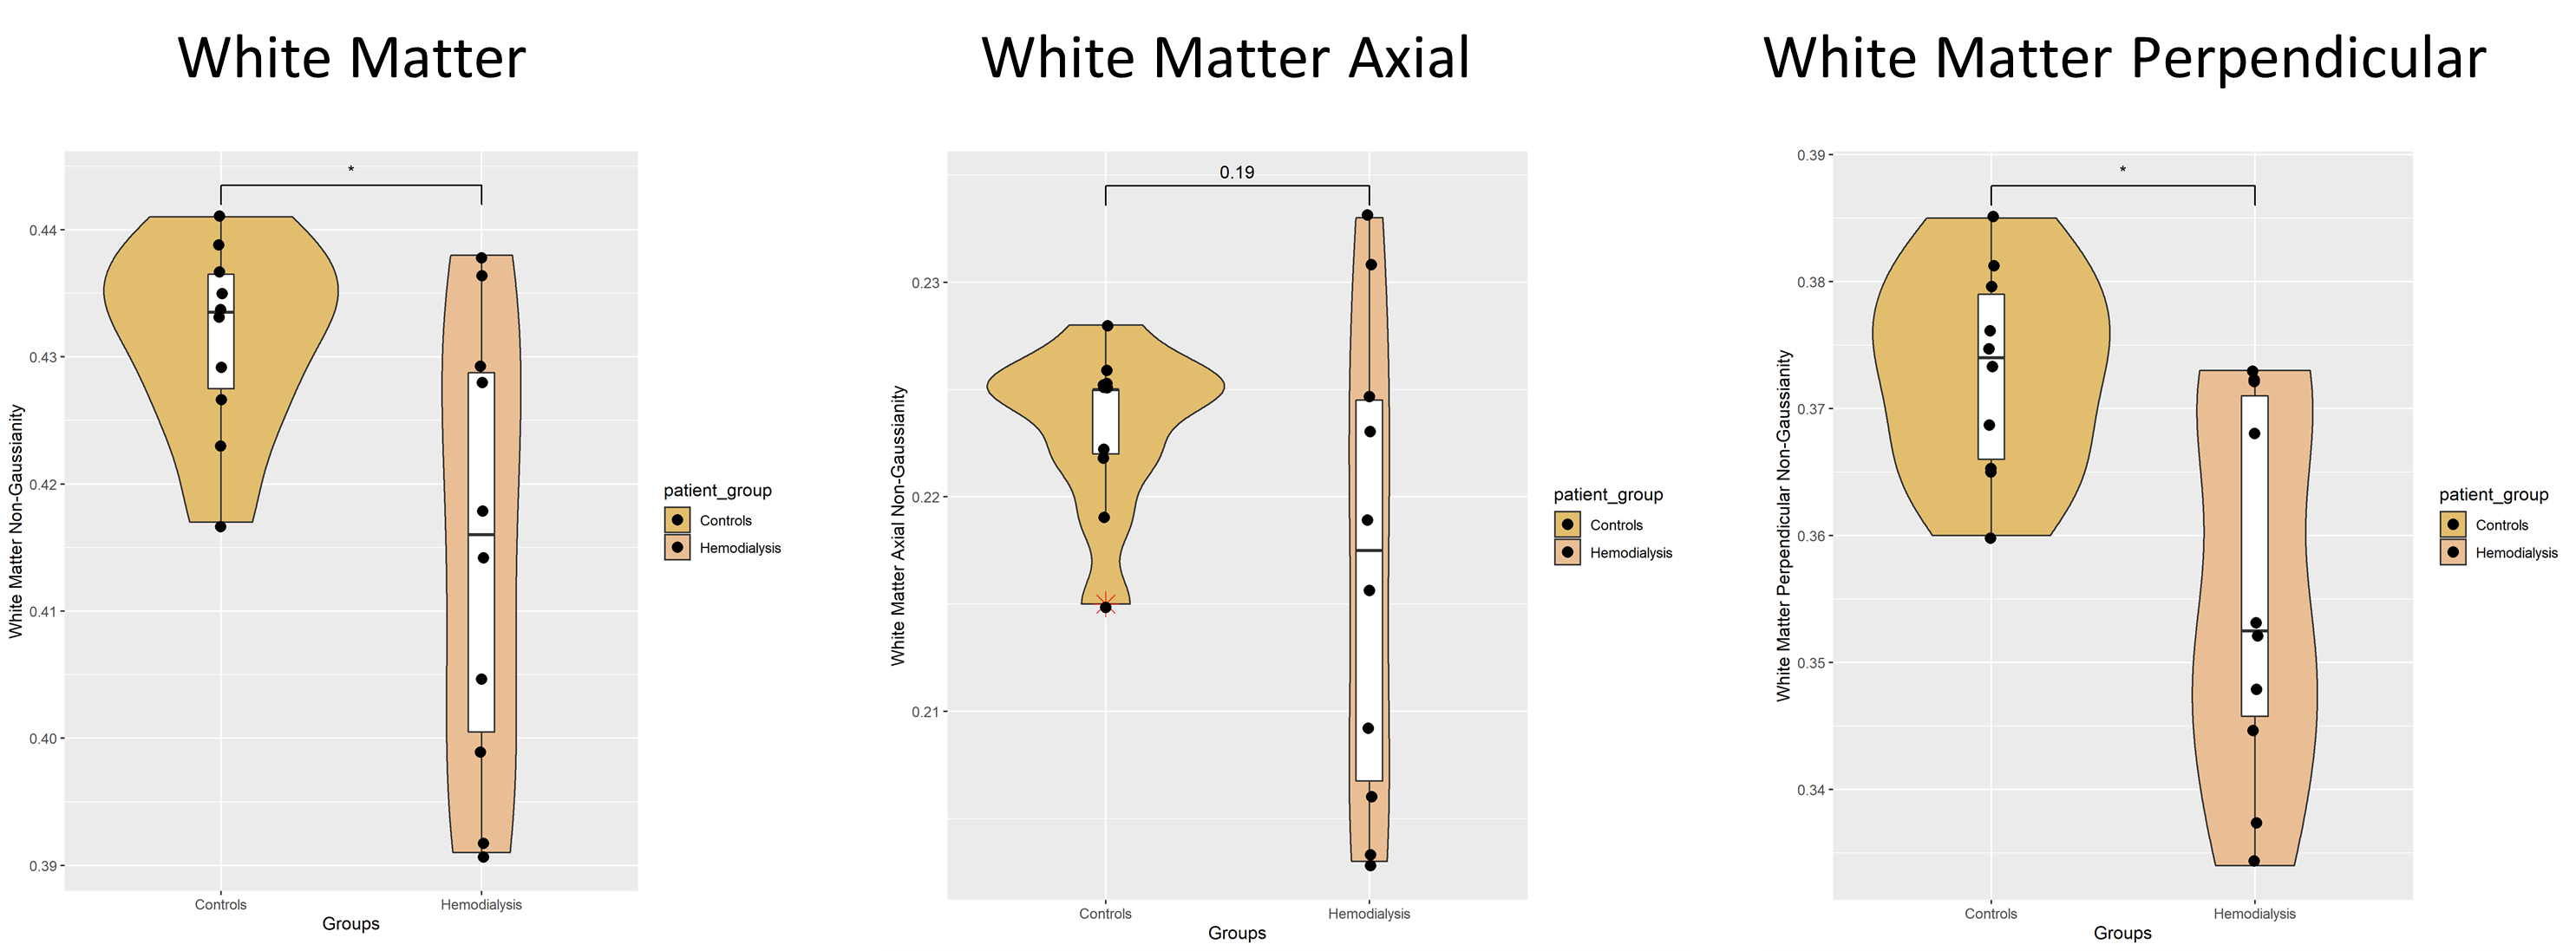
We collected brain MRI data using a custom, advanced diffusion sequence as well as typical T1 and T2 FLAIR anatomical images to characterize the differences between controls and Hemodialysis (HD) patients in a pilot study. We found decreased gray matter volume and thickness as well as increased white matter hyperintensity lesion volume in HD patients. Using the Mean Apparent Propagator technique, we found increased gray and white matter mean square displacement, white matter q space inverse variance and return to plane probability.
Introduction
Hemodialysis (HD) patients experience more than 2-fold higher rates of cognitive impairment compared to age matched peers.1 Structural deficits underlying the cognitive impairment include decreased cortical thickness, volume, loss of microstructural integrity indicated by diffusion tensor imaging (DTI) and increased white matter hyperintensity (WMH) volume as measured by T2 FLAIR.2-5 However, recent longitudinal studies have been unable identify changes in DTI parameters consistent with neurodegeneration even when other structural measures decline.6,7 Galons et al. 1996 found in rats that urea removal can have an effect on the diffusion weighted signal8; Schaier et al. 2019 found that a single dialysis session can cause changes in DTI9 and Reetz et al. 2015 found increased cerebral water content in HD patients using quantitative proton density MRI.10 These findings suggest that DTI may be ill suited to understanding microstructural changes in HD patients. In this pilot study we seek to test the feasibility of using multi shell diffusion acquisition with the Mean Apparent Propagator (MAP) to characterize diffusion microstructure in HD patients compared to healthy controls.Methods
We recruited 10 HD patients and 10 healthy controls. Exclusion criteria were under the age of 50 years old or previous neurological injury and anything that would prohibit an individual from getting an MRI. MAP MRI was acquired using a MAP genetic algorithm optimized sequence developed by Olson et al. 2019 to minimize error in estimating return to origin probability (RTOP) relative to the idealized acquisition proposed originally by Özarslan et al. 2013.11,12 We acquired 4 b0 volumes along with 95 directions at 6 b-value shells and b-max=6000 s/mm2. We collected a 3D T1 MPRAGE and Sagittal T2 FLAIR CUBE as well. T1 anatomical volumes were bias corrected, segmented and used to estimate cortical thickness. T2 FLAIR was used to calculate WMH volume.13-15 The diffusion data were then corrected for eddy currents using FSL.16 The MAP MRI model was then estimated using DIPY with Laplacian regularization.17 Mean square displacement (MSD), q space inverse variance (QIV), RTOP, return to axis probability (RTAP), return to plane probability (RTPP), non-Gaussianity (NG), axial non-Gaussianity (Ax-NG), and perpendicular non-Gaussianity (P-NG) were then calculated and averaged within the gray and white matter respectively. Comparisons were made using Wilcoxon sign rank test, using p<.05 for significance with no multiple comparisons correction as it was a pilot study.Results
Age of the healthy controls and HD groups was 60.4 years ± 8.4 and 64.5 years ± 7.3, there were 5 females in the HD group and 4 females in the control group. We found a significantly decreased gray matter thickness (p = .0017), gray matter relative volume (p = .0017) and white matter relative volume (p = .0492) in HD patients relative to controls along with increased WMH volume (p = .0036). Gray and white matter MSD were both significantly increased in HD patients (p = .0041, p = .0081) while only white matter QIV was significantly increased in HD patients (p = .0493). White matter RTPP was significantly increased in HD patients (p = .0376). No other gray or white matter return probability metrics were significantly different in HD patients, however white matter mean RTAP and RTOP were greater in HD patients relative to controls (p = .19, p = .12). White matter NG and P-NG were both significantly decreased in HD patients (p = .0411, p = .0101).Discussion
In this study we showed that HD patients have generally decreased cortical volume and thickness as well as decreased white matter integrity. Increased MSD in HD patients indicates less restricted diffusion and while RTOP and RTAP weren’t significantly increased, which would indicate less intracellular volume and axonal diameter; white matter mean RTOP and RTAP were increased.18 Increased RTPP indicates less axonal dispersion in the white matter, possibly indicating decreased white matter fiber density.18 Non-Gaussianity does not indicate any microstructural differences in general but does indicate the degree to which the MAP model captures the diffusion signal better than DTI in which case it can be seen that average NG makes up about 40% of the signal in both groups. Further study with more participants is required to determine if these differences meaningfully describe neurological deficits in HD patients but this study is a good first step to showing the benefit of using more complex MRI acquisitions and analysis.Conclusion
We showed in a limited pilot study the efficacy of MAP MRI in furthering understanding of the microstructural changes in the brain of HD patients.Acknowledgements
The project described was supported by the Daniel M. Soref Charitable Trust.References
1. Bugnicourt, J.M., et al., Cognitive disorders and dementia in CKD: the neglected kidney-brain axis. J Am Soc Nephrol, 2013. 24(3): p. 353-63.
2. Richerson, W.T., et al., Changes in Cerebral Volume and White Matter Integrity in Adults on Hemodialysis and Relationship to Cognitive Function. Nephron, 2021. 145(1): p. 35-43.
3. Fazekas, G., et al., Brain MRI findings and cognitive impairment in patients undergoing chronic hemodialysis treatment. J Neurol Sci, 1995. 134(1-2): p. 83-8.
4. Zhang, L.J., et al., Predominant gray matter volume loss in patients with end-stage renal disease: a voxel-based morphometry study. Metab Brain Dis, 2013. 28(4): p. 647-54.
5. Zhang, R., et al., Reduced white matter integrity and cognitive deficits in maintenance hemodialysis ESRD patients: a diffusion-tensor study. Eur Radiol, 2015. 25(3): p. 661-8.
6. Findlay, M.D., et al., Investigating the Relationship between Cerebral Blood Flow and Cognitive Function in Hemodialysis Patients. J Am Soc Nephrol, 2019. 30(1): p. 147-158.
7. Eldehni, M.T., A. Odudu, and C.W. McIntyre, Randomized clinical trial of dialysate cooling and effects on brain white matter. J Am Soc Nephrol, 2015. 26(4): p. 957-65.
8. Galons, J.P., et al., Hemodialysis increases apparent diffusion coefficient of brain water in nephrectomized rats measured by isotropic diffusion-weighted magnetic resonance imaging. J Clin Invest, 1996. 98(3): p. 750-5.
9. Schaier, M., et al., Vasogenic Brain Edema During Maintenance Hemodialysis : Preliminary Results from Tract-based Spatial Statistics and Voxel-based Morphometry. Clin Neuroradiol, 2021. 31(1): p. 217-224.
10. Reetz, K., et al., Increased cerebral water content in hemodialysis patients. PLoS One, 2015. 10(3): p. e0122188.
11. Olson, D.V., V.E. Arpinar, and L.T. Muftuler, Optimization of q-space sampling for mean apparent propagator MRI metrics using a genetic algorithm. Neuroimage, 2019. 199: p. 237-244.
12. Ozarslan, E., et al., Mean apparent propagator (MAP) MRI: a novel diffusion imaging method for mapping tissue microstructure. Neuroimage, 2013. 78: p. 16-32.
13. Tustison, N.J., et al., N4ITK: improved N3 bias correction. IEEE Trans Med Imaging, 2010. 29(6): p. 1310-20.
14. Zhang, Y., M. Brady, and S. Smith, Segmentation of brain MR images through a hidden Markov random field model and the expectation-maximization algorithm. IEEE Trans Med Imaging, 2001. 20(1): p. 45-57.
15. Schmidt, P., et al., Automated segmentation of changes in FLAIR-hyperintense white matter lesions in multiple sclerosis on serial magnetic resonance imaging. Neuroimage Clin, 2019. 23: p. 101849.
16. Andersson, J.L.R. and S.N. Sotiropoulos, An integrated approach to correction for off-resonance effects and subject movement in diffusion MR imaging. Neuroimage, 2016. 125: p. 1063-1078.
17. Fick, R.H.J., et al., MAPL: Tissue microstructure estimation using Laplacian-regularized MAP-MRI and its application to HCP data. Neuroimage, 2016. 134: p. 365-385.
18. Zucchelli, M., et al., What lies beneath? Diffusion EAP-based study of brain tissue microstructure. Med Image Anal, 2016. 32: p. 145-56.
Figures