1122
White matter hyperintensities and their dynamic nature: diffusion MRI analysis of white matter hyperintensity regression1Centre for Clinical Brain Sciences, University of Edinburgh, Edinburgh, United Kingdom, 2UK Dementia Research Institute, University of Edinburgh, Edinburgh, United Kingdom
Synopsis
White matter hyperintensities (WMH) have been shown to progress over time but they might regress too. Little is known about the regression of WMH as the main focus has been on progression. We investigate WMH regression and their dynamic properties using diffusion MRI. Areas of WMH change, both progression and regression, might have different tissue integrity properties than areas that are more stable, i.e. stable normal-appearing white matter (NAWM), become more hyperintense, or stable WMH. Mean diffusivity and peak width of skeletonized mean diffusivity (PSMD) might be most sensitive to subtle integrity changes before they become visible on structural MRI.
Introduction
White matter hyperintensities (WMH) are one of the commonest features of cerebral small vessel disease, which are visible as hyperintense lesions on T2w imaging.1 WMH can have serious clinical consequences including decline in cognition2 and gait3, and an increase risk of dementia, stroke and death.4 Progression of WMH over time is widely examined as it is related to worsening clinical symptoms. Some factors related to WMH progression are higher WMH volume at baseline and older age.5 Interestingly, some studies have found regression of WMH, suggesting that WMH are dynamic.6-9 However, not much is known about WMH regression as it is often discarded as a measurement error. This means that we do not know what causes WMH regression and know very little about other MRI measures associated with this regression. Diffusion MRI is shown to be able to detect underlying structural changes of WMH and normal-appearing white matter (NAWM), even before they are visible on conventional MRI.10, 11 We therefore investigate WMH regression and their dynamic properties using diffusion MRI.Methods
We recruited patients with recent mild lacunar or cortical strokes in an ongoing prospective observational study. After informed consent we acquired clinical, demographic and imaging data within three months after stroke as a baseline measure and a 1 year follow-up visit.12 Ethical approval was granted by Southeast Scotland Regional Ethics Committee (Ref 18/SS/0044).At both baseline and the 1-year follow-up, patients underwent MRI scans on a 3T Prisma scanner (Siemens Healthcare, Germany). This included a standard neurovascular imaging protocol (T1w, T2w, FLAIR, and diffusion MRI). We segmented WMH, defined according to STRIVE criteria1, semi-automatically with a previously mentioned approach and manually delineated stroke masks.13 We identified areas of WMH change over time by comparing WMH and NAWM masks between baseline and follow-up visits. This resulted in areas of WMH growth calculated as: areas of positive values when subtracting WMH mask at follow-up from WMH mask at baseline; WMH shrinkage: areas of positive values when subtracting WMH mask at baseline from WMH mask at follow-up; stable WMH: the area of the WMH mask at baseline that intersects with the WMH mask at follow-up; stable NAWM: the area of the NAWM mask at baseline intersecting with the NAWM mask at follow-up. Figure 1 shows an example of these regions in one participant.
Diffusion data were acquired using single-shell diffusion imaging from which we reconstructed diffusion tensor data to obtain fractional anisotropy (FA) and mean diffusivity (MD)12, and measured them within the white matter areas defined above. We calculated the Peak width of Skeletonized Mean Diffusivity (PSMD) using a previously described protocol,10 and plotted this with the data divided in groups by quintiles of net WMH volume change (total WMH volume at follow-up minus total WMH volume at baseline).
Results
Preliminary data provides information of 94 participants (32% female) aged 67.5±9.7 years, (range 40.2-85.5) with diffusion MRI data at both baseline and 1 year follow-up. Total WMH volumes at baseline and follow-up were 14.73±17.23 mL and 15.76±19.00 mL respectively. On average WMH volume increased by 1.02 mL (SD=2.80, range -4.28-12.84 mL). With 40% presenting a global decrease.Comparing areas of white matter changes, baseline and 1-year follow-up FA values (Figure 2) show a similar pattern with highest values for “NAWM stable” followed by “WMH growth”. Areas of “WMH stable” and “WMH shrink” have lowest FA values. MD values (Figure 3) show the opposite pattern, i.e. lowest values for “NAWM stable” and highest values for “WMH stable”.
PSMD results (Figure 4) per quintile of WMH change show higher PSMD for the most increase in WMH volume (Q5), but lowest PSMD for Q3, which has the least net WMH change over time.
Discussion
Areas of NAWM at baseline, whether stable NAWM or developing into WMH, show higher FA and lower MD values than the stable WMH or areas of WMH shrinkage. NAWM at baseline that becomes WMH had lower FA and higher MD at baseline than stable NAWM, indicating some underlying tissue changes that are still invisible. Shrinking WMH had similar FA but lower MD at baseline than stable WMH. PSMD results also suggest that areas of little WMH change (Q3) have better vascular health.The results suggest MD and PSMD might be more sensitive to initial and subtle structural changes than FA, confirming findings from other studies.14, 15
As this is preliminary data from an ongoing study, it is of descriptive nature and limited. This might have led to a fewer women in this sample, however, women are in general less represented in stroke research.16 Future work would involve a larger sample size, clinical information including cognitive data, and other imaging measures including T1 mapping, cerebrovascular reactivity and blood-brain barrier permeability to give more insight in the underlying processes.
Conclusion
WMH are dynamic, showing both regression and progression in individuals. Using diffusion tensor imaging, structural changes can be measured, and seem to be present even before these changes are visible on conventional MRI. In particular, MD and PSMD provide more sensitive information on local and global areas of WMH change. Diffusion results suggest that WMH regression is real and should not be regarded as an error or artefact.Acknowledgements
We gratefully acknowledge funding from the Fondation Leducq Network for the Study of Perivascular Spaces in Small Vessel Disease (16 CVD 05); Stroke Association ‘Small Vessel Disease-Spotlight on Symptoms (SVD-SOS)’(SAPG 19\100068); Alzheimer’s Society (Ref 486, AS-CP-18b-001), University of Edinburgh College of Medicine and Veterinary Medicine, the UK Dementia Research Institute at the University of Edinburgh which receives funding from UK DRI Ltd funded by the UK Medical Research Council, Alzheimer’s Society and Alzheimer’s Research UK. The University 3T MRI Research scanner in RIE is funded by the Wellcome Trust (104916/Z/14/Z), Dunhill Trust (R380R/1114), Edinburgh and Lothians Health Foundation (2012/17), Muir Maxwell Research Fund, Edinburgh Imaging, and University of Edinburgh. We also thank the participants and radiographers for their involvement.
References
Figures
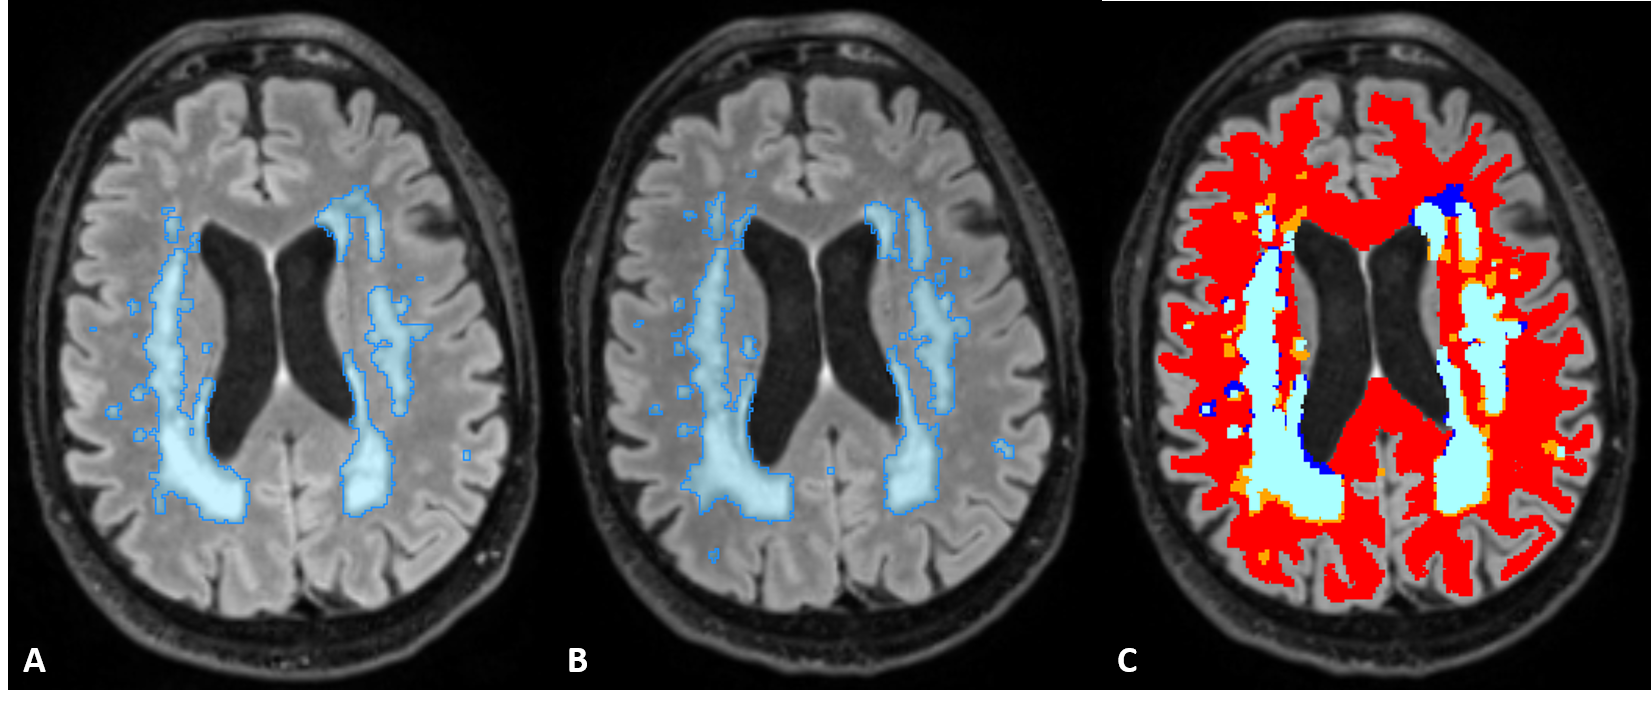
Figure 1. White matter hyperintensity (WMH) regions (blue) segmented at baseline (A), and follow-up (B). C shows NAWM stable (red), areas of WMH stable (light blue), WMH shrinkage (dark blue), and WMH growth (orange). WMH growth was NAWM at baseline.
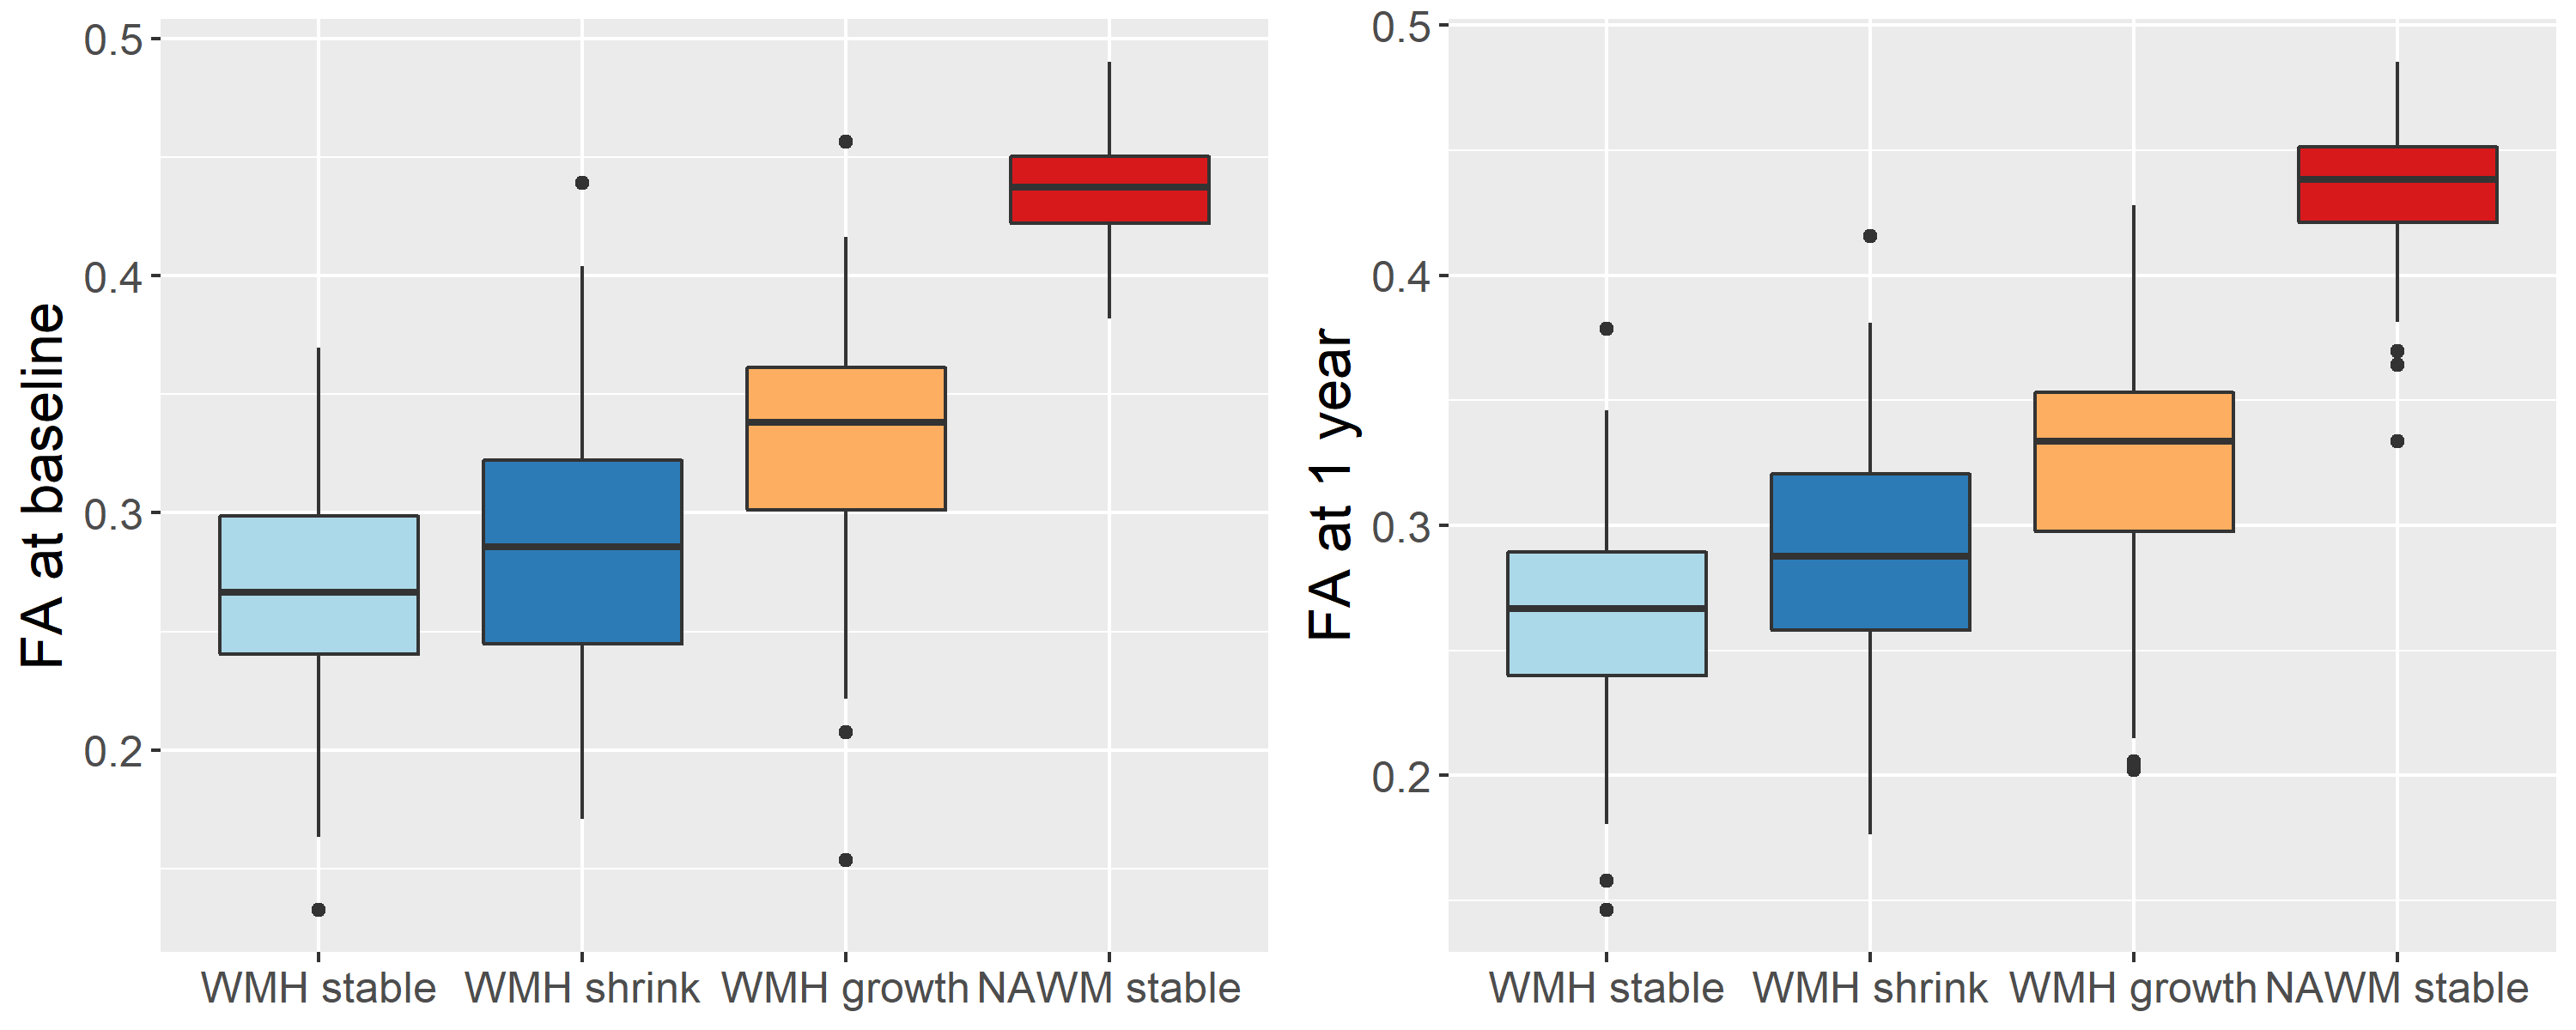
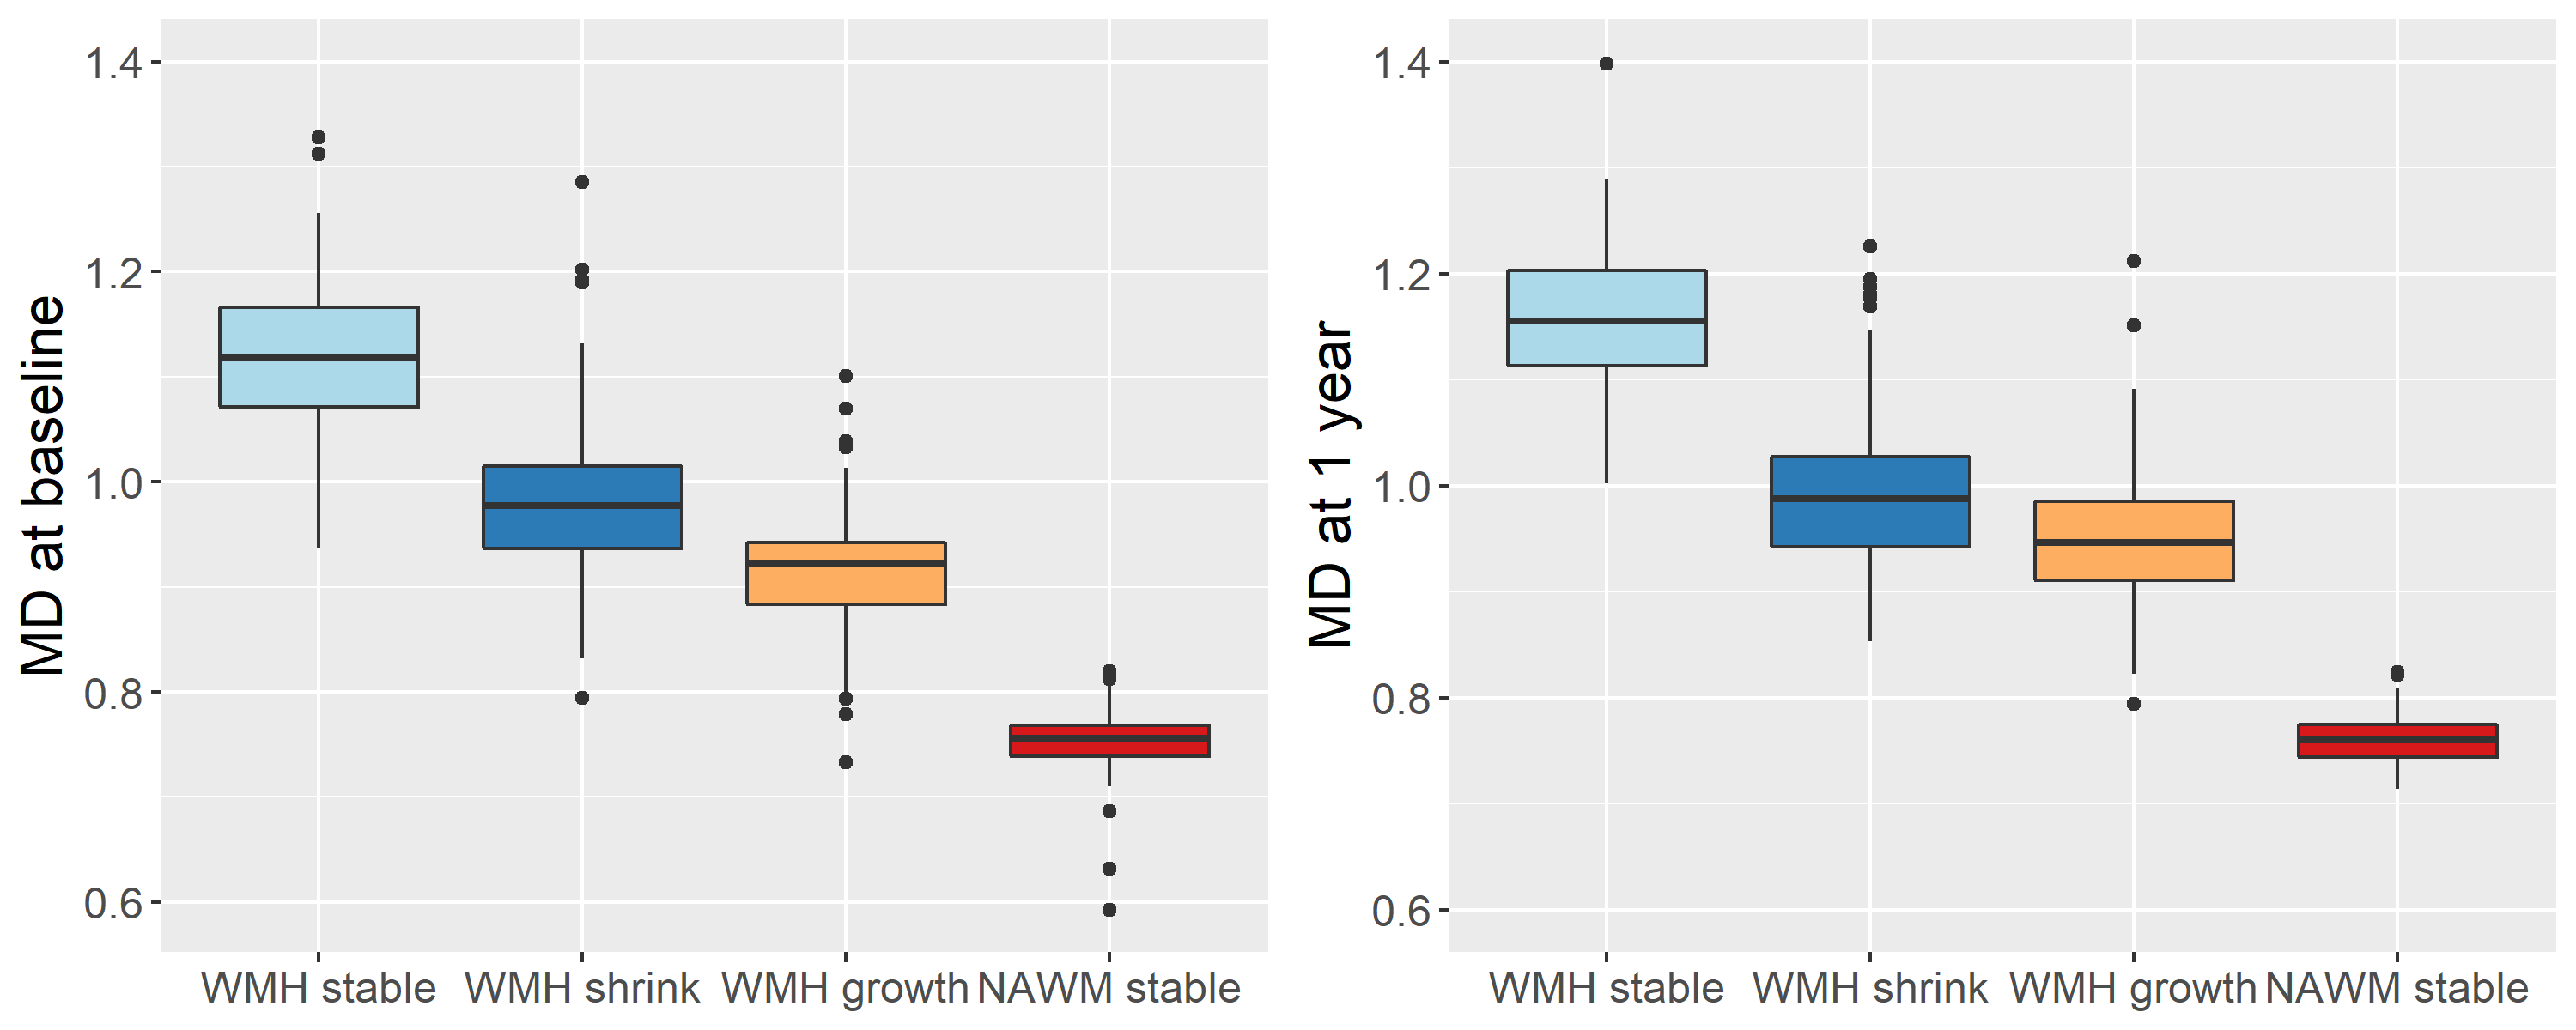
Figure 3. Mean diffusivity (MD) values (x10-3 mm2/s) per region of white matter. MD at baseline (left) and MD at follow-up at one year. Areas of change reflect differences between baseline and follow-up.
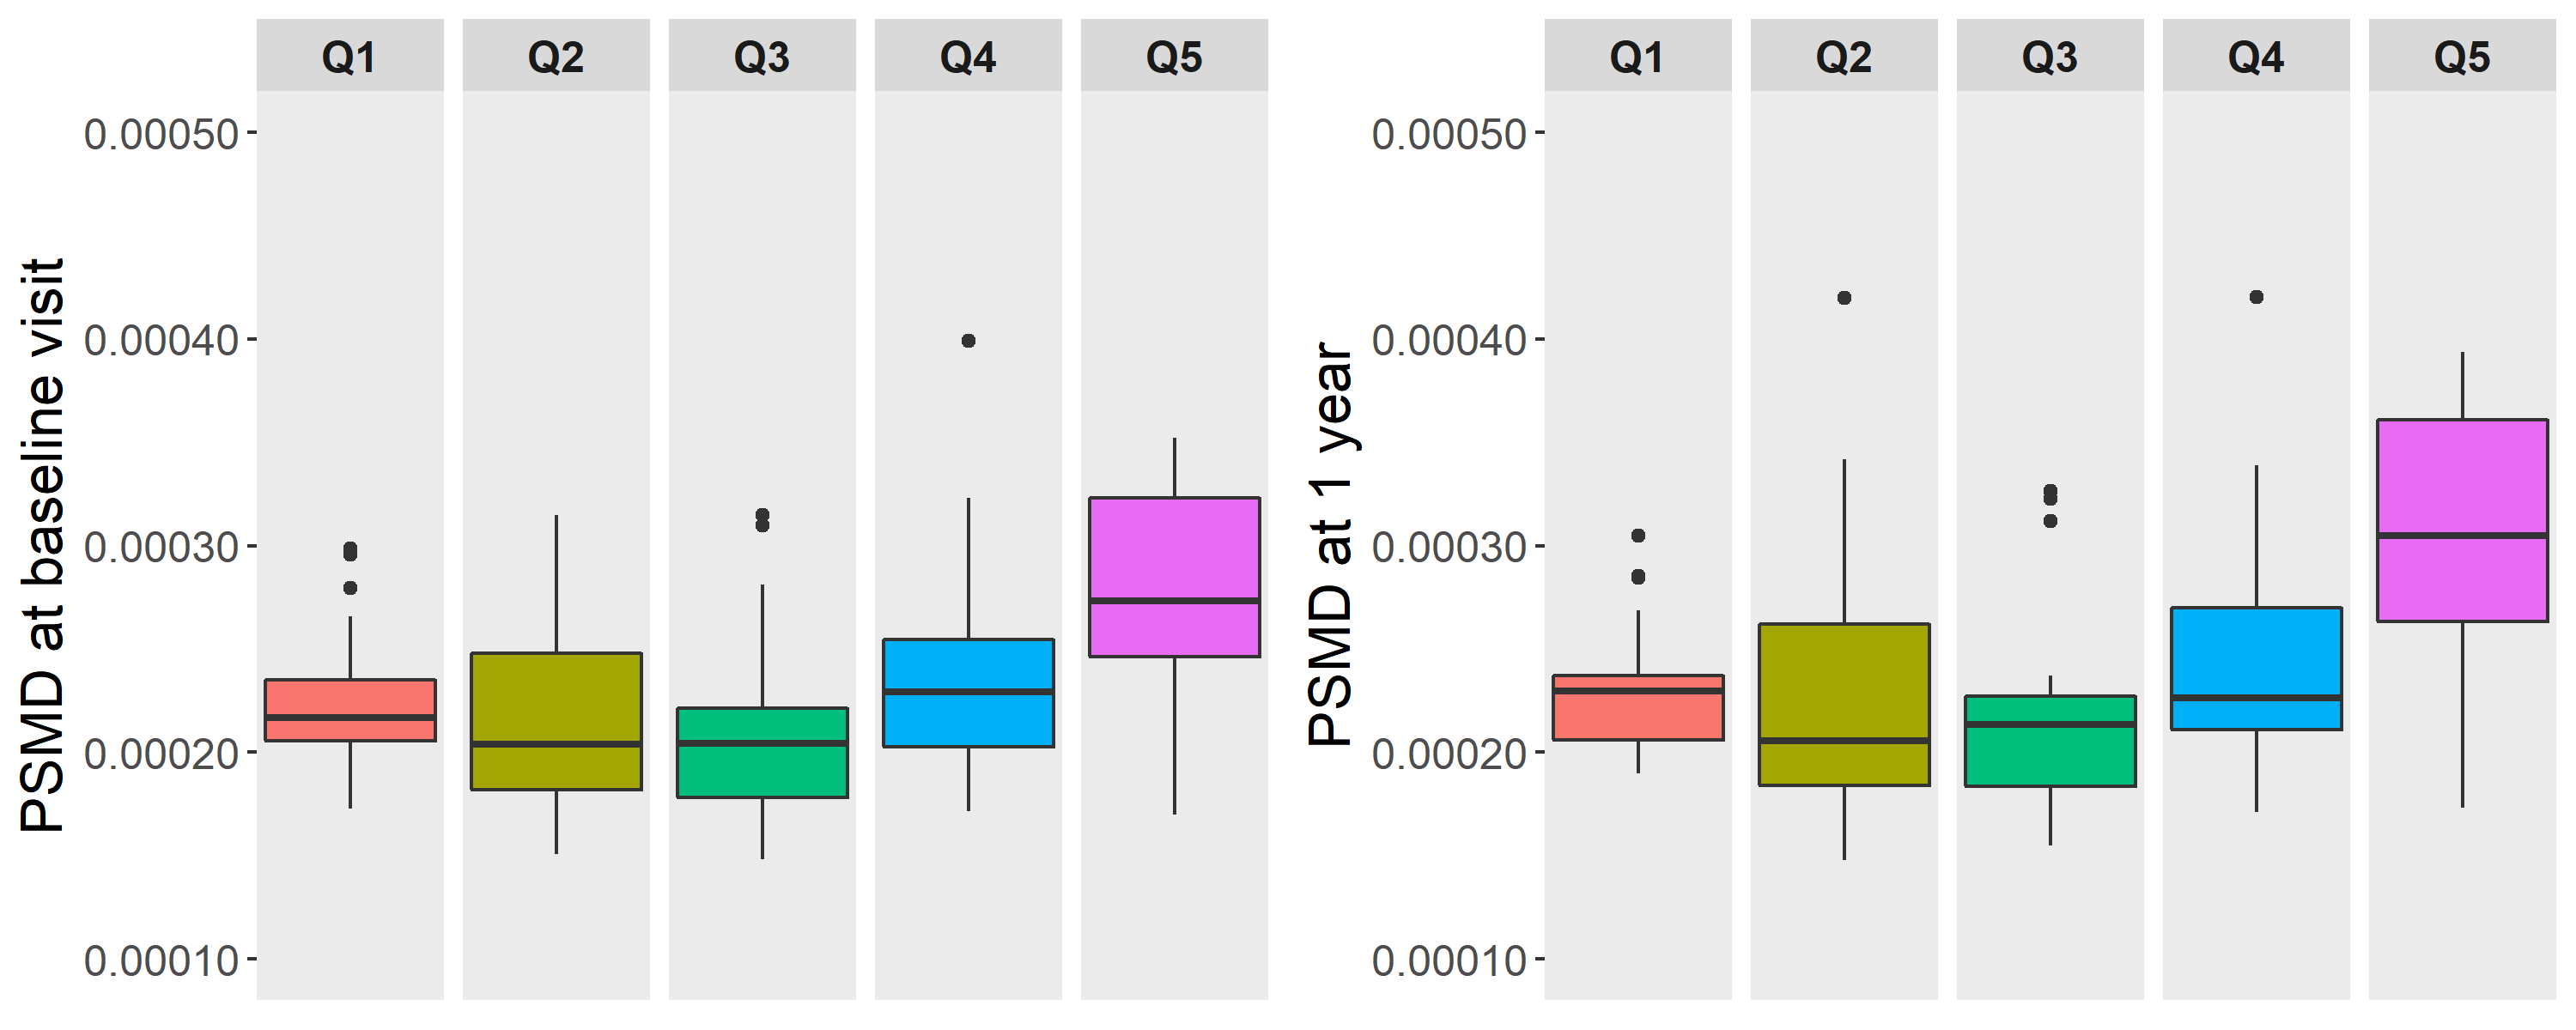
Figure 4. Peak width Skeletonized Mean Diffusivity (PSMD; x10-1 mm2/s) per quintile of total white matter hyperintensity volume change. WMH volume change is the difference between follow-up at 1 year and baseline. Quintile 1 (Q1) represent a decrease in WMH volume and quintile 5 (Q5) represents the highest increase of WMH volume. PSMD is measured at baseline (left) and at 1 year (right).