1121
Derivation of clinically significant low-frequency oscillations in resting-state BOLD fMRI data as a novel marker of endothelial dysfunction1University of Oxford, Oxford, United Kingdom
Synopsis
We tested whether clinically-relevant, vascular-origin low frequency oscillations (LFOs) in 0.05–0.15 Hz could be derived on routinely-acquired resting-state BOLD-fMRI to determine their potential as a marker of vascular dysfunction in cerebral small vessel disease. Our case control study in 840 UK Biobank participants showed a statistically significant increase in LFOs in the arterial vessels of participants with high white matter hyperintensities, consistent with greater transmission of arterial blood pressure to the cerebral circulation in subjects with increased arterial stiffness. LFOs could provide a practical measure, applicable to large datasets and clinical practice, as an index of intracerebral vascular dysfunction.
Introduction
Cerebral small vessel disease (cSVD), manifesting as increased white matter hyperintensities (WMHs) on MRI, is associated with up to 30% of strokes and 40% of dementia1,2 and is associated with increased arterial pulsatility3 and impaired endothelial function. Low-frequency oscillations (LFOs) of vascular origin in the 0.05 – 0.15 Hz range are an autonomically-determined marker of control of cerebral blood flow that correlate strongly with endothelium-dependent cerebrovascular autoregulation.4 Consequently, LFOs could provide a practical method, applicable to large datasets and clinical practice, to assess endothelial function, autonomic-dependent control of cerebral blood flow, and as an index of intracerebral vascular dysfunction in cSVD.5Multiple methods exist for the derivation of low-frequency power in resting-state BOLD data, including amplitude of low-frequency fluctuation (ALFF) and cross-correlation time-delay analysis.6,7 However, there is no consensus on which method is the most suitable for use in BOLD-fMRI, minimal physiological validation of their determinants, and no large studies of their demographic or clinical significance. Therefore, utilising a case-control design, we tested whether clinically-relevant, LFOs of likely vascular origin could be derived on routinely-acquired resting-state BOLD-fMRI to determine their potential as a marker of vascular dysfunction in cSVD.
Methods
Cases were randomly selected from UK Biobank participants with baseline MRI within the top decile of WMH volume (FMRIB Software Library (FSL) -BIANCA), with controls from the bottom decile. Resting-state BOLD fMRI sequences (TR = 0.735 s; TE = 39 ms; duration = 6 min) were pre-processed by motion correction (FSL-MCFLIRT), brain extraction (FSL-BET), and high-pass temporal filtered above 0.04 Hz (FSL-maths). Voxel-wise time series normalisation was performed by de-meaning of the filtered time series and scaling to the robust range (5th-95th centile). Tissue segmentation was performed on participant T1-weighted structural images (FSL-FAST), with transformation to functional space (FSL-FLIRT). Vascular masks for arterial structures and the superior sagittal sinus were generated by thresholds for signal intensity on susceptibility-weighted imaging (SWI) and T2-weighted sequences, within standard ROIs, with sequential dilatation-erosion steps.Standard measurements of ALFF were derived on a voxel-wise basis by the validated Analysis of Functional Neuroimages (AFNI)8 package on all pre-processed, normalised BOLD images. Secondly, power spectra were calculated on a voxel-wise basis (FSL-Pspec), with derivation of the median value for each tissue mask across the entire frequency range and averaged in the LFO domain (LF-power). By transformation to standard space, mean group spatial maps were derived for high- and low-WMH groups. Finally, linear models were constructed to compare LFO markers between high-WMH and low-WMH groups by tissue type, with and without adjustment for clinical characteristics.
Results
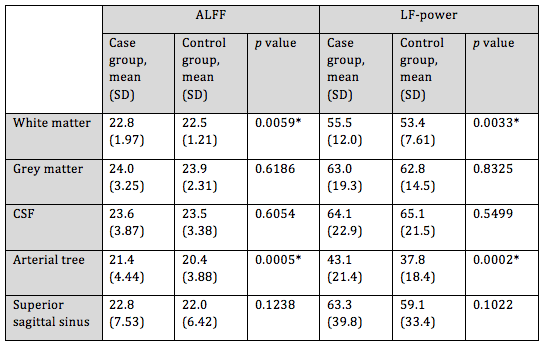
422 high-WMH cases were identified (175 women, 247 men; mean age = 61.6 years) versus 418 controls (259 women, 159 men; mean age = 48.7 years). ALFF and LF-power were strongly correlated, r2 = 0.96 (Figure 1). Individual masks showed significant variation in the presence, magnitude, and central frequency of peaks in the low frequency domain (Figure 2). However, group average power spectra demonstrated significantly greater LFO power with both ALFF and LF-power in the white matter and arterial tree masks of high-WMH subjects (Table 1). A localised, significant peak was seen in group-averaged data at 0.1 Hz in the high-WMH versus low-WMH groups (p = 0.0059) (Figure 3). To exclude significant outlier effects, this analysis was repeated for randomly selected subgroups of cases and controls, each containing 50% of participants, with consistent results in independent populations. Voxel-wise group averages in standard space demonstrated a greater LF-power and ALFF in a distribution consistent with the arterial tree and sagittal sinus in subjects with high WMH (Figure 4a). In contrast, ALFF and LF-power were lower in the grey matter of subjects with high WMHs (Figure 4b).Discussion
Our findings confirmed that ALFF and LF-power within 0.05 – 0.15 Hz are similar indices of LFOs and can be measured in large datasets. The validity of the techniques and physiological relevance of LFOs is supported by the strong concordance between independent methods, consistency of results in randomly selected subgroups, and biological distribution of signal differences. The increased low-frequency power in arterial structures versus reduced power in the parenchyma in subjects with increased WMH is consistent with greater transmission of arterial blood pressure to the cerebral circulation in subjects with increased arterial stiffness, but a likely reduction in endothelial function within the parenchyma. There is a contrast in the average difference across the tissue masks within the parenchyma compared to the individual voxel-wise difference, likely reflecting variation in the direction of effect within the parenchyma.Interpretation of the significance of LFOs in individuals is currently limited by the great variation across subjects in their power spectral density. We plan to further explore the clinical importance of LFOs by derivation of our measurements in all UK Biobank participants, in-house physiological validation by comparison with BOLD responses to inhaled CO2, and possible response of LFOs to the use of vasodilators and anti-hypertensives in on-going clinical trials.
Conclusions
Low-frequency oscillations (0.05–0.15 Hz) in resting state BOLD fMRI time-courses are increased in cerebral arteries and reduced in parenchyma in subjects with increased white matter hyperintensities, providing a novel method to measure abnormal cerebrovascular physiology in small vessel disease.Acknowledgements
We acknowledge support, advice, and assistance from Peter Rothwell, Stephen Payne, Steve Smith, Ludo Griffanti, Amy Lawson, Karolina Wartolowska, and Linxin Li.References
1. Inzitari D, Pracucci G, Poggesi A, et al. Changes in white matter as determinant of global functional decline in older independent outpatients: three-year follow-up of LADIS (leukoaraiosis and disability) study cohort. BMJ. 2009;339:b2477.
2. Shi Y, Wardlaw JM. Update on cerebral small vessel disease: a dynamic whole-brain disease. Stroke Vasc Neurol. 2016;1(3):83-92.
3. Webb AJ, Simoni M, Mazzucco S, et al. Increased cerebral arterial pulsatility in patients with leukoaraiosis: arterial stiffness enhances transmission of aortic pulsatility. Stroke. 2012;43(10):2631-2636.
4. Andersen AV, Simonsen SA, Schytz HW, Iversen HK. Assessing low-frequency oscillations in cerebrovascular diseases and related conditions with near-infrared spectroscopy: a plausible method for evaluating cerebral autoregulation? Neurophotonics. 2018;5(3):030901.
5. Ma Y, Song A, Viswanathan A, et al. Blood Pressure Variability and Cerebral Small Vessel Disease: A Systematic Review and Meta-Analysis of Population-Based Cohorts. Stroke. 2020;51(1):82-89.
6. Zang Y-F, He Y, Zhu C-Z, Cao Q-J, Sui M-Q, Liang M, et al. Altered baseline brain activity in children with ADHD revealed by resting-state functional MRI. Brain Dev. 2007;29: 83–91.
7. Tong Y, Hocke L, Frederick B. Low Frequency Systemic Hemodynamic “Noise” in Resting State BOLD fMRI: Characteristics, Causes, Implications, Mitigation Strategies, and Applications. Frontiers in Neuroscience. 2019;13:787.
8. RW Cox. AFNI: Software for analysis and visualization of functional magnetic resonance neuroimages. Computers and Biomedical Research. 1996;29:162-173.
Figures
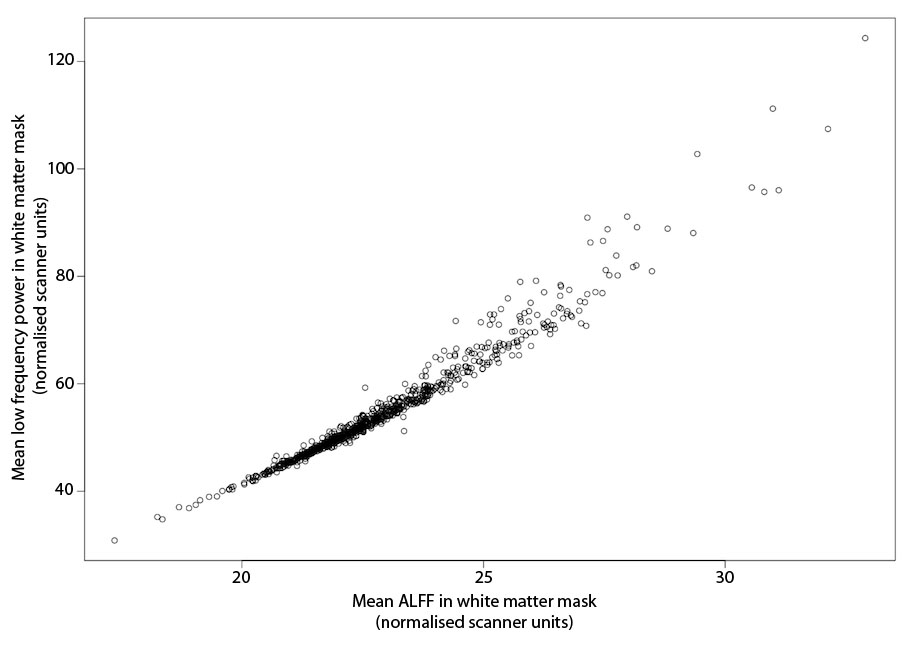
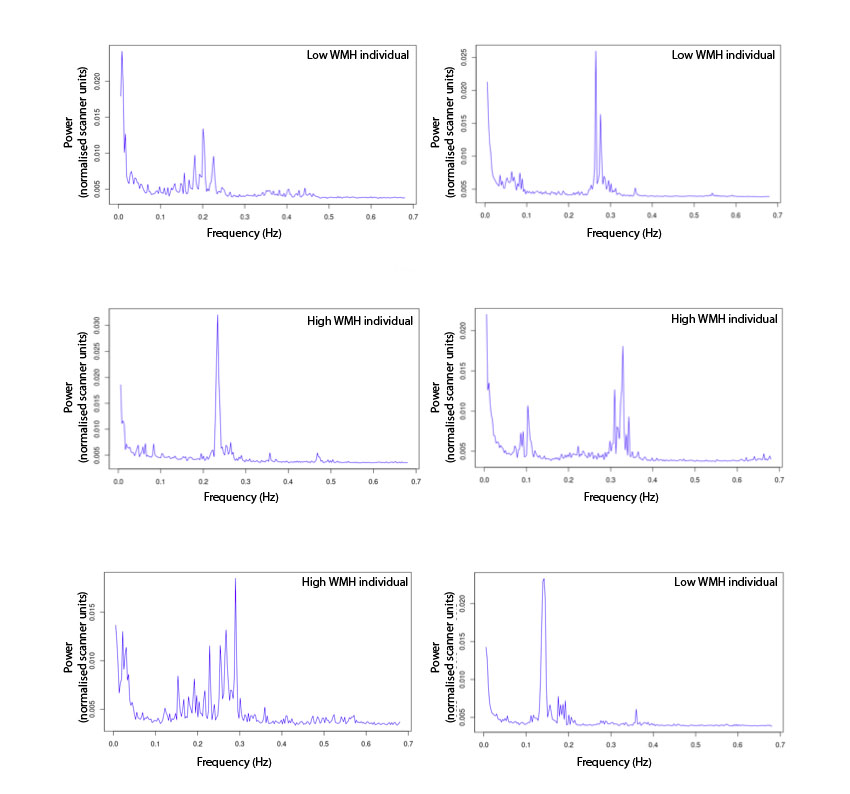
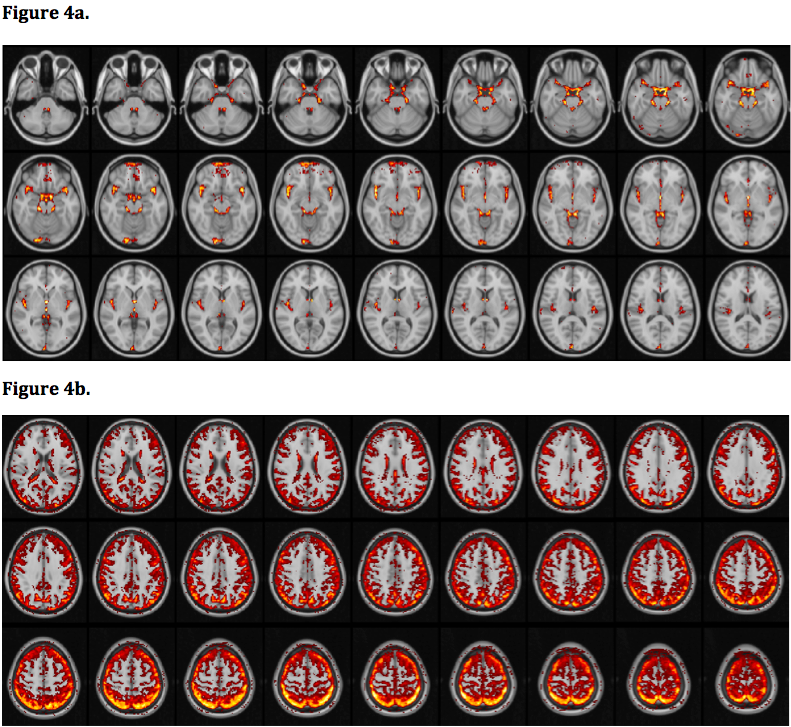
Figure 4
a. Power spectral density (0.05 – 0.15 Hz) group mean spatial maps with high WMH group signal > low WMH group signal
b. Power spectral density (0.05 – 0.15 Hz) group mean spatial maps with low WMH group signal > high WMH group signal