1119
Imaging cardiac purkinje fibers network using ihMT imaging on a clinical 1.5T scanner1Université de Bordeaux, U1045, Bordeaux, France, 2IHU LIRYC, Pessac, France, 3INSERM U1045, Pessac, France, 4Siemens Healthcare SAS, Saint-Denis, France, 5Aix Marseille Univ, CNRS, CRMBM, Marseille, France
Synopsis
The Purkinje fiber network (PF) enables electrical impulses throughout the heart and initiate cardiac contraction. To characterize this network in 3D is of high importance to better understand cardiac arrhythmia mechanisms. This preliminary work performed at 1.5T using a high-resolution coil aims to evaluate the inhomogeneous Magnetization Transfer imaging method to visualize PF and differentiate them from the myocardium in a clinical setup. For the first time we obtained an ihMT contrast between a conductive fiber and myocardium at 1.5T on ex vivo sample with an isotropic resolution of 500 µm.
Introduction
The Purkinje Fibers (PF) is implicated in ventricular fibrillation (leading cause of sudden cardiac death [1]). 3D imaging of PF at sub-millimetric spatial resolution is therefore of high importance to understand the mechanisms of ventricular arrhythmia. Magnetization transfer (MT) imaging was demonstrated to improve contrast between PF and cardiac muscle at 9.4T, presumably due to different responses of myocardium tissue and collagen surrounded PF [2]. Beside conventional MT, inhomogeneous MT (ihMT) [3] was recently proposed to explore new contrast mechanisms related to the dipolar order relaxation times (T1D) of tissues, mainly in the brain. This preliminary study on ex vivo cardiac samples from pig combines dedicated MRI-sequence and a home-made small receiver coil to evaluate ihMT imaging at 1.5T, to better visualize PF and differentiate them from the myocardium.Methods
Sample: A small piece (2 x 2 x 1.5 cm3) of a pig heart was selected from the anterior side of a left ventricle due to its natural abundance of free running fibers in this region (Figure 1-(A)). Sample was fixed in 10% formaldehyde (total fixation solution of 1 L) containing 2 mL of Gd-DOTA. The sample temperature was maintained at 35 ± 1° with circulating water tubing surrounding the sample.MR acquisitions: All experiments were performed at 1.5T (MAGNETOM Aera, Siemens Healthcare, Erlangen, Germany) using the body coil for transmission and a 2 cm diameter receive-only loop coil [4]. T1 was measured using a 2D inversion recovery turbo spin echo sequence (55 s/image), with TE/TR/alpha=8.9 ms/500 ms/90°, 9 inversion times (TI) ranging 50 to 450 ms by 50 ms increments. A multi-gradient echo 2D sequence (26 s acquisition time) was run to map T2* with TR = 744 ms, , 8 echoes starting at 7.56 ms with increments of 8.42 ms. Identical spatial resolution of 0.6 x 0.6 x 2 mm was used for both T1 and T2* relaxation times measurements.
A prototype 3D ihMT RAGE sequence [6] was acquired at an isotropic resolution of 0.5 mm with TE/TR/alpha/NEX=4.89 ms/ 2000 ms/ 7°/1. An off-resonance (∆f) ihMT module was applied, consisting of 5 ms Tukey pulses repeated several times, varying the number of burst (Nb) and pulses repetition time (BTR). The parameters of the ihMT preparation are reported in table 1, each ihMT measurement included acquisition of 6 images: 1 image without ihMT module (MT0), 1 image (MT+) at +∆f, 1 image (MT-) at -∆f, 2 images (MT+- ), obtained with cosine modulated pulses. The set of 5 images was acquired in 19 min for each tested BTR and ∆f values.
Post processing: Inversion time was estimated by user to characterize the nulling of signal in the tissue and fiber, T1 was calculated by T1 (ms)=TI/ln2. T2* and M0 maps were obtained from exponential curve fitting on a pixel-by pixel basis using a homemade program in Matlab. Two ROIs localized in the fiber and muscle were drawn to compute the mean±standard deviation of each value. ihMT contrast and ihMTratio (ihMTR) maps were computed by:
ihMT = (MT++ MT-) – 2MT+- and ihMTR(%) = 100*ihMT/MT0.
A PCA denoising and cos kernel apodization filters were applied on native images to compute the ihMTR maps (interpolated isotropic resolution of 0.25 mm). ROI were manually performed in the fiber and the myocardium on ihMT contrast images and reported to ihMTR map to obtain a mean ± standard deviation of ihMTR in both tissues.
Results
T1, T2* and M0 values are listed in Table 2 and show similar values. A 3D volume rendering of MT0 extracted from ihMT acquisition is presented in figure 2 with an isotropic resolution of 500 µm. We can identify free running PF with the red arrow.Figure 3 presents a slice containing free running PF and cardiac tisssue extracted from the MT0, MT+ , ihMT and ihTMR volumes after post processing at a istropic resolution of 250 µm. These images correspond to an optimal contrast of ihMTR (last map on figure 3) between PF and cardiac tissue observed at BTR=100 ms and ∆f = 10 kHz. On the ihMTR image, PF appears in hypersignal (red arrow), in contrast with the cardiac tissue (blue arrow) with a relative ihMTR contrast difference more than 70 ± 12% between tissue and cardiac fiber.
Discussion and Conclusion
For the first time we report an ihMT contrast between a cardiac conductive fiber and myocardium at 1.5T. We were able to obtain a 3D MRI volume with an isotropic resolution of 500 µm (interpolated to 250 µm pixel spacing) on an ex vivo heart sample from pig. This result indicates the potential for ihMT to create a positive contrast on the PF relative to the myocardium to visualize the rapid conduction network of the ventricle, which is of major importance for better characterization of fatal ventricular arrhythmia.Acknowledgements
This study received financial support from the French Government by the National Research Agency (ANR; SYNATRA ANR-21-CE19-0014-01 and CARCOI ANR-19-CE19-0008) ).
References
[1] Haissaguerre M, Vigmond E, et al. Ventricular arrhythmias and the His-Purkinje system. Nat Rev Cardiol. 2016;13(3):155-166.10.1038/nrcardio.2015.193.
[2] Magat J, Fouillet A, et al. 3D magnetization transfer (MT) for the visualization of cardiac free-running Purkinje fibers: an ex vivo proof of concept. MAGMA 2021 34(4):605-618. 10.1007/s10334-020-00905-w.
[3] Varma G, Duhamel G, et al. Magnetization transfer from inhomogeneously broadened lines: A potential marker for myelin. MRM. 2015;73(2):614-622.10.1002/mrm.25174.
[4] Delcey M. Saniour I., et al, Initial technical developments of local RF coil for sub-millimeter cardiovascular MRI., ISMRM abstract number #1196.
[5] Varma G. Munsch F, et al Three-dimensional inhomogeneous Magnetization Transfer with RApid Gradient Echo (3D ihMTRAGE) imaging MRM. 2020; 84(6):2964-2980.10.1002/mrm.28324.
Figures
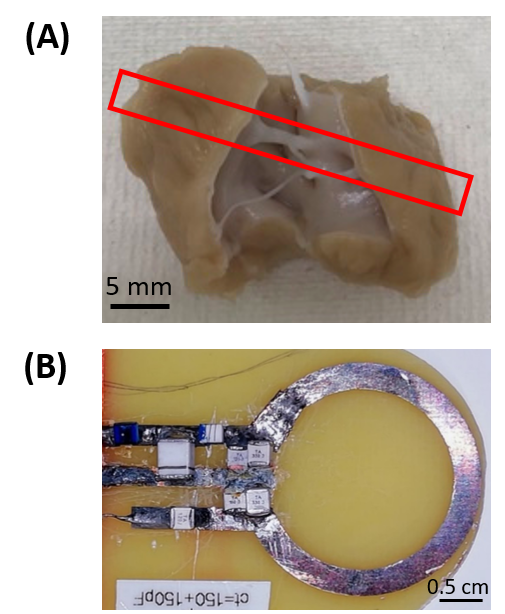
Figure 1:(A) cardiac sample from pig containing free running fibers (2 x 2 x 1.5 cm3).(B) Photograph of receive coil used during experiments

Table 1: Parameters of ihMT preparation

Table 2: Mean of MR parameters: T1, T2* (ms) and M0 (a.u) measured for both fiber and cardiac tissue at 1.5 T.
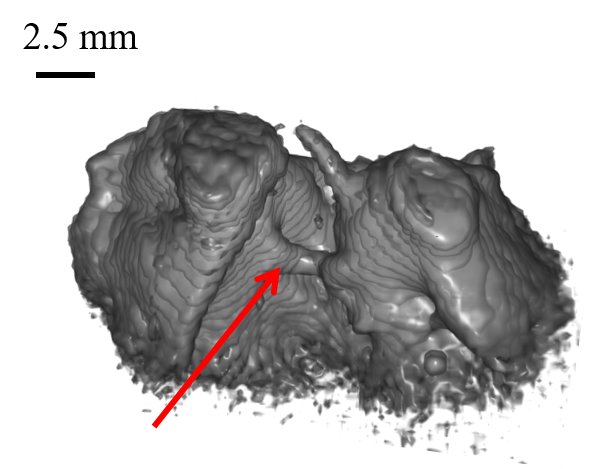
| Figure 2:3D volume rendering of MT0 extracted from ihMT acquisition at an istropric resolution of 500 µm. Red arrow indicates the PF |
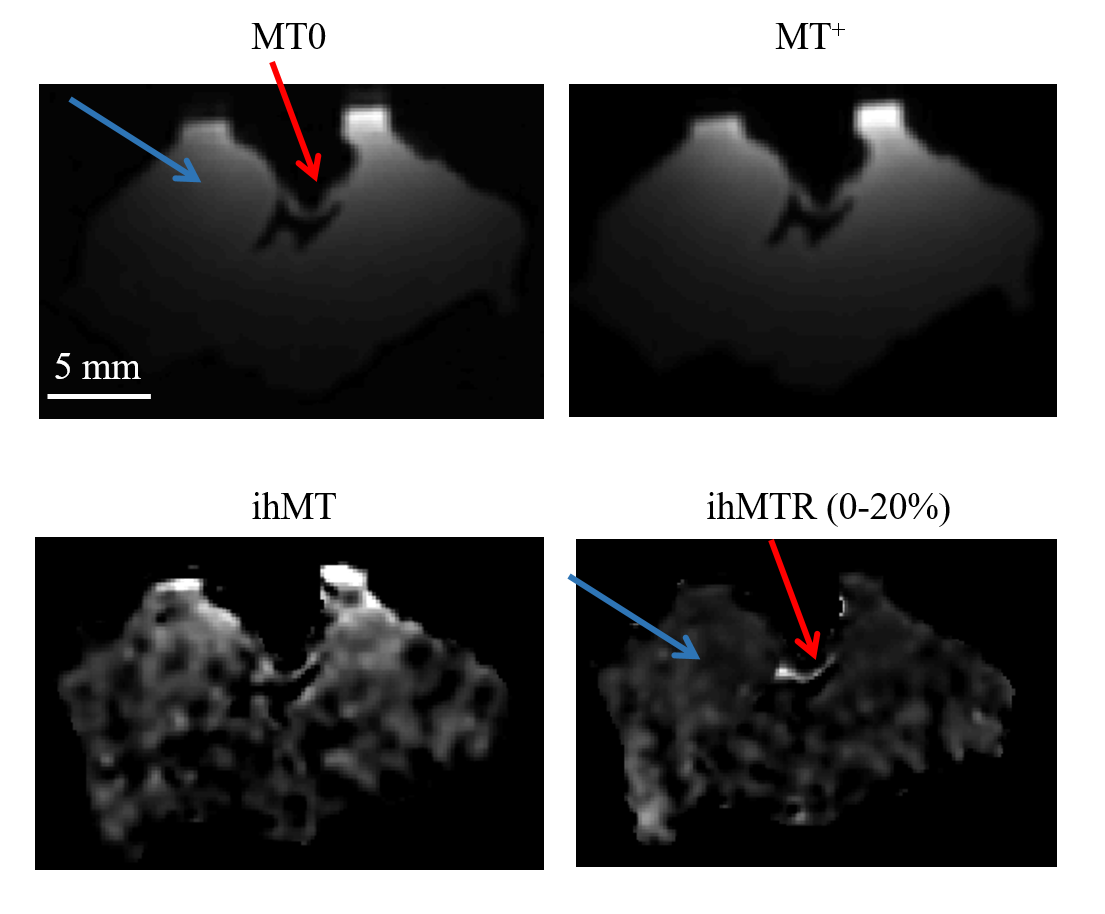
Figure 3: Example of MT0, MT+, ihMT and ihMTR (0-20%) at frequency offset of 10kHz and BTR=100ms and an isotropic resolution of 250 µm. Red arrow indicates the PF, and blue arrow the cardiac tissue.