1114
3D super-resolution motion-corrected cardiac T1 mapping1Physikalisch-Technische Bundesanstalt (PTB), Braunschweig and Berlin, Germany, 2Charité Medical Faculty University Medicine, Berlin, Germany, 3Working Group on Cardiovascular Magnetic Resonance, Experimental and Clinical Research Center (ECRC), DZHK partner site Berlin, Berlin, Germany, 4Department of Cardiology and Nephrology, HELIOS Klinikum Berlin Buch, Berlin, Germany, 5School of Biomedical Engineering and Imaging Sciences, King's College London, London, United Kingdom, 6Department of Biomedical Engineering, Technical University of Berlin, Berlin, Germany
Synopsis
Cardiac T1 mapping provides valuable quantitative information about fibrosis in various cardiac diseases. Due to SNR limitations and the motion of the heart during imaging, often 2D T1 Maps with only low through-plane resolution (i.e. slice thickness of 6-8 mm) can be obtained. We present a model-based super-resolution reconstruction which combines multiple stacks of 2D acquisitions with 6 mm slice thickness and generates 3D high-resolution T1 maps. Cardiac and residual respiratory motion is corrected for. The approach was evaluated in native T1 mapping in three healthy volunteers and provided precise T1 maps with improved visualization of small structures.
Introduction
T1 mapping allows for the diagnosis of a wide range of heart diseases[1,2,3]. Although 3D T1 mapping is possible[4], it is time consuming and hence 2D T1 mapping is more commonly done. 2D T1 maps usually have high in-plane resolution but suffer from poor through-plane resolution of 6-8 mm[5]. Better slice resolution is limited by SNR and scan time restrictions.In this work we propose a model-based super-resolution reconstruction (SRR) for cardiac T1 mapping. Multiple stacks of 2D acquisitions of 6 mm slices are combined to a final high-resolution 3D T1 map. Cardiac and respiratory motion correction are used to minimize artefacts due to physiological motion.
Methods
As shown in Figure 1, multiple stacks of six 2D slices were acquired continuously with a golden-angle radial sampling scheme with one breathhold per stack. In a first step, non-rigid cardiac motion was estimated and utilized in a model-based T1 reconstruction[5] leading to T1 weighted images γw and parameter maps γm (6 slices à 6mm per stack). In a second step, the stacks are registered to each other to correct for different breathhold positions. The cardiac and respiratory motion corrected γm are then used to calculate the first estimate of the high-resolution map Γm0 which is used as an initialization for the SRR. Finally, a high-resolution T1 map Γmfinal is obtained with SRR.Data acquisition
Data was acquired using a golden-angle radial sampling scheme on 3 Tesla (Verio, Siemens Healthineers, Erlangen, Germany) with a 32-channel cardiac coil. After a slice-selective inversion pulse, data is acquired continuously for 2.8s: flip angle α: 5°, resolution: (1.3×1.3×6.0) mm³, FOV: (320×320×63-82.5) mm3. Stacks with 6 slices were acquired with a subject specific slice gap of 3-6 mm (total acquisition time of 17s per stack). Six to eight stacks (one breathhold per stack) were acquired in total with an offset of 1.5 mm between stacks along the slice direction. Due to the short acquisition time, a slice-selective inversion pulse is used in combination with an interleaved multi-slice mode.
Cardiac motion estimation
Dynamic T1-weighted images were reconstructed with a temporal resolution of 100 ms to estimate non-rigid cardiac motion using NiftyReg[6]. Spatial and temporal total variation (TV) regularization was applied to minimize undersampling artefacts[7].
Model-based T1 reconstruction
The estimated cardiac motion information was utilized in a model-based T1 reconstruction[5]. A Look-Locker model $$$q(m)$$$ was used in an iterative reconstruction scheme to estimate γm with the quantitative parameter m = [p, α, T1] and γw, p denoting the proton density. A first simple interpolation of all γm to a high-resolution image is used as initialization Γm0 of SRR.
Breathhold registration
Each stack was acquired in a different breathhold. To correct for any difference in breathhold position, the stacks were registered to each other using NiftyReg[6] in an iterative fashion. Only translational shifts were considered.
Model-based super-resolution reconstruction (SRR)
For SRR, several low-resolution stacks acquired with an offset to each other are combined to a high-resolution volume[8]. For T1 maps, the T1 signal model can be incorporated into SRR[9]. The SRR can be described as an optimization problem that minimizes the discrepancy between the low-resolution data $$$\gamma^w$$$ predicted from the high-resolution volume Γm and the acquired data, $$$\tilde{\gamma}^w$$$:
$$$\Gamma^m_{final}= \underset{\Gamma^m}{\mathrm{argmin}} \sum_{t=1}^{T} \sum_{s=1}^{S} ||\tilde{\gamma}^w_{t,s}-{\gamma}^w_{t,s}(\Gamma^m)||_2^2+\lambda TV(\Gamma^m)$$$
For prediction, the slice profile $$$A$$$ calculated from Bloch simulations of the employed RF pulse is used[10, 11]:
$$${\gamma}^w_{t,s}(\Gamma^m)=A_s q_t(\Gamma^m)$$$
$$$t$$$ is the inversion time and $$$s$$$ the stack index. A TV regularization was added with weighting $$$\lambda $$$. The minimization of the cost function was carried out using the Limited-memory Broyden–Fletcher–Goldfarb–Shanno algorithm[12].
Evaluation
T1 values were assessed with bull’s eye plots[13], using four selected slices (apex, apical, mid-cavity and basal). The contrast to noise ratio (CNR) in the right ventricle and the septum was calculated. All values are given as averages over all three volunteers.Results and discussion
Figure 2 shows the successful correction of cardiac motion. Respiratory motion correction improved alignment between stacks (Fig. 3). Although the combination of stacks to Γm0 already shows an improvement compared to γm, the visibility of small structures as e.g. the right ventricle is further improved in Γm final using SRR (Fig. 4). The precision of the T1 values is not affected by SRR, which is confirmed by a low standard deviation before and after SRR, as can be seen in Figure 5. CNR in the right ventricle increased from 3.9 ± 1.3 in γm to 5.0 ± 1.3 in Γmfinal. In the septum, an increase of CNR from 3.9±0.7 in γm to 7.3±2.9 in Γmfinal could be achieved.Conclusion
The proposed SRR approach provided T1 maps with high through-plane resolution and high CNR. The approach was successfully applied in three healthy volunteers leading to improved visualization of small structures and precise T1 values.Acknowledgements
The authors gratefully acknowledge funding from the German Research Foundation (GRK2260, BIOQIC).The results presented here have been developed in the framework of the 18HLT05 QUIERO Project. This project has received funding from the EMPIR programme co-financed by the Participating States and from the European Union’s Horizon 2020 research and innovation programme.
References
[1] Puntmann, V. O., Voigt, T., Chen, Z., Mayr, M., Karim, R., Rhode, K., Pastor, A., Carrhite, G., Razavi, R., Schaeffter, T., & Nagel, E. (2013). Native T1 mapping in differentiation of normal myocardium from diffuse disease in hypertrophic and dilated cardiomyopathy. JACC: Cardiovascular Imaging. https://doi.org/10.1016/j.jcmg.2012.08.019
[2] Karamitsos, T. D., Piechnik, S. K., Banypersad, S. M., Fontana, M., Ntusi, N. B., Ferreira, V. M., Whelan, C. J., Myerson, S. G., Robson, M. D., Hawkins, P. N., Neubauer, S., & Moon, J. C. (2013). Noncontrast T1 mapping for the diagnosis of cardiac amyloidosis. JACC: Cardiovascular Imaging. https://doi.org/10.1016/j.jcmg.2012.11.013
[3] Germain, P., Ghannudi, S. El, Jeung, M.-Y., Ohlmann, P., Epailly, E., Roy, C., & Gangi, A. (2014). Native T1 Mapping of the Heart – A Pictorial Review. Clinical Medicine Insights: Cardiology. https://doi.org/10.4137/cmc.s19005
[4] Nordio, G., Henningsson, M., Chiribiri, A., Villa, A. D. M., Schneider, T., & Botnar, R. M. (2017). 3D myocardial T1 mapping using saturation recovery. Journal of Magnetic Resonance Imaging, 46(1), 218–227. https://doi.org/10.1002/jmri.25575
[5] Becker, K. M., Schulz-Menger, J., Schaeffter, T., & Kolbitsch, C. (2019). Simultaneous high-resolution cardiac T1 mapping and cine imaging using model-based iterative image reconstruction. Magnetic Resonance in Medicine. https://doi.org/10.1002/mrm.27474
[6] D. Rueckert, L. I. Sonoda, C. Hayes, D. L. G. Hill, M. O. Leach and D. J. Hawkes, "Nonrigid registration using free-form deformations: application to breast MR images," in IEEE Transactions on Medical Imaging, vol. 18, no. 8, pp. 712-721, Aug. 1999, doi: 10.1109/42.796284.
[7] Block, K. T., Uecker, M., & Frahm, J. (2007). Undersampled radial MRI with multiple coils. Iterative image reconstruction using a total variation constraint. Magnetic Resonance in Medicine, 57(6), 1086–1098. https://doi.org/10.1002/mrm.21236
[8] Greenspan, H., Oz, G., Kiryati, N., & Peled, S. (2002). MRI inter-slice reconstruction using super-resolution. Magnetic Resonance Imaging, 20(5), 437–446. https://doi.org/10.1016/S0730-725X(02)00511-8
[9] Van Steenkiste, G., Poot, D. H. J., Jeurissen, B., den Dekker, A. J., Vanhevel, F., Parizel, P. M., & Sijbers, J. (2017). Super‐resolution T 1 estimation: Quantitative high resolution T 1 mapping from a set of low resolution T 1 ‐weighted images with different slice orientations. Magnetic Resonance in Medicine, 77(5), 1818–1830. https://doi.org/10.1002/mrm.26262
[10] Rund, A., Aigner, C. S., Kunisch, K., & Stollberger, R. (2018). Simultaneous multislice refocusing via time optimal control. Magnetic Resonance in Medicine, 80(4), 1416–1428. https://doi.org/10.1002/mrm.27124
[11] Pauly, J., Le Roux, P., Nishimura, D., & Macovski, A. (1991). Parameter relations for the Shinnar-Le Roux selective excitation pulse design algorithm (NMR imaging). IEEE Transactions on Medical Imaging, 10(1), 53–65. https://doi.org/10.1109/42.75611
[12] Liu, D. C., & Nocedal, J. (1989). On the limited memory BFGS method for large scale optimization. Mathematical Programming, 45(1–3), 503–528. https://doi.org/10.1007/BF01589116
[13] Cerqueira, M. D., Weissman, N. J., Dilsizian, V., Jacobs, A. K., Kaul, S., Laskey, W. K., Pennell, D. J., Rumberger, J. A., Ryan, T., & Verani, M. S. (2002). Standardized Myocardial Segmentation and Nomenclature for Tomographic Imaging of the Heart. Circulation, 105(4), 539–542. https://doi.org/10.1161/hc0402.102975
Figures
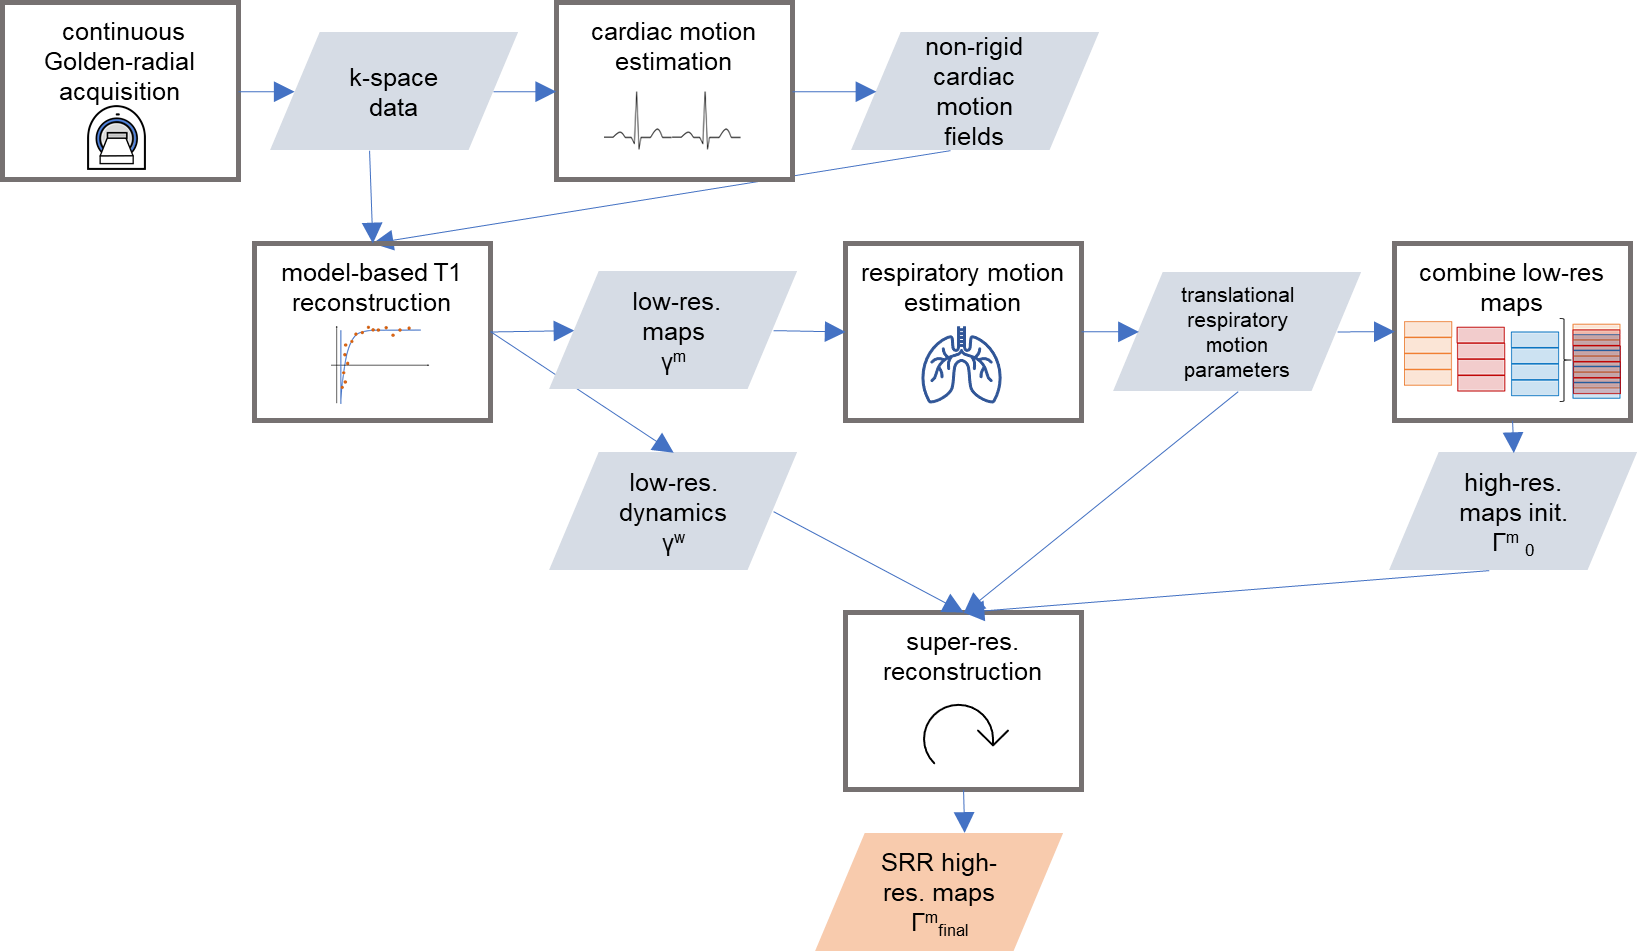
Figure 1: Motion-corrected model-based SRR workflow: Acquisition of several stacks with multiple 2D slices, followed by estimation of the cardiac motion fields. An incorporation of these into model-based T1 reconstruction yields T1-weighted images γw and parameter maps γm of the low-res. stacks. Then, differences in breathholds are compensated for. The motion corrected γm are used to calculate the first estimate of the high-res. map Γm0. SRR yields the final 3D high-res. parameter map Γmfinal.
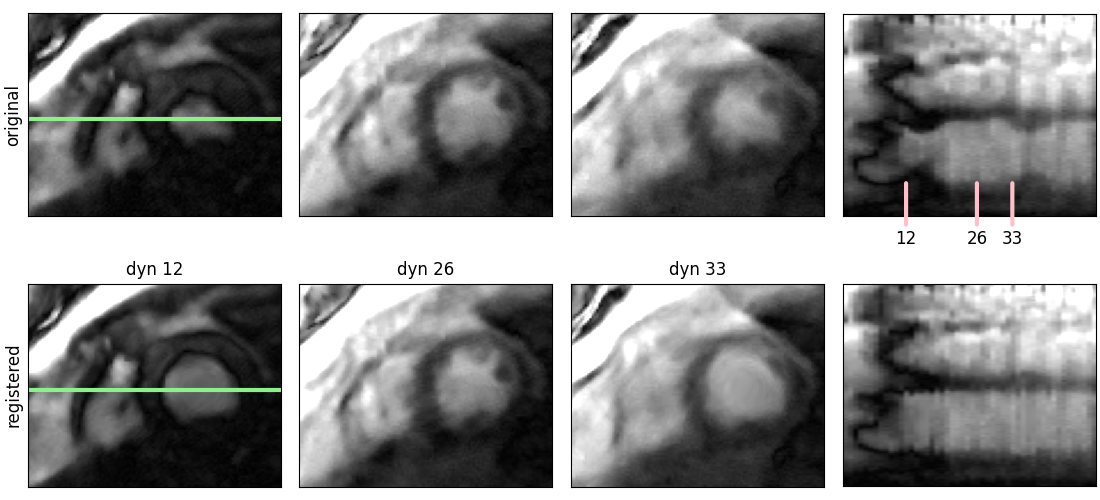
Figure 2: Estimation of cardiac motion: Comparison between original and registered dynamic images. A spatial-temporal plot along the green line is also shown. In the original images the heart motion is clearly visible as temporal changes of the septum and the left ventricular wall. Motion correction ensures all images are in the same cardiac phase.
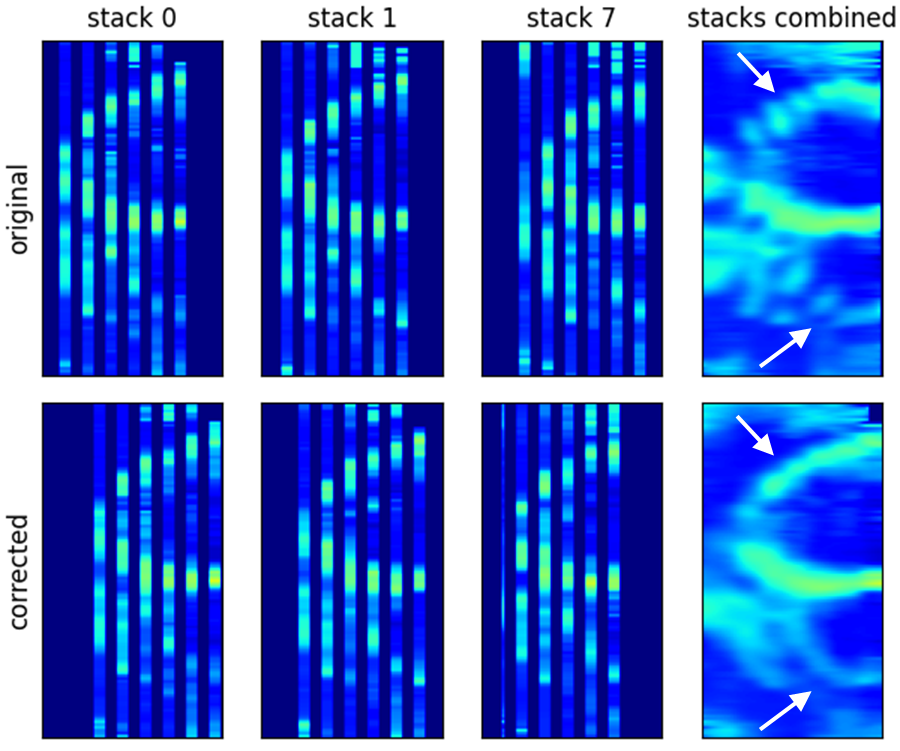
Figure 3: Comparison of original and respiratory motion corrected stacks and their calculated average. Gaps between low-resolution slices during acquisition are represented as empty space. Misalignment between the stacks due to differences in breathhold positions can be clearly seen (white arrows). An iterative respiratory motion correction scheme could successfully realign the stacks and improve the visualization of the left and right ventricle.
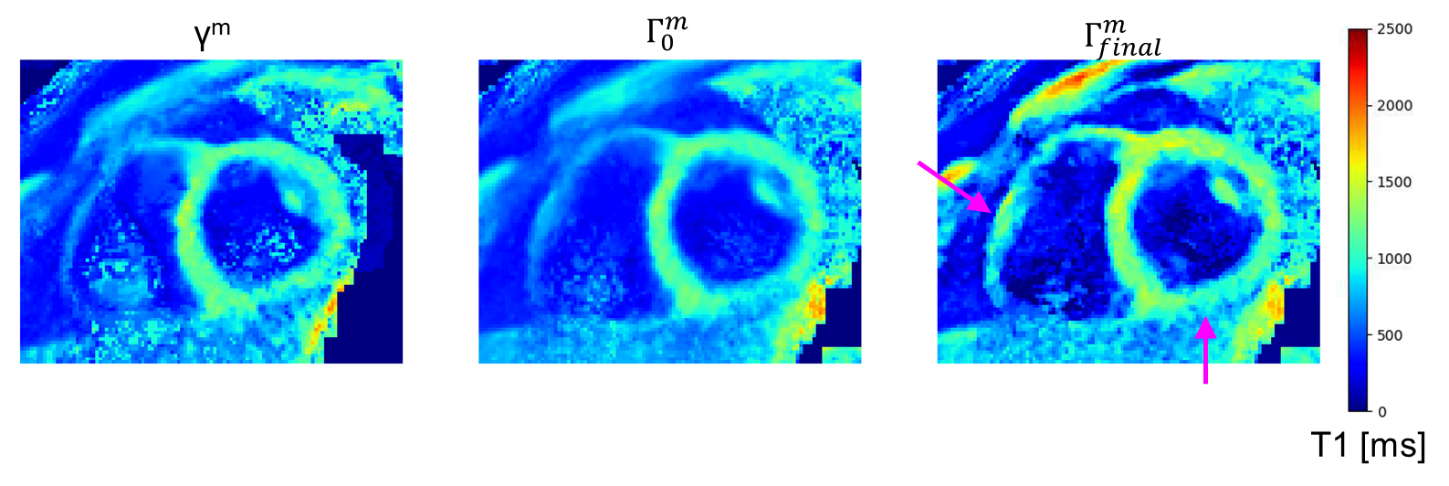
Figure 4: Comparison of the acquired low-res. slice γm, the initialization of the SRR Γm0 and its output Γmfinal. SRR improves the visualization of small structures, such as the right ventricle or the inferior wall of the left ventricle (arrows). Due to the slice-selective inversion pulse, blood appears with a low T1 value.
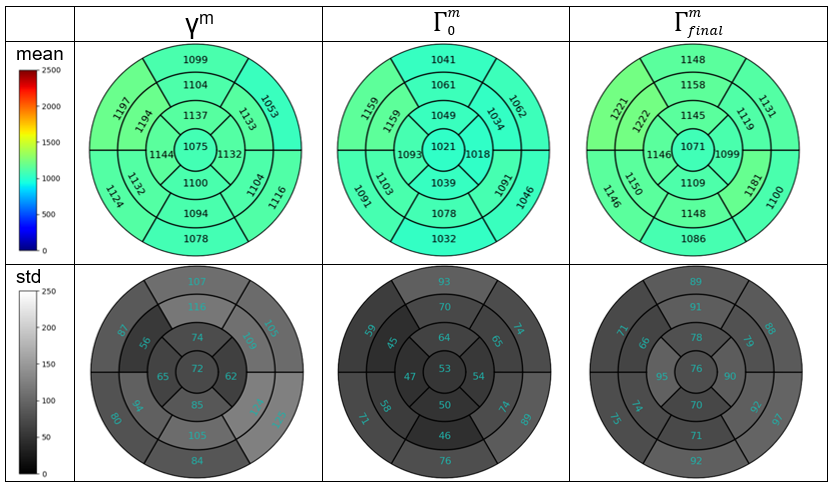
Figure 5: Bull’s eye plot[13] of the average T1 values in ms in standardized segments of the left ventricle and their standard deviation, averaged over three healthy volunteers. The comparison between the low-resolution slice γm, the SRR initialization Γm 0 and its output Γmfinal shows that SRR does not affect the precision of the T1 values.