1112
M-Estimator for Robust Parameter Fitting in Quantitative Cardiac T1 Mapping
Yidong Zhao1, Changchun Yang1, Lu Huang2, Liming Xia2, Sebastian Weingärtner1, and Qian Tao1
1Department of Imaging Physics, Technische Universiteit Delft, Delft, Netherlands, 2Department of Radiology, Tongji Hospital, Tongji Medical College, Huazhong University of Science and Technology, Wuhan, China
1Department of Imaging Physics, Technische Universiteit Delft, Delft, Netherlands, 2Department of Radiology, Tongji Hospital, Tongji Medical College, Huazhong University of Science and Technology, Wuhan, China
Synopsis
Quantitative cardiac T1 mapping involves nonlinear parameter estimation after MR acquisition. The widely used minimum mean square error (MMSE) estimator assumes Gaussian additive noise, and can be sensitive to outliers of non-Gaussian nature, such as those caused by cardiac motion. In this work, we propose to apply robust loss functions, which are part of the M-estimator family, with increased robustness to outliers. Experiments on MOLLI and SAPPHIRE sequences showed that the M-estimators were able to improve the T1 estimation robustness, significantly reducing the standard deviation (SD) error of the estimated T1 map in comparison to MMSE.
Introduction
In cardiac T1 Mapping, the signal intensity is commonly modelled as a non-linear function of inversion time, parameterized by a set of variables. Estimation of these parameters involves a non-linear parametric fitting procedure. The minimum mean square error (MMSE) estimator is most widely used and can be interpreted as a maximum likelihood estimator under the assumption that the additive measurement noise is a zero-mean stationary Gaussian process. However, in the MR T1 mapping data, the noise may not follow a Gaussian model, especially as cardiac motion (or imperfect motion correction) can give rise to outliers (i.e. misalignment in structure) for fitting.To achieve a robust T1 estimate with improved robustness, we propose to employ M-estimators1 for non-linear parameter estimation of cardiac T1 mapping. The loss function of an M-estimator is designed in a way that outliers will have a reduced impact on the final estimate. In this work, we evaluate three M-estimator variants on two types of MR T1 mapping sequences: Modified Look-Locker Inversion Recovery (MOLLI) 2 and Saturation Pulse Prepared Heart rate independent Inversion-Recovery (SAPPHIRE) sequence 3.
Methods
An M-estimator replaces the $$$l_2$$$-norm in MMSE with a robust loss function $$$\rho$$$:$$\theta^*= \text{argmin}_\theta\ \sum_k \rho \left ( \vert y_k - f_\theta (t_k) \vert ^ 2\right ) = \text{argmin}_\theta\ \sum_k \rho(r_k^2) $$
where $$$y_k$$$ is the measurement at $$$t_k$$$, $$$f$$$ is the nonlinear signal intensity model parameterized by $$$\theta$$$, and $$$r_k$$$ denotes the $$$k$$$-th fitting residual. We evaluated three M-estimator variants, namely the Huber, Cauchy and Welsch losses:
$$\rho_{Huber}(r_k^2) = r_k^2 \cdot \mathbb{I}(\vert r_k \vert<S) + (2S \cdot \vert r_k \vert - S^2 ) \cdot \mathbb{I}(\vert r_k \vert \geq S)$$
$$\rho_{Cauchy} (r_k^2) = S^2 \cdot ln(1 + r_k^2/S^2) $$
$$\rho_{Welsch} (r_k^2) = S^2 \cdot (1 - exp(-r_k^2/S^2) ) $$
where $$$\mathbb{I}(\cdot)$$$ is the indicator function, and $$$S$$$ is a user-defined parameter to adjust the tolerance to the residual error. In this work, we set $$$S$$$ adaptively: $$$ S = r_{mid}\cdot \mathbb{I}(r_{mid} < r_{th}) + S_{min} \cdot (r_{mid} \geq r_{th}) $$$, where $$$r_{mid}$$$ is the absolute MMSE residual error median. The error median $$$r_{mid}$$$ reflects the inlier residual distribution if a moderate number of outliers are present. However, a high proportion of outliers may cause severe failure of MMSE, and consequently an elevated $$$r_{mid}$$$ much higher than a predefined threshold $$$r_{th}$$$. In such cases, we set $$$S$$$ as a limited value $$$S_{min}$$$ to curb the estimator's tolerance to residual errors. The Huber loss is a combination of $$$l_1$$$- and $$$l_2$$$- norm losses and suppresses the influence of outliers if $$$r_k$$$ is large. In contrast, the other two loss functions, the redescending functions, ignore outliers completely as the residual error approaches infinity. The Welsch loss tends to ignore more outliers than the Cauchy loss at a fixed $$$S$$$.
In our experiments, we solved the optimization problem with the non-derivative-based simplex-search solver, with the initial value set as the MMSE estimate. The MMSE and M-estimator variants were evaluated on 50 MOLLI scans (3.0T Ingenia, Philips Healthcare, Best, The Netherlands), in total 131 short-axis slices, with or without motion correction (MOCO) 4, and on 12 SAPPHIRE scans (3.0T Siemens Magnetom Prisma, Siemens Healthineers, Erlangen, Germany) without MOCO, in total 119 short-axis slices. The SD error map was estimated for each T1 map using the definition in 5. The myocardium regions were manually delineated as the region of interest (ROI).
Results and Discussions
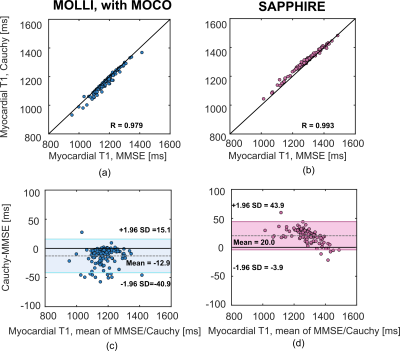
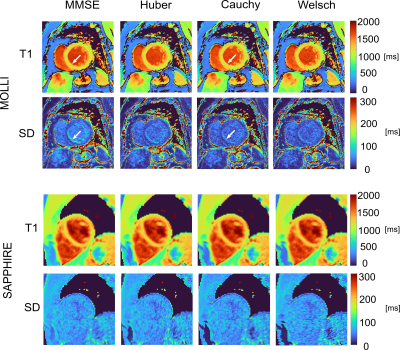
Figure 1-a) illustrates an example of parametric fitting with motion-induced outliers, where the Cauchy M estimator yields a robust fitting to the majority of measurements. The statistics of the mean SD error in the myocardium ROI are shown in Figure 1-b) and 1-c), respectively. For the MOLLI scans without MOCO, all three M-estimator variants reduced the mean myocardial SD error significantly. The largest reduction is observed for the redescending variants, the Cauchy and Welsch losses, from 49.3 ± 16.6 ms (MMSE) to 41.6±16.6 ms (Cauchy), p < 0.001 by paired T-test. On the SAPPHIRE scans, the mean myocardial SD decreased slightly from 72.6±8.3 ms to 70±6.5 ms with the Cauchy loss, with p=0.02. In comparison to the MMSE estimator, the Cauchy estimator had a bias of -12.9 ± 14.3 ms on motion-corrected MOLLI scans and 20 ± 12.2 ms on SAPPHIRE scans, in terms of the estimated myocardial T1 values. Figure 3 shows the estimated T1 and SD maps of an exemplar MOLLI and SAPPHIRE acquisition, both without MOCO. From the MOLLI images, it can be observed that the sharpness of the myocardial border (lower septum) slightly improved when using the M-estimators, with reduced SD error in the same region. However, the Welsch variant can potentially introduce noise susceptible voxels in the estimated T1 map, as the fit may become instable if too many measurement points are discounted.Conclusion
Nonlinear parameter estimation in quantitative cardiac T1 mapping can be realized by the M-estimators, which are more robust to non-Gaussian noises and motion-induced outliers than the conventional MMSE. Our study showed that M-estimators were able to significantly reduce the SD error in T1 map estimation for both MOLLI and SAPPHIRE sequences, in comparison to the MMSE estimator. The Cauchy variant outperformed other variants in terms of SD error reduction and solution stability.Acknowledgements
No acknowledgement found.References
- De Menezes, D. Q. F., et al. "A review on robust M-estimators for regression analysis." Computers & Chemical Engineering (2021): 107254.
- Messroghli, D.R., et al. "Modified Look‐Locker inversion recovery (MOLLI) for high‐resolution T1 mapping of the heart." Magnetic Resonance in Medicine: An Official Journal of the International Society for Magnetic Resonance in Medicine 52.1 (2004): 141-146.
- Weingärtner, S., et al. "Combined saturation/inversion recovery sequences for improved evaluation of scar and diffuse fibrosis in patients with arrhythmia or heart rate variability." Magnetic resonance in medicine 71.3 (2014): 1024-1034.
- Tao, Q., et al. "Robust motion correction for myocardial T1 and extracellular volume mapping by principle component analysis‐based groupwise image registration." Journal of Magnetic Resonance Imaging 47.5 (2018): 1397-1405.
- Kellman, P. et al. "T1
and extracellular volume mapping in the heart: estimation of error maps and the
influence of noise on precision." Journal of Cardiovascular Magnetic
Resonance 15.1 (2013): 1-12.
Figures

Figure 1. (a) A robust fitting example with outliers
induced by motion; (b) Mean SD error within the myocardium region of all MOLLI
scans (N=131); (c) Mean SD error within the myocardium region of all SAPPHIRE
scans (N=119).

Figure 2. The
correlation and Bland-Altman plots of estimated myocardial T1 medians using
MMSE and Cauchy on MOLLI (left) and SAPPHIRE (right) scans.

Figure 3. Two examples of the estimated T1 map and SD error map from MOLLI and
SAPPHIRE, respectively. White arrow in the upper panel indicates region of
improvement in fitting.
DOI: https://doi.org/10.58530/2022/1112