1110
Automated black-blood late gadolinium enhancement cardiac imaging through explainable user-independent inversion time selection
Aurelien Maillot1, Soumaya Sridi2, Xavier Pineau2, Amandine André-Billeau2, Stéphanie Hosteins2, Marta Nuñez-Garcia1, Maxime Sermesant1,3, Hubert Cochet1,2, Matthias Stuber1,4,5, and Aurelien Bustin1,2,4
1IHU LIRYC, Electrophysiology and Heart Modeling Institute, Université de Bordeaux – INSERM U1045, Bordeaux, France, 2Department of Cardiovascular Imaging, Hôpital Cardiologique du Haut-Lévêque, CHU de Bordeaux, Bordeaux, France, 3INRIA, Université Côte d’Azur, Sophia Antipolis, France, 4Department of Diagnostic and Interventional Radiology, Lausanne University Hospital and University of Lausanne, Lausanne, Switzerland, 5CIBM Center for Biomedical Imaging, Lausanne, Switzerland
1IHU LIRYC, Electrophysiology and Heart Modeling Institute, Université de Bordeaux – INSERM U1045, Bordeaux, France, 2Department of Cardiovascular Imaging, Hôpital Cardiologique du Haut-Lévêque, CHU de Bordeaux, Bordeaux, France, 3INRIA, Université Côte d’Azur, Sophia Antipolis, France, 4Department of Diagnostic and Interventional Radiology, Lausanne University Hospital and University of Lausanne, Lausanne, Switzerland, 5CIBM Center for Biomedical Imaging, Lausanne, Switzerland
Synopsis
Black-blood late gadolinium enhancement (LGE) imaging techniques have been introduced to improve the poor scar to blood contrast of bright-blood LGE, especially for subendocardial myocardial infarction. These techniques heavily rely on the manual selection of the optimal inversion time (TI) for blood nulling which makes them operator-dependent, reduce their reproducibility and decrease clinical workflow efficiency. In this work, we investigate whether an explainable image processing technique can be employed for automated TI selection to enable fully automated black-blood LGE.
Introduction
Black-blood late gadolinium enhancement (BL-LGE) imaging techniques have been introduced to improve the poor scar to blood contrast of bright-blood LGE (BR-LGE), especially for subendocardial myocardial infarction1 and are now increasingly being used in clinical practice thanks to their unique scar visualization capabilities. As for BR-LGE, an inversion-time (TI) scout is performed prior to the BL-LGE acquisition to identify the optimal inversion time that leads to the best image contrast. This manual process increases the complexity of the BL-LGE acquisition while adding to the workload of the MR operator. Moreover, like with any manual process, TI selection can be prone to both inter- and intra-observer variabilities. Automation of optimal TI selection could therefore be beneficial in standardizing the LGE workflow, increasing the exam reproducibility while reducing MR operator workload. In this work, we investigate whether an explainable image processing technique can be employed for automated TI selection to enable fully automated black-blood LGE.Methods
Acquisition: 120 patients (85 male, age 17-83yo) with known or suspected ischemic heart disease underwent CMR at 1.5T (Siemens MAGNETOM Aera, Erlangen, Germany). An ECG-triggered single-shot 2D bSSFP BL-LGE TI-scout sequence was performed prior to a 2-min free-breathing motion-compensated T1rho-prepared BL-LGE2. The TI scout acquired 11 single-shot short-axis (SAX) images during free-breathing with TIs ranging from 60 to 160 ms with a 10 ms increment. Manual TI selection was performed twice by two experienced MR technicians for the 120 patients. 40 scouts were used for parameters optimization and 80 for validation.Automated TI selection algorithm: the proposed algorithm purposely mimics the manual selection process which consists in selecting, from the series of SAX images, the image with the lowest signal intensity within the ventricular blood pool and the healthy myocardium. It operates on the TI scout images in two distinct steps: 1) Extraction of a Region of Interest (ROI), containing relevant information about the ventricular blood pool and myocardium. 2) Selection of the image with the highest number of low intensity pixels within this ROI. The corresponding TI is then used for the subsequent BL-LGE acquisition. ROI extraction is performed in two steps: A) Coarse detection of the heart within the image and B) Selection of a ROI within the heart. Acquisition of BL-LGE scout requires the positioning of a bi-dimensional rectangular shim-box in the image plane, aligned with the field-of-view and centered on the heart. This prior information was exploited to easily obtain the coarse detection of the heart in the scout images. Optimization of the shape and dimension of the ROI within the heart is detailed in the subsection below. Intensity histograms are calculated for each segmented scout image within the ROI. Histograms peaks are then detected and the global maximum is selected as the common threshold value. The images with the highest number of sub-threshold pixels are defined as the images with the best signal nulling and their associated TI are selected as optimal TIs. The overall process is depicted in Figure 1 for a given TI scout.
Optimization: The shape and dimensions of the ROI were optimized on 40 patients based on one expert manual selection. Rectangular and circular shapes were considered with 31 dimensions ranging from the size of the shim-box to one fourth of its size. The best parameters were used for the validation (80 patients) where the proposed algorithm was compared to inter- and intra-observer variability.
Results
Optimization: rectangular ROI of size FOVshim / 2.5 and circular ROI of size FOVshim / 2.2 led to the minimum absolute mean TI difference with manual expert TI selection: 2.25 ± 4.18 ms (Figure 2). With rectangular ROIs of size FOVshim / 2.5 the automated algorithm selected the same TI as the expert in 31 scouts (77.5%) and a TI at ± 10 ms (corresponding to one image difference) in 9 scouts (22.5%). One image difference was the highest difference observed in the optimization between the automated algorithm and the expert. Therefore, rectangular ROIs of size FOVshim / 2.5 were used for the validation.Validation: the mean absolute difference for inter-observer, intra-observer and automated-manual variability were 3.44 ± 4.94 ms, 2.69 ± 4.43 ms and 2.47 ± 4.38 ms, respectively (Figure 3.B Left). The difference between the proposed automated algorithm and any expert was therefore lower than the difference between the two experts or between one expert performing the selection twice. The same TI was selected in 75.62% of the scouts when comparing the automated algorithm to an expert, in 73.13% of the scout between two selections of the same expert and in 66.56% of the case between the two experts (Figure 3.B Right). A good agreement was found between all TI selections, with the highest TI difference at ± 30 ms (3 images) in only one scout and at ± 20 ms in two scouts. After visual inspections, these cases depicted no clear consensus. Comparison between BL-LGE images with TIs matching the automated algorithm selection and BR-LGE is visible in Figure 4.
Conclusion
The proposed automated TI selection, thanks to its good performance and simplicity of implementation, can be a great candidate for automated BL-LGE in clinical practice. Inline scanner implementation is now warranted.Acknowledgements
This research was supported by funding from the French National Research Agency under grant agreements Equipex MUSIC ANR-11-EQPX-0030 and Programme d’Investissements d’Avenir ANR-10-IAHU04-LIRYC, and from the European Council under grant agreement ERC n715093. AB acknowledges a Lefoulon-Delalande Foundation fellowship administered by the Institute of France.References
1. Holtackers RJ, Van De Heyning CM, Chiribiri A, Wildberger JE, Botnar RM, Kooi ME. Dark-blood late gadolinium enhancement cardiovascular magnetic resonance for improved detection of subendocardial scar: a review of current techniques. J. Cardiovasc. Magn. Reson. 2021;23:1–18 doi: 10.1186/s12968-021-00777-6.2. Bustin et al. Black-Blood late gadolinium enhancement with T1 rho magnetization preparation for the assessment of myocardial viability, Proceedings from the 24th Annual SCMR Virtual Scientific Sessions, 2021.
Figures
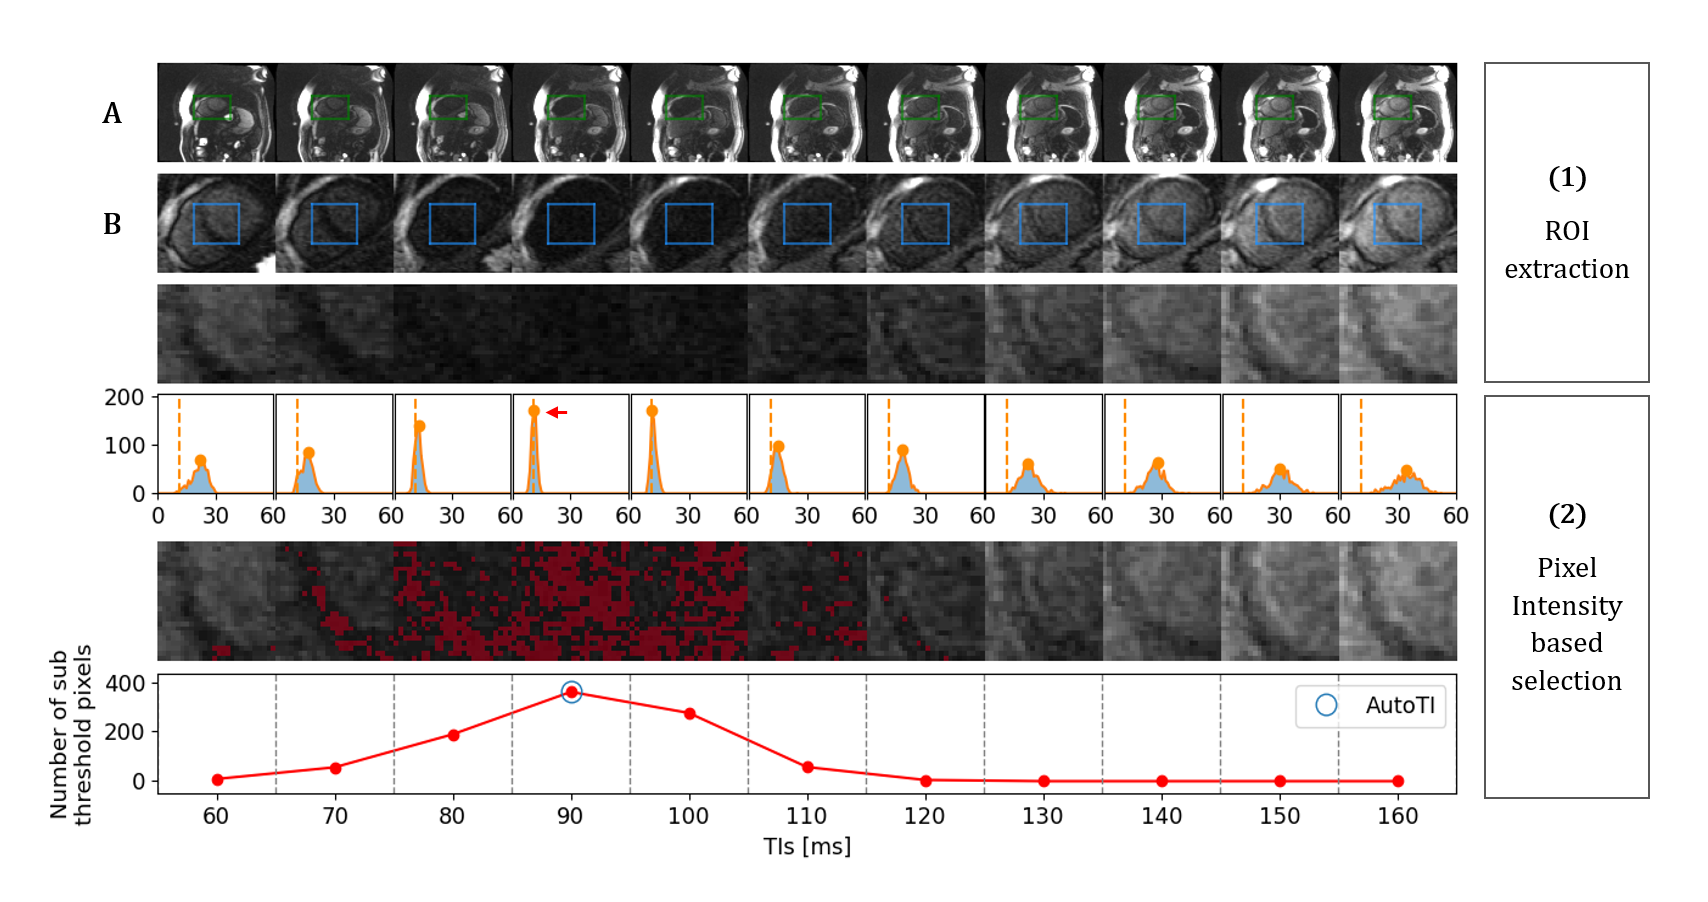
Figure 1. Automated TI selection process. (1) ROI extraction in two
steps: A) coarse
detection of the heart within the image using the in-plane 2D shim box (green)
and B) selection of an optimized rectangular ROI of size FOVshim / 2.5 (blue). (2) Pixel Intensity based selection: the
global maximum of the histograms over all ROI images (red arrow) is selected for
thresholding (dashed orange line), sub-threshold pixels are displayed in red
and the TI corresponding to the image with the highest number of sub-threshold
pixels is selected (blue circle).
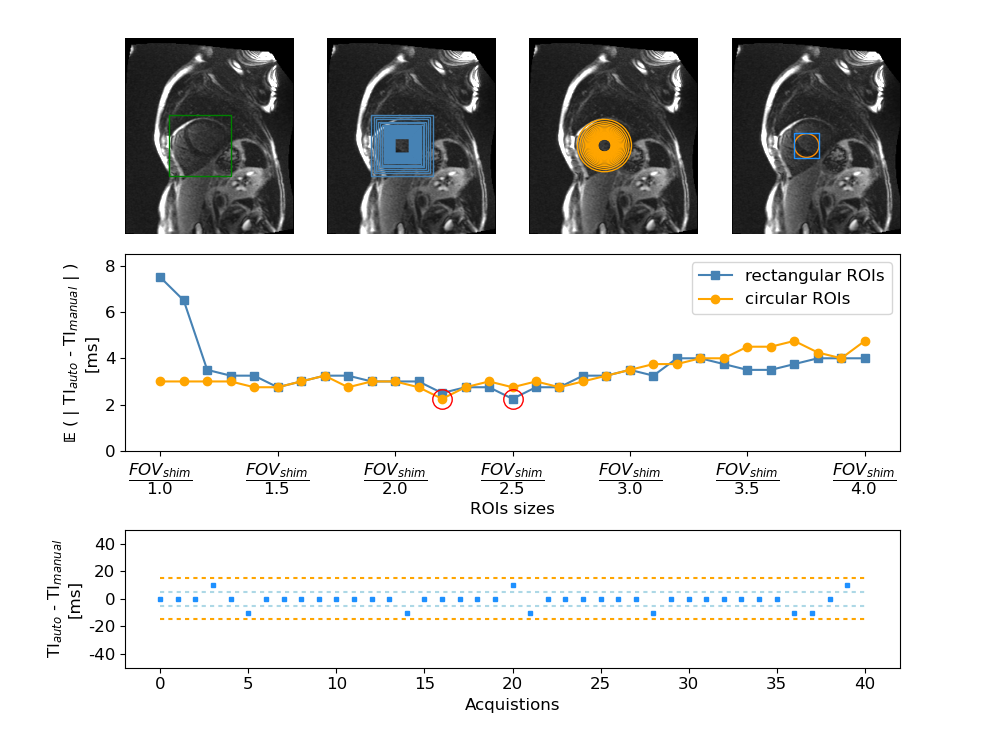
Figure
2. ROI parameters optimization on 40
patients. A: shim box (green), B: all rectangular ROIs (blue) C: all circular
ROIs (orange). D: ROIs leading to the lowest mean absolute difference
(MD) with respect to the manual selection for the two shapes. Middle row:
MD between automated and manual TI selection over 40 subjects for all ROIs size
(lowest MD are highlighted by red circles). Bottom row: Difference in ms
between the automated TI with the best rectangular ROI (size of FOVshim /
2.5) and the manual TI for the 40 different scouts.
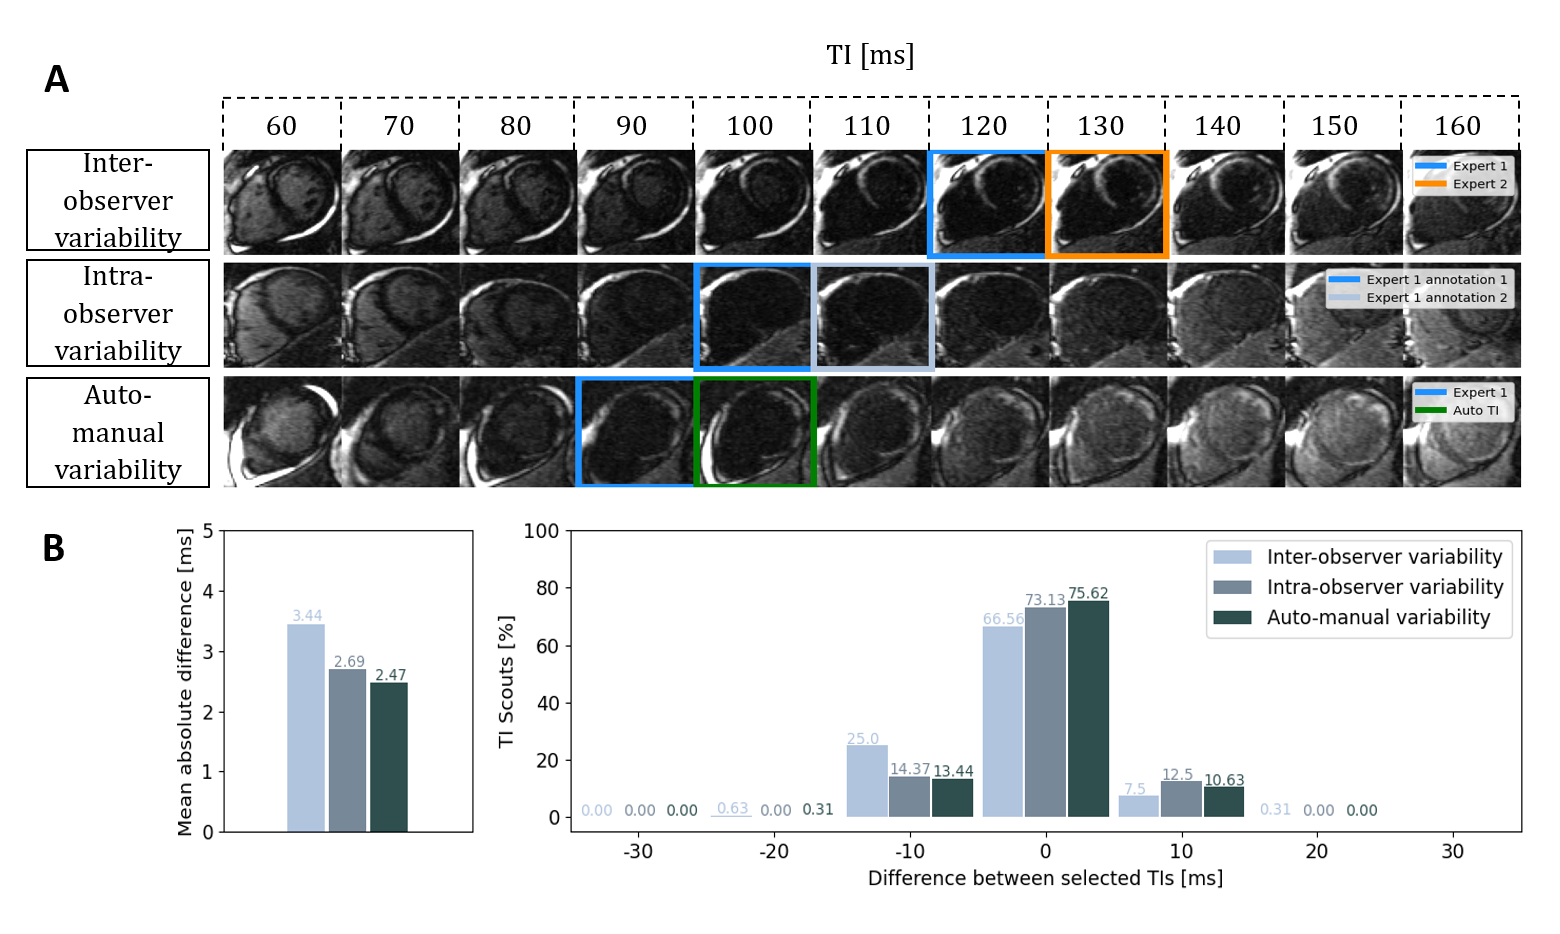
Figure 3. Validation
of the automated TI selection algorithm against inter- and intra-observer
variability on 80 scouts using a rectangular ROI of size FOVshim / 2.5 . A) Examples of inter-observer, intra-observer,
and auto-manual variability in TI selection. B) Left: Mean absolute differences in ms. Right: Percentage of matched scouts.
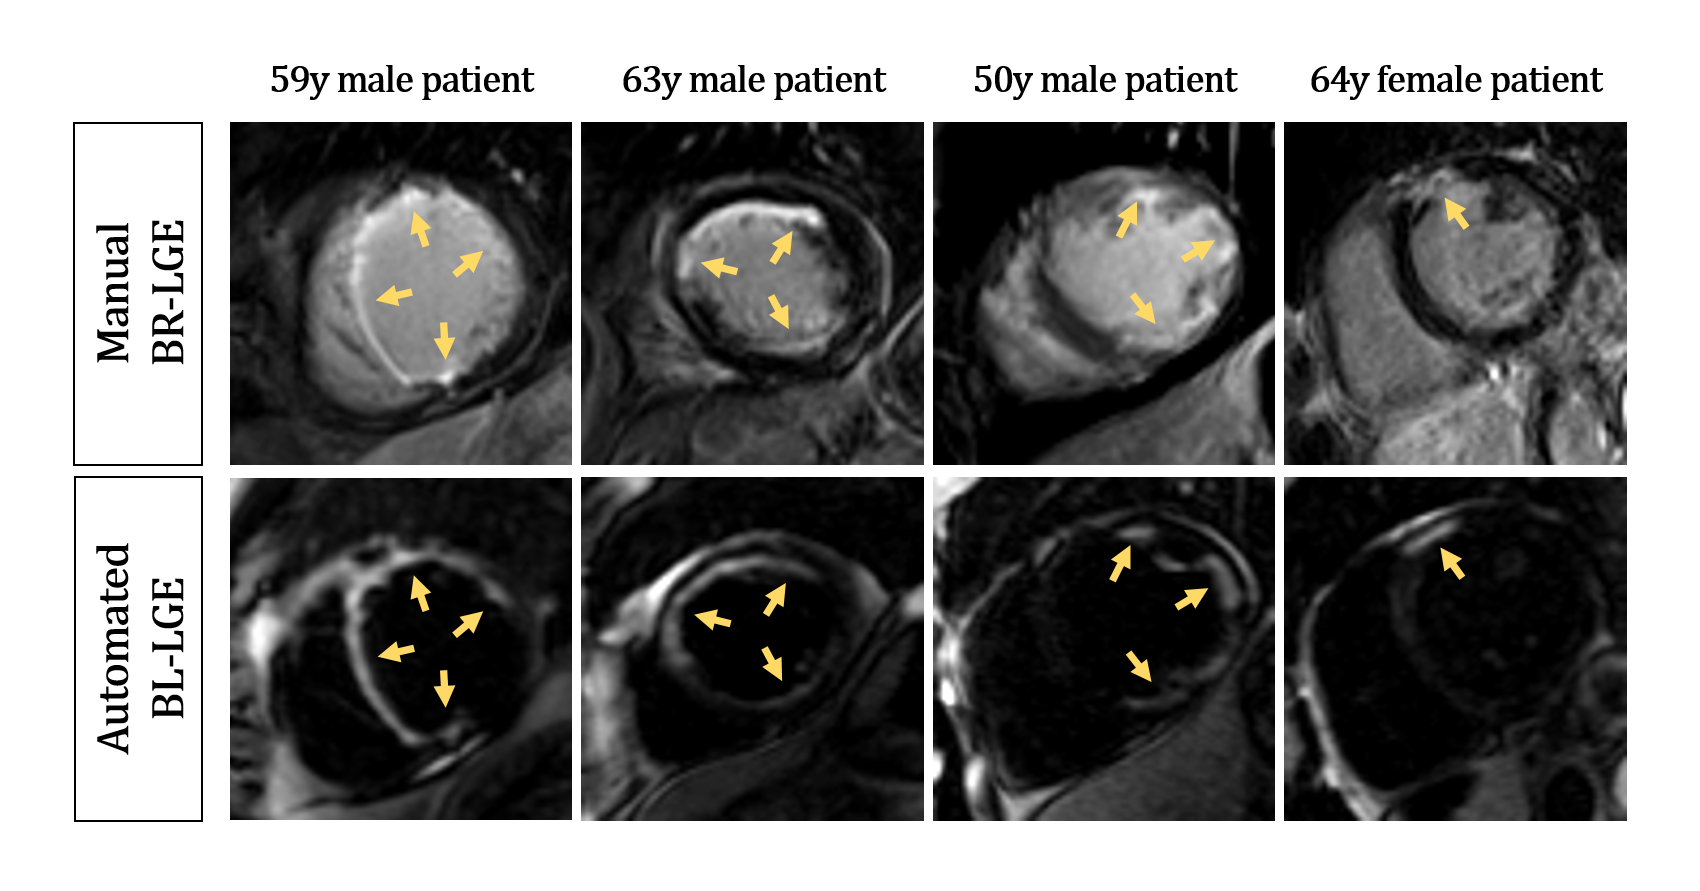
Figure 4. Comparison between conventional bright-blood LGE and black-blood LGE
images for four different patients. Black-blood LGE images were acquired with
TIs corresponding to the TIs selected by the proposed automated algorithm.
Yellow arrows indicate areas with LGE. Abbreviations: LGE = late gadolinium
enhancement; BR-LGE = bright-blood LGE; BL-LGE = black-blood LGE.
DOI: https://doi.org/10.58530/2022/1110