1109
3D whole-heart free-breathing T1⍴ quantification: a preliminary clinical evaluation.1School of Biomedical Engineering and Imaging Sciences, King's College London, London, United Kingdom
Synopsis
T1⍴-CMR allows the detection of scarred myocardial tissue without the need of an exogenous contrast. However, the generation of a single-slice T1ρ map requires sequential acquisitions under several breath-holds to acquire the T1⍴-weighted images at different spin-lock times, leading to long, inefficient scan times. We recently proposed a free-breathing motion-compensated 3D whole heart T1ρ mapping technique with near-isotropic spatial resolution (1.7×1.7×2 mm3) and predictable and clinically feasible scan In this work time (~8min). Here, we extend this technique to incorporate non-rigid motion corrected reconstruction and validate the proposed technique on subjects with suspected myocardial infarction.
Introduction
Myocardial tissue characterization has been shown to be of great interest to detect several cardiovascular diseases. In the case of myocardial infarction and other ischemic cardiomyopathies, scar detection is needed to evaluate post-infarction left ventricular remodelling. The use of an exogenous contrast agent in Late Gadolinium Enhancement (LGE) MR scans is well validated and clinically accepted for the evaluation of focal myocardial scar1. However, it is contraindicated in patients with severe renal dysfunction2,3, and anaphylactic reactions, although rare, may occur and are potentially life threatening4. To solve these problems, endogenous contrast imaging techniques, such as T1⍴-CMR5-7 have been proposed. However, the generation of a single-slice T1ρ map requires sequential acquisitions under several breath-holds to acquire the T1⍴ weighted images at different spin-lock times (SLT), leading to long, inefficient scans. To overcome these limitations, we recently proposed a free-breathing motion-compensated 3D whole-heart T1ρ mapping technique8 with near-isotropic spatial resolution (1.7×1.7×2 mm3) and predictable and clinically feasible scan time (~8min) and tested it phantoms and healthy volunteers. In this work, we now extend this technique to incorporate non-rigid motion corrected reconstruction and validate the proposed technique on subjects with suspected myocardial infarction.Methods
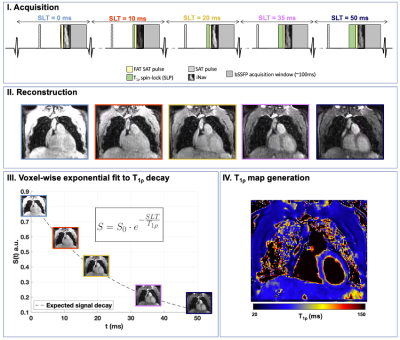
The proposed 3D-T1ρ mapping sequence (Fig.1) consists of five sequential ECG-triggered 3D volumes acquired with a balanced Steady-State Free-Precession (bSSFP) readout with variable-density Cartesian sampling with spiral-like profile order (VD-CASPR) at an undersampling factor of 3.8. Five different spin-lock pulses were employed in this sequence, at a fixed spin-lock amplitude (SLA=400Hz) and increasing spin-lock times (SLT={0,10,20,35,50} ms). The pulse preparation at each cardiac cycle also included a non-selective saturation pulse (SAT), and fat suppression using spectral pre-saturation with inversion recovery (FAT-SAT) and a 2D image-based navigator (iNAV). Nonrigid motion correction was applied to each volume with multi-contrast patch-based higher-order low-rank reconstruction (HD-PROST9). Subsequently, the different T1⍴-weighted contrasts were fitted to an exponential model8 to obtain a voxel-wise T1⍴ map of the whole volume. Eight patients (n=8) with suspected cardiovascular disease were scanned on a 1.5T scanner (MAGNETOM Aera, Siemens Healthcare, Erlangen Germany). Acquisition parameters included FA=50˚, 1.7×1.7×2 mm3 resolution, 35 readouts per cardiac cycle, acquisition window of ~120ms, TR/TE=3.6/1.2ms and total scan time=~8min. Multi-slice ECG-gated LGE images were acquired at the apical, mid-cavity and basal levels for comparison and as part of the clinical routine. For image analysis, LV myocardial tissue Regions of Interest (ROIs) were manually drawn for every slice using one of the T1⍴ contrast images. Myocardial ROIs were subdivided into epicardial and endocardial when needed and high-resolution T1⍴ 16-segment AHA bullseye plots10 were generated from the segmentations.Results
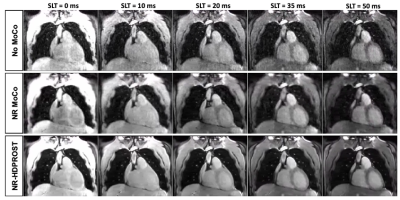
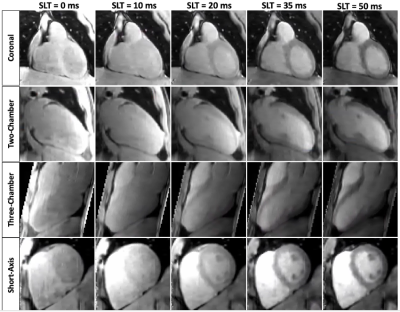
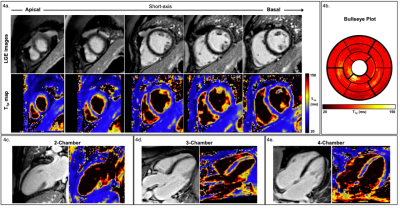
A coronal slice of the five T1⍴-weighted images is shown in Fig.2 for a representative patient. Reconstructed images generated after Non-Rigid motion-correction (NR-Moco)+patch-based regularization (NR-HDPROST) are shown to have higher Signal-to-Noise Ratio and less motion-derived blur. Since a 3D volume covering the whole heart is obtained, the reconstructed volumes can be transformed into different standardized orientations, as shown in Fig.3 for the same representative patient. Fig.4a shows a multi-slice SA comparison of the T1⍴ maps obtained from the proposed 3D whole-heart T1⍴ sequence of another representative patient. Fig.4b. shows a high-resolution bullseye plot representation of the T1⍴ map. Results shown are compatible with the diagnosis of an LGE-negative (patient without presence of myocardial scar). A small region of elevated T1⍴ values can be observed on the apical region of the right coronary artery (RCA) territory. This mild overestimation, not observed in the reference LGE maps, can be explained by myocardial motion artifacts in the most apical slices. Additional slices at different orientations (two-chamber; Fig.4c., three-chamber; Fig.4d. and four-chamber; Fig.4e) show reasonably good matching between the T1⍴-map and the LGE reference except for this small apical region. In addition, 3D T1ρ proved to be diagnostic in subendocardial enhancement, where clinically dark-blood LGE is required in addition to conventional bright-blood LGE imaging to establish the diagnosis. A representative subject, who presented with subendocardial LGE enhancement in the basal to mid inferoseptal wall, basal to mid inferolateral and septal wall is shown in Fig.5. Fig.5b. shows the corresponding high-resolution bullseye plot of the obtained 3D-T1⍴ map (Fig.5b., top row). The 3D segmentation can be further divided to obtain dedicated endocardial and epicardial bullseye plots (Fig 5b. bottom row, left and right respectively). To do so, the ROIs drawn for each slice are split in the radial direction in two parts before generating the different slices of the bullseye plots. A representation like this is particularly helpful to detect scarred tissue in a subendocardial location, where the WB-LGE scan (the standard in the clinical routine) fails to clearly show the lesion (Fig.5a, top row, green arrows). However, the dedicated T1⍴ bullseye plots (Fig.5a, bottom row and Fig.5b) addresses this problem, showing a clear T1⍴ elevation.Discussion and Results
The feasibility of the proposed free-breathing whole heart 3D-T1⍴ sequence has been demonstrated in a small cohort of patients with cardiovascular disease. This ~8min sequence has shown potential to detect focal lesions that match those of LGE reference images, and shows potential to identify scarred lesions in the myocardial region. Further investigations are warranted in a larger cohort of patients to investigate its clinical value.Acknowledgements
This work was supported by the following grants: EPSRC 1) EP/P032311/1; 2) EP/P007619/1; 3) EP/P001009/1; 4) EP/V044087/1; the Wellcome/EPSRC Centre for Medical Engineering (WT 203148/Z/16/Z), and Fondecyt 1210637. This research was supported by the Department of Health through the National Institute for Health Research (NIHR) comprehensive Biomedical Research Centre award to Guy’s & St Thomas’ NHS Foundation Trust in partnership with King’s College London and King’s College Hospital NHS Foundation Trust and by the NIHR MedTech Co-operative for Cardiovascular Disease at Guy’s and St Thomas’ NHS Foundation Trust.References
1. Kim RJ, Chen E-L, Lima JAC et al. Myocardial Gd-DTPA Kinetics Determine MRI Contrast Enhancement and Reflect the Extent and Severity of Myocardial Injury After Acute Reperfused Infarction. Circulation. 1996;94(12):3318-3326.
2. Zou Z, Zhang HL, Roditi GH, et al.. Nephrogenic Systemic Fibrosis: Review of 370 Biopsy-Confirmed Cases. JACC: Cardiovascular Imaging. 2011;4(11):1206-1216.
3. Ledneva E, Karie S, Launay-Vacher V et al. Renal Safety of Gadolinium-based Contrast Media in Patients with Chronic Renal Insufficiency. Radiology. 2009;250(3):618-628.
4. Bellin M-F, Van Der Molen AJ. Extracellular gadolinium-based contrast media: An overview. European Journal of Radiology. 2008;66(2):160-167.
5. Witschey WR, Zsido GA, Koomalsingh K, et al. In vivo chronic myocardial infarction characterization by spin locked cardiovascular magnetic resonance. Journal of Cardiovascular Magnetic Resonance. 2012;14(1):37.
6. van Oorschot JWM, el Aidi H, Jansen of Lorkeers SJ, et al. Endogenous assessment of chronic myocardial infarction with T(1ρ)-mapping in patients. Journal of cardiovascular magnetic resonance : official journal of the Society for Cardiovascular Magnetic Resonance. 2014;16:104.
7. Han Y, Liimatainen T, Gorman RC et al. Assessing Myocardial Disease Using T1ρ MRI. Current Cardiovascular Imaging Reports. 2014;7(2):9248.
8. Qi H, Bustin A, Kuestner T, et al. Respiratory motion-compensated high-resolution 3D whole-heart T1ρmapping. Journal of Cardiovascular Magnetic Resonance. 2020;22(1):1-13.
9. Bustin A, Lima da Cruz G, Jaubert O et al. High-dimensionality undersampled patch-based reconstruction (HD-PROST) for accelerated multi-contrast MRI. Magnetic Resonance in Medicine. 2019;81(6):3705-3719.
10. Cerqueira MD, Weissman NJ, Dilsizian V, et al. Standardized Myocardial Segmentation and Nomenclature for Tomographic Imaging of the Heart. Journal of Cardiovascular Magnetic Resonance. 2002;4(2):203-210.
Figures


