1107
Dynamic Pressure-Volume Loop Analysis using Simultaneous Real-Time Cardiac MRI and Left Heart Catheterization1Cardiovascular Branch, National Heart, Lung, and Blood Institute, National Institutes of Health, Bethesda, MD, United States
Synopsis
Pressure-volume (PV) loops can be used to derive the valuable cardiac functional parameters contractility and compliance. Conventional PV loop catheters provide unreliable volume measurements. In this study we develop and validate a method to obtain dynamic PV loops during an MRI-guided preload alteration via inferior vena cava occlusion, using simultaneous measurements of left ventricular pressure from a catheter and volume from real-time long-axis cardiac MRI. Pressure and volume signals were synchronized and used to derive contractility and compliance. Long-axis derived volumes were validated against conventional short-axis images. The method was tested in naïve, ischemic cardiomyopathy, and aortic banding swine models.
Introduction
Left ventricular (LV) contractility and compliance are valuable parameters to evaluate cardiac function and the impact of an intervention. Contractility and compliance can be derived from dynamic recordings of LV pressure-volume (PV) loops during a preload alteration challenge. However, the conductance PV loop catheters used in a traditional catheterization lab require extensive calibration and provide unreliable volume measurements (1,2). We propose a method to quantify contractility and compliance from dynamic PV loops using simultaneous measurements of pressure from an LV catheter and volume from real-time MRI during a preload alteration challenge.Methods
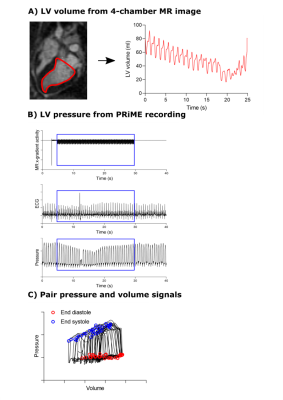
A total of 16 pigs were imaged on a high-performance 0.55T MRI system (prototype MAGNETOM Aera, Siemens Healthcare, Erlangen, Germany) (3). Seven pigs were naïve, three were examined 30 days post induction of ischemic cardiomyopathy (ICM), and six were examined 30 days post transcatheter aortic banding, in an attempt to increase afterload. Dynamic preload alteration was performed within the MRI scanner by an abrupt inferior vena cava (IVC) occlusion via balloon inflation (Figure 1), to derive load independent measures of LV performance. Experiments were approved by the institutional animal care and use committee.Real-time long-axis 4-chamber CMR cine images were acquired at breath-hold with a bSSFP sequence (TE/TR/θ = 1.4ms/77ms/80°, 2.3x2.3x6mm reconstructed resolution, 360x270mm FOV, acceleration rate 3, 76ms temporal resolution, 326 timeframes). Time-resolved 2D LV segmentation was performed semi-automatically on the 4-chamber images, from which a 3D LV volume was derived using center line rotation (SuiteHeart, NeoSoft). End diastole (ED) and end systole (ES) were automatically detected in each heartbeat. Breath-held ECG-gated bSSFP short-axis cine images were acquired in the same animals, and long-axis 3D MRI volumes in the first recorded heartbeat were validated against short-axis stack volumes at ED and ES.
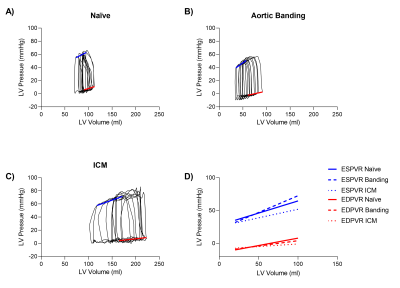
We used a Physiological Recording in MRI Environment (PRiME) system that filters MRI-induced noise (4) was used to record six lead ECG, LV and aortic pressures, and MRI gradient waveforms, with 1kHz sampling frequency. Pressures were measured with a fluid-filled pressure transducer. Images and hemodynamic recordings were acquired simultaneously prior to and during IVC occlusion. Pressure and ECG were temporally aligned with the real-time image acquisition using the recorded MRI gradient waveforms, with ED detected from the ECG R-wave peak and ES from the dicrotic notch in the aortic pressure. PV loops were derived by pairing synchronized pressure and volume curves based on ED and ES detections (Figure 2). Linear ES and ED PV relations (ESPVR, EDPVR) were derived from the first ten PV loops during the preload challenge, which avoided autonomic tone impact on inotropy and loading conditions. Contractility was defined as the ESPVR slope, and compliance was as the inverse of the EDPVR slope.
Results
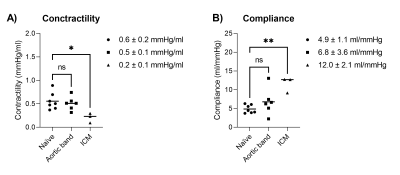
Real time invasive LV pressure and 4-chamber volume acquisition during preload alteration challenge was feasible in the MRI scanner, and PV loops were derived in all experiments. Example PV loops and corresponding ESPVR and EDPVR are shown in Figure 3. Ventricular volumes derived from long-axis imaging agreed well with short axis imaging were (volume difference = 8.2±14.5 ml at ED, and -2.8±6.5 ml at ES).The pressure gradient across the aortic band was 10±6mmHg, which was considered modest and not clinically significant. Correspondingly, there were no differences between the naïve pigs and banded model in contractility and compliance (Figure 4). The ICM animal model developed a dilated ventricle (short-axis EDV 277±36 ml), resulting in an expected lower contractility (0.2±0.1 mmHg/ml vs 0.5±0.1 mmHg/ml) and increased compliance (11.5±2.1 mmHg/ml vs 5.2±1.1 mmHg/ml) compared to naïve animals.
Discussion
This study presents a method to derive dynamic PV loops during a preload alteration challenge by pairing simultaneously measured LV pressures via catheterization, and LV volume via real-time cardiac MRI in the long-axis view. Long-axis derived volumes were validated with short-axis cardiac images. The PV loops were used to derive the cardiac functional parameters contractility and compliance, showing significant differences between naïve and ICM animal models. The aortic banding model did not result in clinically significant afterload alterations, and did therefore not yield difference in contractility and compliance compared to naïve animals.A limitation in study was the use of fluid-filled pressure transducers sensitive to damping, which may impact the pressure signal by an amplified systolic pressure and decreased diastolic pressure. The lower temporal resolution in the MRI measurements compared to pressure measurements also poses a limitation in capturing the ventricular volume during the isovolumic phases.
Conclusion
Dynamic PV loops during a real-time MRI guided preload alteration challenge by IVC occlusion can be used to derive quantitative metrics of LV contractility and compliance.Acknowledgements
We would like to acknowledge the assistance of Siemens Healthcare in the modification of the MRI system for operation at 0.55T under an existing cooperative research agreement (CRADA) between NHLBI and Siemens Healthcare.
This study was supported by the Intramural Research Program, National Heart Lung and Blood Institute, National Institutes of Health, USA (Z01-HL006257, Z01-HL006213, and Z01-HL006039).
References
1. Burkhoff D. The conductance method of left ventricular volume estimation. Methodologic limitations put into perspective. Circulation 1990;81(2):703–6. Doi: 10.1161/01.CIR.81.2.703.
2. Kuehne T., Yilmaz S., Steendijk P., et al. Magnetic Resonance Imaging Analysis of Right Ventricular Pressure-Volume Loops. Circulation 2004;110(14):2010–6. Doi: 10.1161/01.CIR.0000143138.02493.DD.
3. Campbell-Washburn AE., Ramasawmy R., Restivo MC., et al. Opportunities in Interventional and Diagnostic Imaging by Using High-Performance Low-Field-Strength MRI. Radiology 2019;293(2):384–93. Doi: 10.1148/radiol.2019190452.
4. Kakareka JW., Faranesh AZ., Pursley RH., et al. Physiological Recording in the MRI Environment (PRiME): MRI-Compatible Hemodynamic Recording System. IEEE J Transl Eng Heal Med 2018;6:1–12. Doi: 10.1109/JTEHM.2018.2807813.
Figures


