1105
Simultaneous acquisition of GRE- and SE-type resting-state fMRI signals with GRASE-based line-scanning in the human brain1High-Field Magnetic Resonance, Max Planck Institute for Biological Cybernetics, Tuebingen, Germany, 2Graduate Training Centre of Neuroscience, University of Tuebingen, Tuebingen, Germany, 3Athinoula A. Martinos Center for Biomedical Imaging, Department of Radiology, Harvard Medical School, Massachusetts General Hospital, Charlestown, MA, United States, 4Biomedical Magnetic Resonance, University of Tuebingen, Tuebingen, Germany
Synopsis
GRE- or SE-based line-scanning fMRI methods can characterize dynamic fMRI signals with high spatial and temporal resolution. Here, we present a combination of both using a 1D GRASE sequence with perpendicular excitation and refocusing slices. We applied the sequence in-vivo at 3T and analyzed slice pofiles and tSNR.
Introduction
Laminar-specific functional magnetic resonance imaging (fMRI) has been successfully applied to address neuronal activity and functional connectivity (FC) across cortical layers in animal and human fMRI studies. Previously, GRE1,2- or SE-based3 line-scanning fMRI methods were proposed to characterize dynamic fMRI signals and laminar-specific FC with high spatial and temporal resolutions (e.g., 50 µm and 50 ms, respectively). Nevertheless, there is an inevitable tradeoff between T2*-weighted GRE- and T2-weighted SE-based methods: GRE-based line-scanning fMRI methods have low specificity but high sensitivity to BOLD whereas SE-based line-scanning fMRI methods (SELINE3) have low sensitivity but high specificity to BOLD. While GRE-based approaches use saturation pulses to suppress regions outside the line of interest, spin-echo based line-scanning approaches can be used with inner volume acquisition using perpendicular excitation and refocusing slice orientations4. Herein, we developed a GRASE-based line-scanning fMRI method (GSLINE) to specify dynamic neurovascular-coupled hemodynamic responses and fMRI signal evolutions along the echo trains by simultaneously acquiring both GRE- and SE-based fMRI responses with sub-millimeter high spatial resolution (400 µm) in the human brain. We analyzed the slice profiles as well as temporal signal-to-noise-ratio (tSNR) for different sequence settings. Thus, our work demonstrated the feasibility of a new GSLINE method for human fMRI studies by simultaneously acquiring GRE- and SE-type echoes with different echo times along the echo trains with high spatial resolution.Methods
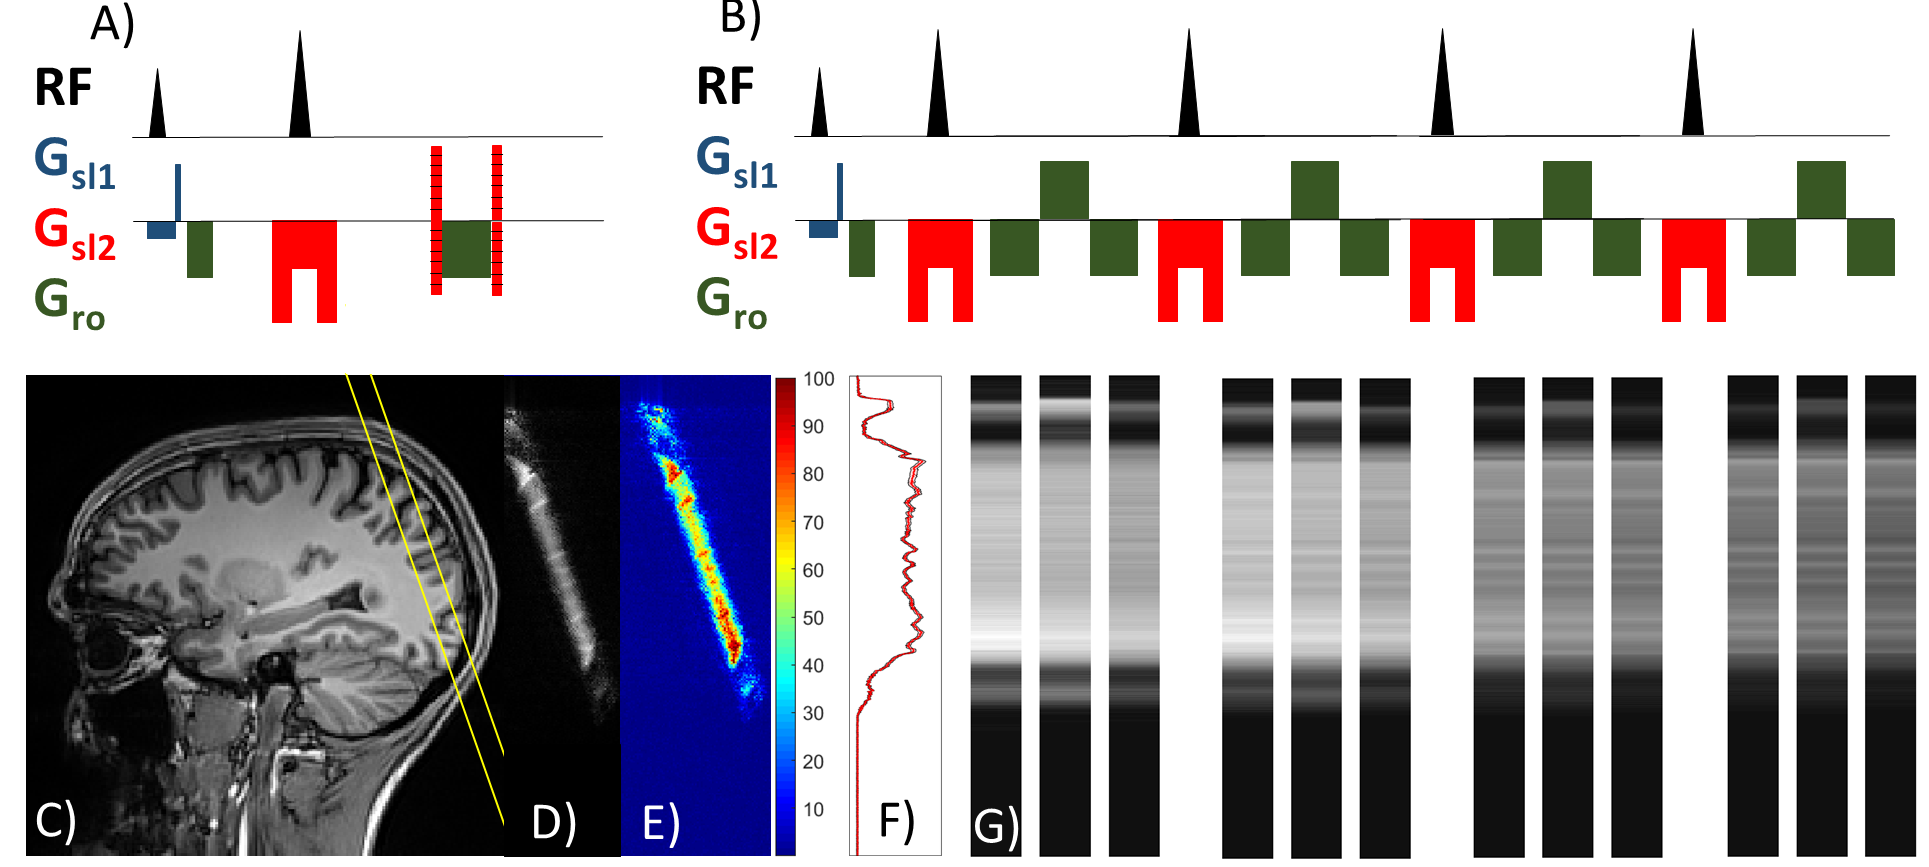
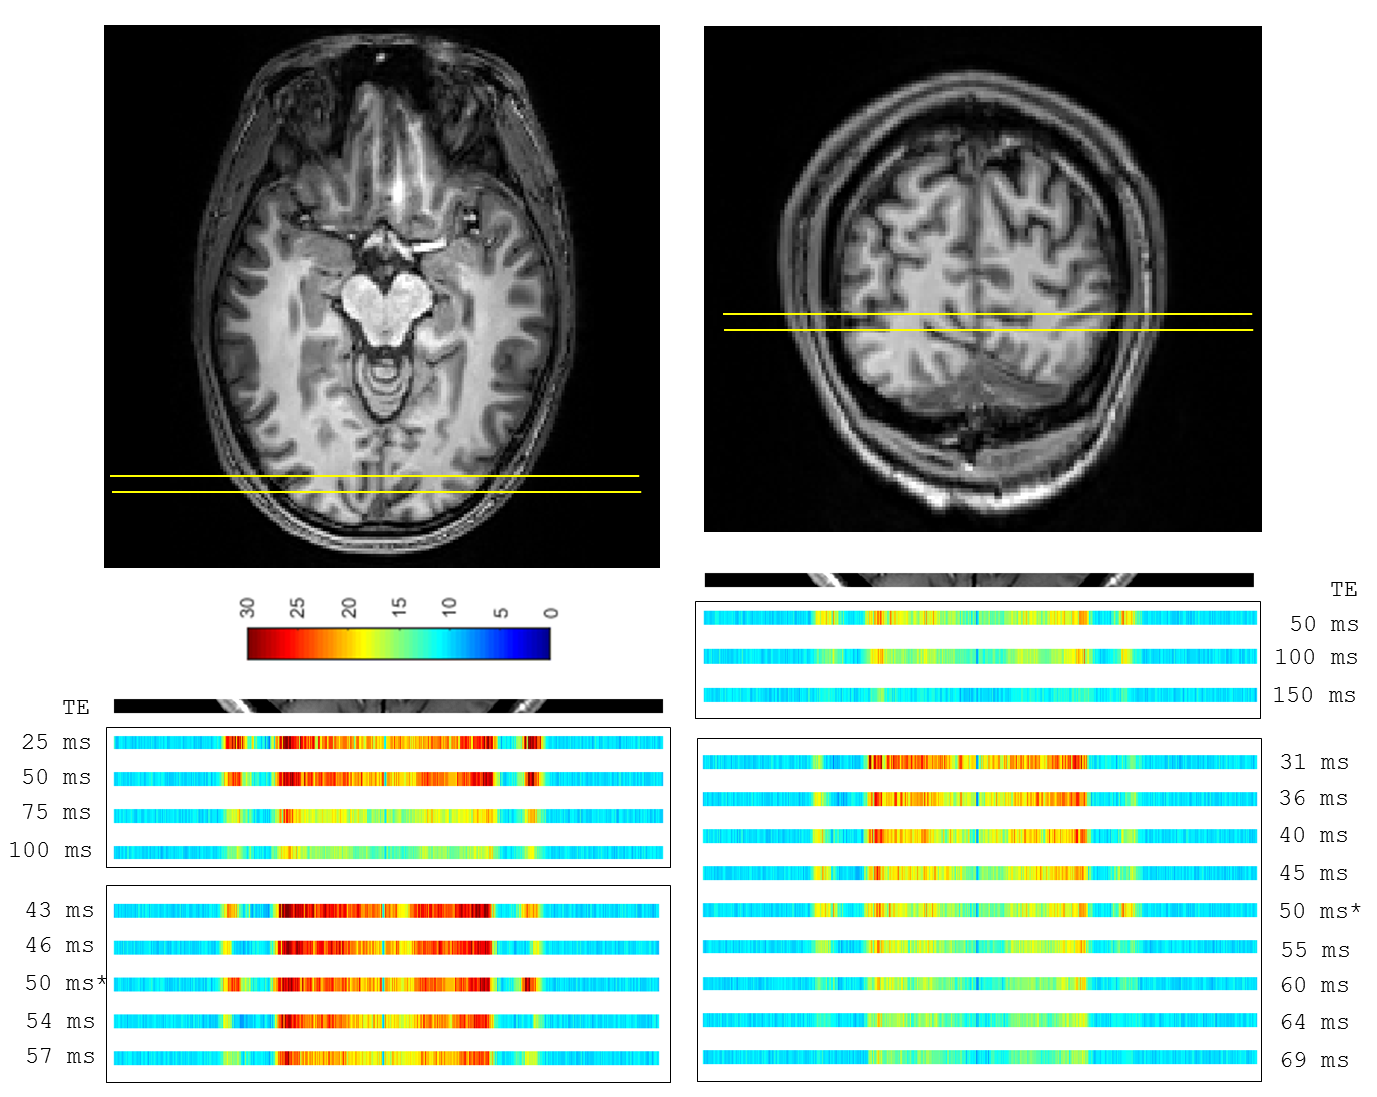
All measurements were performed on a Siemens 3T Prisma. We used the vendor’s 20-channel head coil for phantom and the vendor’s 64-channel head coil for in-vivo measurements. Volunteer measurements were performed after informed consent and under regulations of the local ethics committee. For GRASE-based line-scanning MRI (GSLINE), we implemented an independently positionable slice for the refocusing pulse, enabling perpendicular planes for excitation and refocusing. For analysis of the slice profile, a fully sampled 2D spin-echo sequence including phase encoding was used (TE = 75 ms, TR = 2 s, bandwidth = 200 Hz/px, slice thickness excitation = 5 mm, slice thickness refocusing = 10 mm, Resolution = 256, FOV = 220 mm). In a first step, the slice profile was analyzed with different RF profiles. Next, to explore the slice selection profile in vivo, the 2D SELINE (i.e., turned on phase-encoding gradient) and the 1D GSLINE sequence were applied in a healthy volunteer. The multi-echo 1D CPMG-type GRASE sequence was applied without phase encoding gradients to cover the same line repeatedly with different echo times (echo train length = 4, echo spacing = 25 ms, readout resolution = 512, FOV = 220 x 5 mm2, 150 repetitions). As a last step, we analyzed temporal signal-to-noise-ratio (tSNR) for two different GSLINE sequence settings, again in a healthy volunteer: (I) ETL = 4, echo spacing = 25 ms, readout resolution = 512, FOV = 200 x 5 mm2, 145 repetitions, 5 echoes per refocusing RF pulse; (II) ETL = 3, echo spacing 50 ms, readout resolution = 512, FOV = 200 x 5 mm2, 145 repetitions, 9 echoes per refocusing RF pulse). For both sequences, the slice thickness for excitation and refocusing was 5 mm.Results
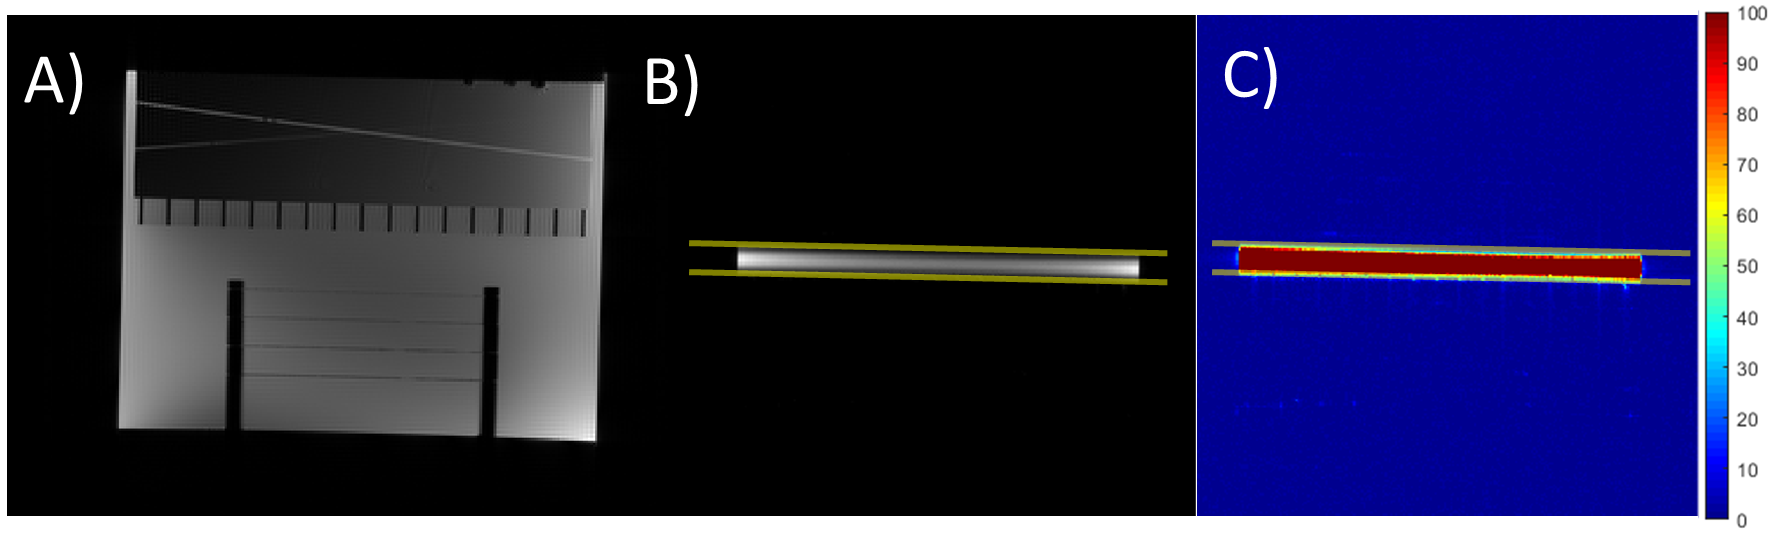
2D SELINE method: Figure 1 shows a representative ROI-selective refocusing RF slice profile in a phantom, acquired by using the 2D SELINE method (Figure 2A). To demonstrate the performance of the refocusing RF pulse, we calculated the SNR map which shows low noise levels outside of the ROI as well as a good slice selectivity. Similar to the phantom experiment, the sharp and narrow ROI-selective RF slice profile was acquired in-vivo with sufficient SNR (Figures 2D and 2E).GSLINE method for rs-fMRI: By turning off the phase-encoding gradient, the T2-weighted line profiles were acquired with GSLINE (Figure 2F). The different GRE- and SE-based line profiles (Figure 2G) were simultaneously generated during the GSLINE acquisition (Figure 2B). The tSNR maps over 145 repetitions for different spin and gradient echoes from the second in-vivo measurement are shown in Figure 3. With sum-of-squares coil combination, we could achieve a tSNR > 30 for multiple echoes, sufficient for BOLD contrast.
Discussion and Conclusion
We implemented a new line-scanning approach and acquired preliminary data for human fMRI studies, based on a GRASE sequence with ROI-selective refocusing RF pulses perpendicular to the excitation plane. To validate the performance of the GSLINE method, we analyzed line profiles and tSNR in the human brain at 3T and achieved sufficient tSNR with a readout resolution of 0.4 mm in both GRE and SE-type echoes. While these results serve as a first baseline, the method can be further improved by advanced physiological noise and motion corrections, as well as optimizated methods for coil combination2. Moreover, quantitative analysis, such as e.g. T2 mapping, is possible within a single TR as we acquire multiple line profiles from spin and gradient echoes with different TE. In addition, as reduced refocusing flip angles in CPMG or GRASE sequences do not significantly reduce BOLD sensitivity5, the method is eligible for ultra-high-field (e.g. 7T or 9.4T) applications within SAR limits, even with multiple spin echoes during a single TR.Acknowledgements
No acknowledgement found.References
1: Yu, X., Qian, C., Chen, Dy. et al. Deciphering laminar-specific neural inputs with line-scanning fMRI. Nat Methods 11, 55–58 (2014). https://doi.org/10.1038/nmeth.2730
2: Raimondo L, Knapen T, Oliveira ĺcaro A., et al. A line through the brain: implementation of human line-scanning at 7T for ultra-high spatiotemporal resolution fMRI. Journal of Cerebral Blood Flow & Metabolism. 2021;41(11):2831-2843.
3: Choi, S., Zeng, H., Pohmann, R., Scheffler, K., Yu, X., 2019. Novel alpha-180 SE based LINE-scanning method ( SELINE ) for laminar-specific fMRI. ISMRM 27th Annual Meeting & Exhibition proceedings, Montreal, Canada 1166.
4: Feinberg, D. A. et al. Inner volume MR imaging: technical concepts and their application. https://doi.org/10.1148/radiology.156.3.4023236 156, 743–747 (1985).
5:
Scheffler, K, Engelmann, J, Heule, R. BOLD sensitivity and vessel size specificity along CPMG and GRASE echo trains. Magn Reson Med. 2021; 86: 2076– 2083. https://doi.org/10.1002/mrm.28871
Figures