1103
Multi-Echo MR-Encephalography using Spherical Stack of Spirals Trajectories1Department of Radiology, Medical Physics, University Medical Center Freiburg, Faculty of Medicine, University of Freiburg, Freiburg, Germany, 2Department of Artificial Intelligence in Biomedical Engineering, Friedrich-Alexander University Erlangen-Nürnberg, Erlangen, Germany
Synopsis
MREG allows very fast measurement of physiological signal changes at 100 ms acquisition time per volume. In order to investigate BOLD and non-BOLD contributions to the observed signal variations we have implemented an interleaved measurement scheme based on signal readout with two different echo times (15 and 36 ms). The interleaved implementation with alternating echo times increases the acquisition time to 200 ms, which still allows to investigate BOLD vs. non-BOLD signal changes at frequencies up to ±2.5 Hz. Preliminary measurements demonstrate the feasibility of ME-MREG in detecting both neuronal activations and resting-state functional connectivities.
Introduction
In recent years, the development of fast fMRI techniques has not only enabled the direct filtering of unaliased physiological noise, but has also led to an increased sensitivity to detect functional connectivities in the resting state1–4. MR-encephalography (MREG) combines highly undersampled non-Cartesian trajectories with parallel imaging to achieve repetition times of 100 ms for whole brain imaging5. fMRI using a single echo time has been criticized due to the inability to separate BOLD from artifact signal contributions such as physiological fluctuations, scanner drifts, and motion6. We therefore investigated a modified stack of spirals trajectory with a shorter echo time to enable the comparison of BOLD and non-BOLD effects at a temporal resolution of 200 ms.Methods
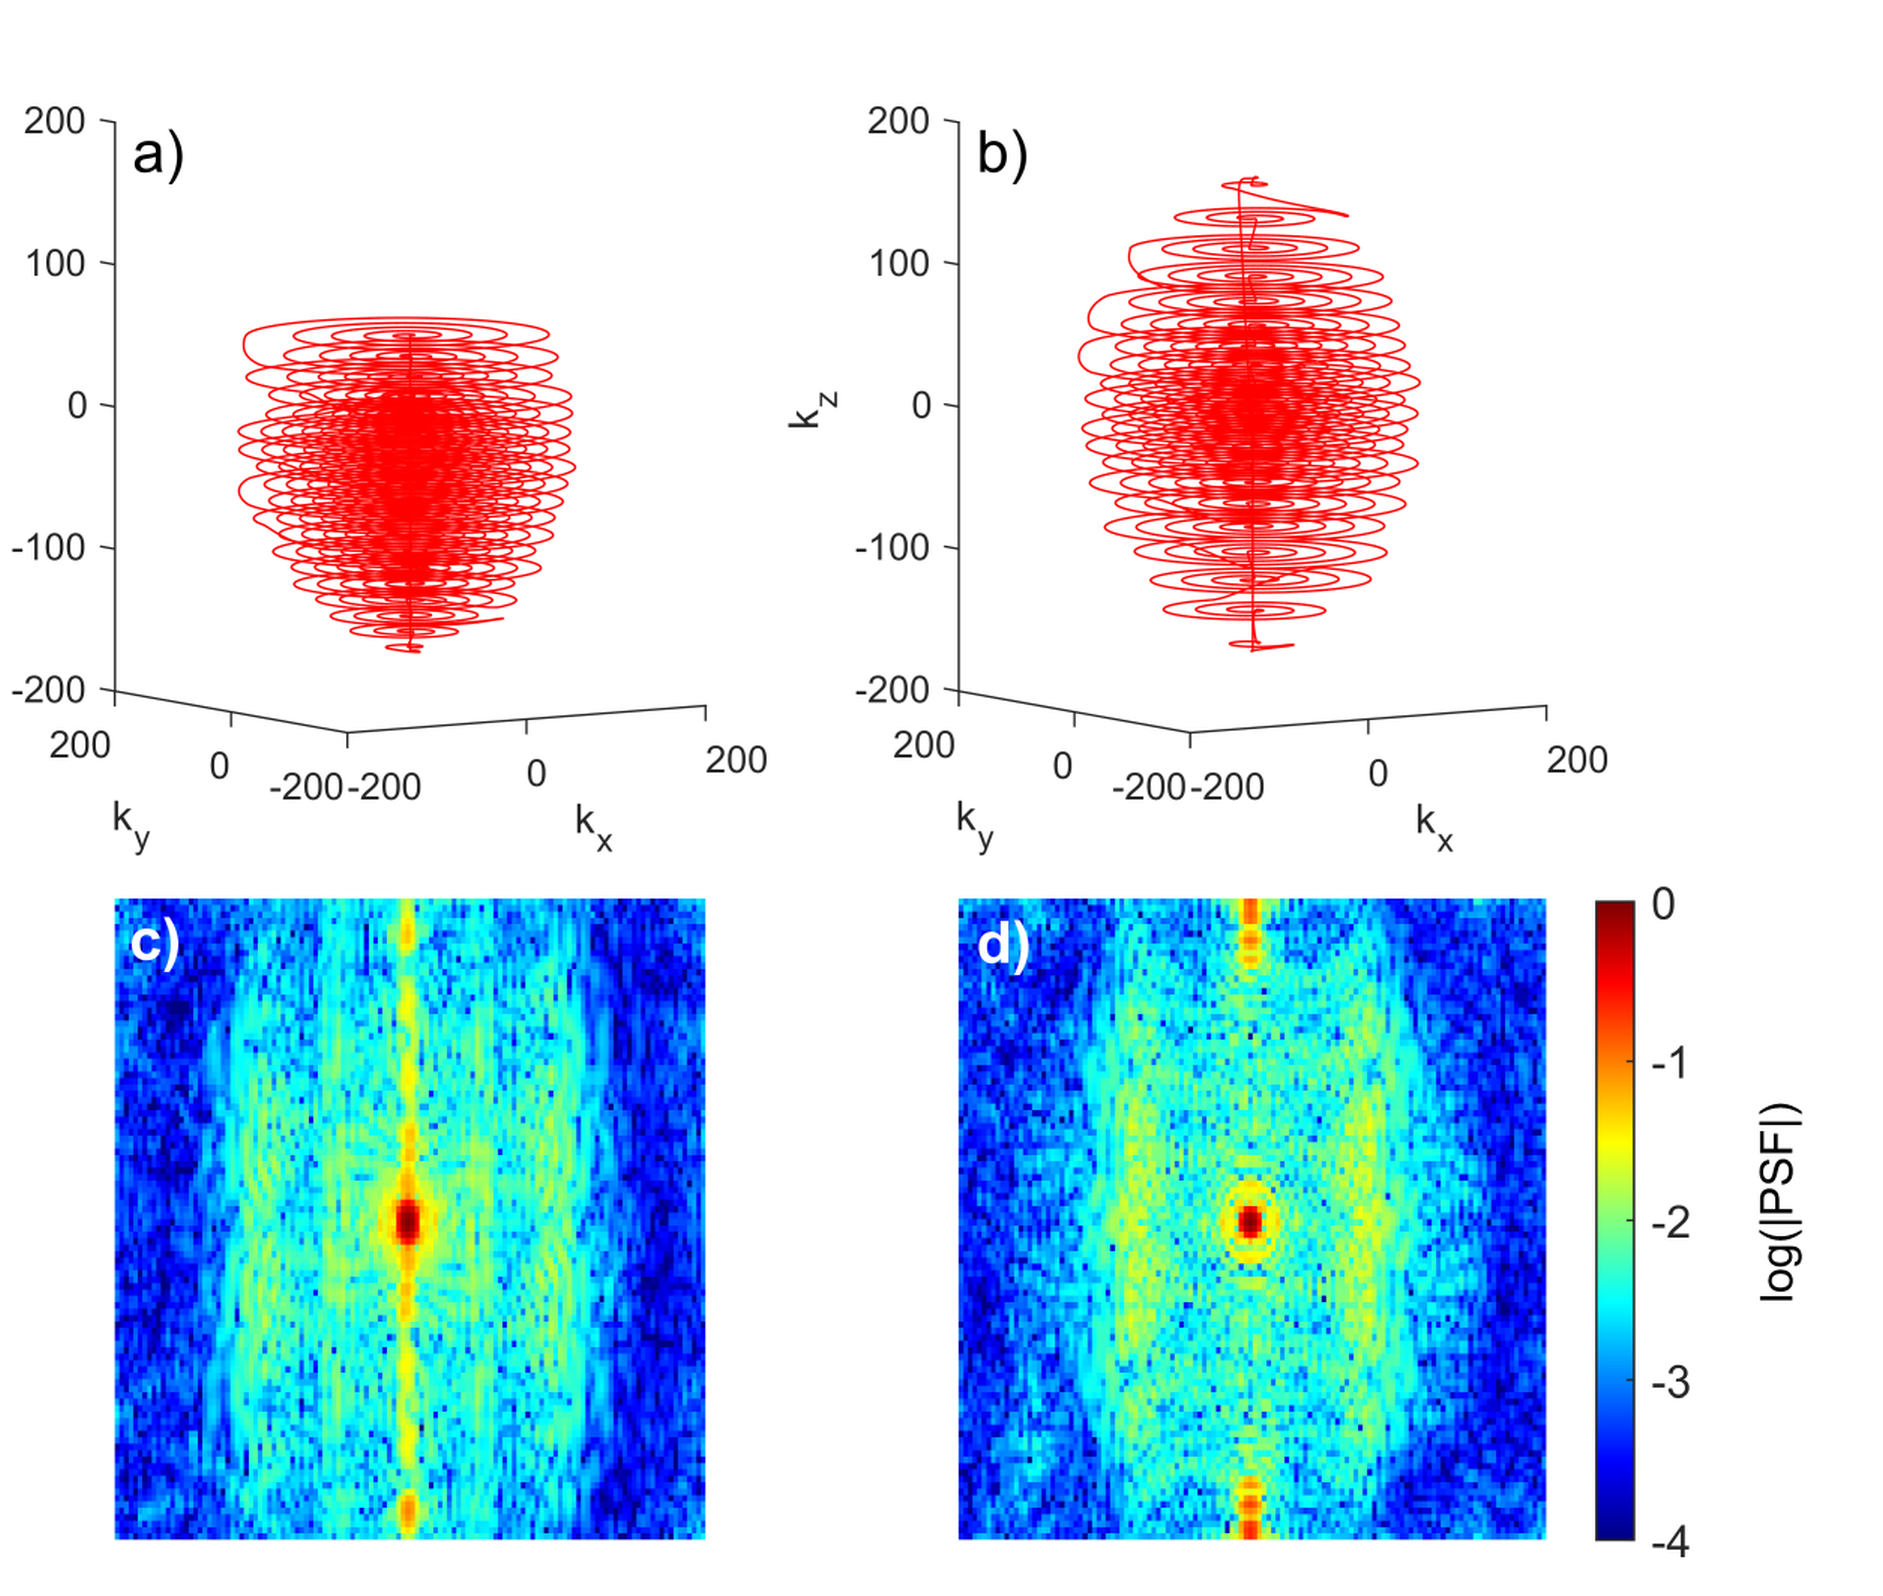
Spherical stack of spirals trajectories were used for both echo times (TE1=15 ms, TE2=36 ms). For the shorter echo time, k-space is sampled asymmetrically (Figure 1). The first half of k-space is highly undersampled so k-space center is reached quickly, while the second half is sampled more densely, with a total trajectory duration of 75 ms equal to the symmetrical trajectory used for the longer echo time. For proof of concept, visual activation MRI data from three healthy volunteers were acquired at 3.0 T (Siemens Prisma, Erlangen, Germany) using a 64 RX head coil array. Visual stimulation was performed with alternating 18 s flickering checkerboard/18 s rest, which was repeated five times. Measurement parameters were TR=200 ms, TE1 = 15 ms, TE2 = 36 ms, matrix size = 192x192x150, and spatial resolution = 3x3x3 mm. Both trajectories were used alternately for readout, and data was reconstructed with MATLAB (Natick, Massachusetts, USA) using a conjugate gradient method with Tikhonov regularization7. A 2D multi-slice, multi gradient echo sequence (TR=1000 ms,TE=2.46/4.92 ms) was used for calculation of coil sensitivities. Following motion correction, highpass-filtering above 0.01 Hz, and smoothing by a 6 mm Gaussian kernel with FSL8, activation maps were computed using FMRISTAT9. Additionally, resting-state data from four volunteers were acquired for eight minutes. Here, data were additionally bandpass-filtered between $$$0.01<f<0.1$$$ Hz. An Independent Component Analysis was performed using MELODIC (FSL) to extract the time series and spatial distribution of each component. IC maps were thresholded with P=0.95. The component time series were fitted to each voxel time series for both echoes using a GLM to calculate the weighting of each component. The weighting divided by the signal then yields the percent signal changes.Results
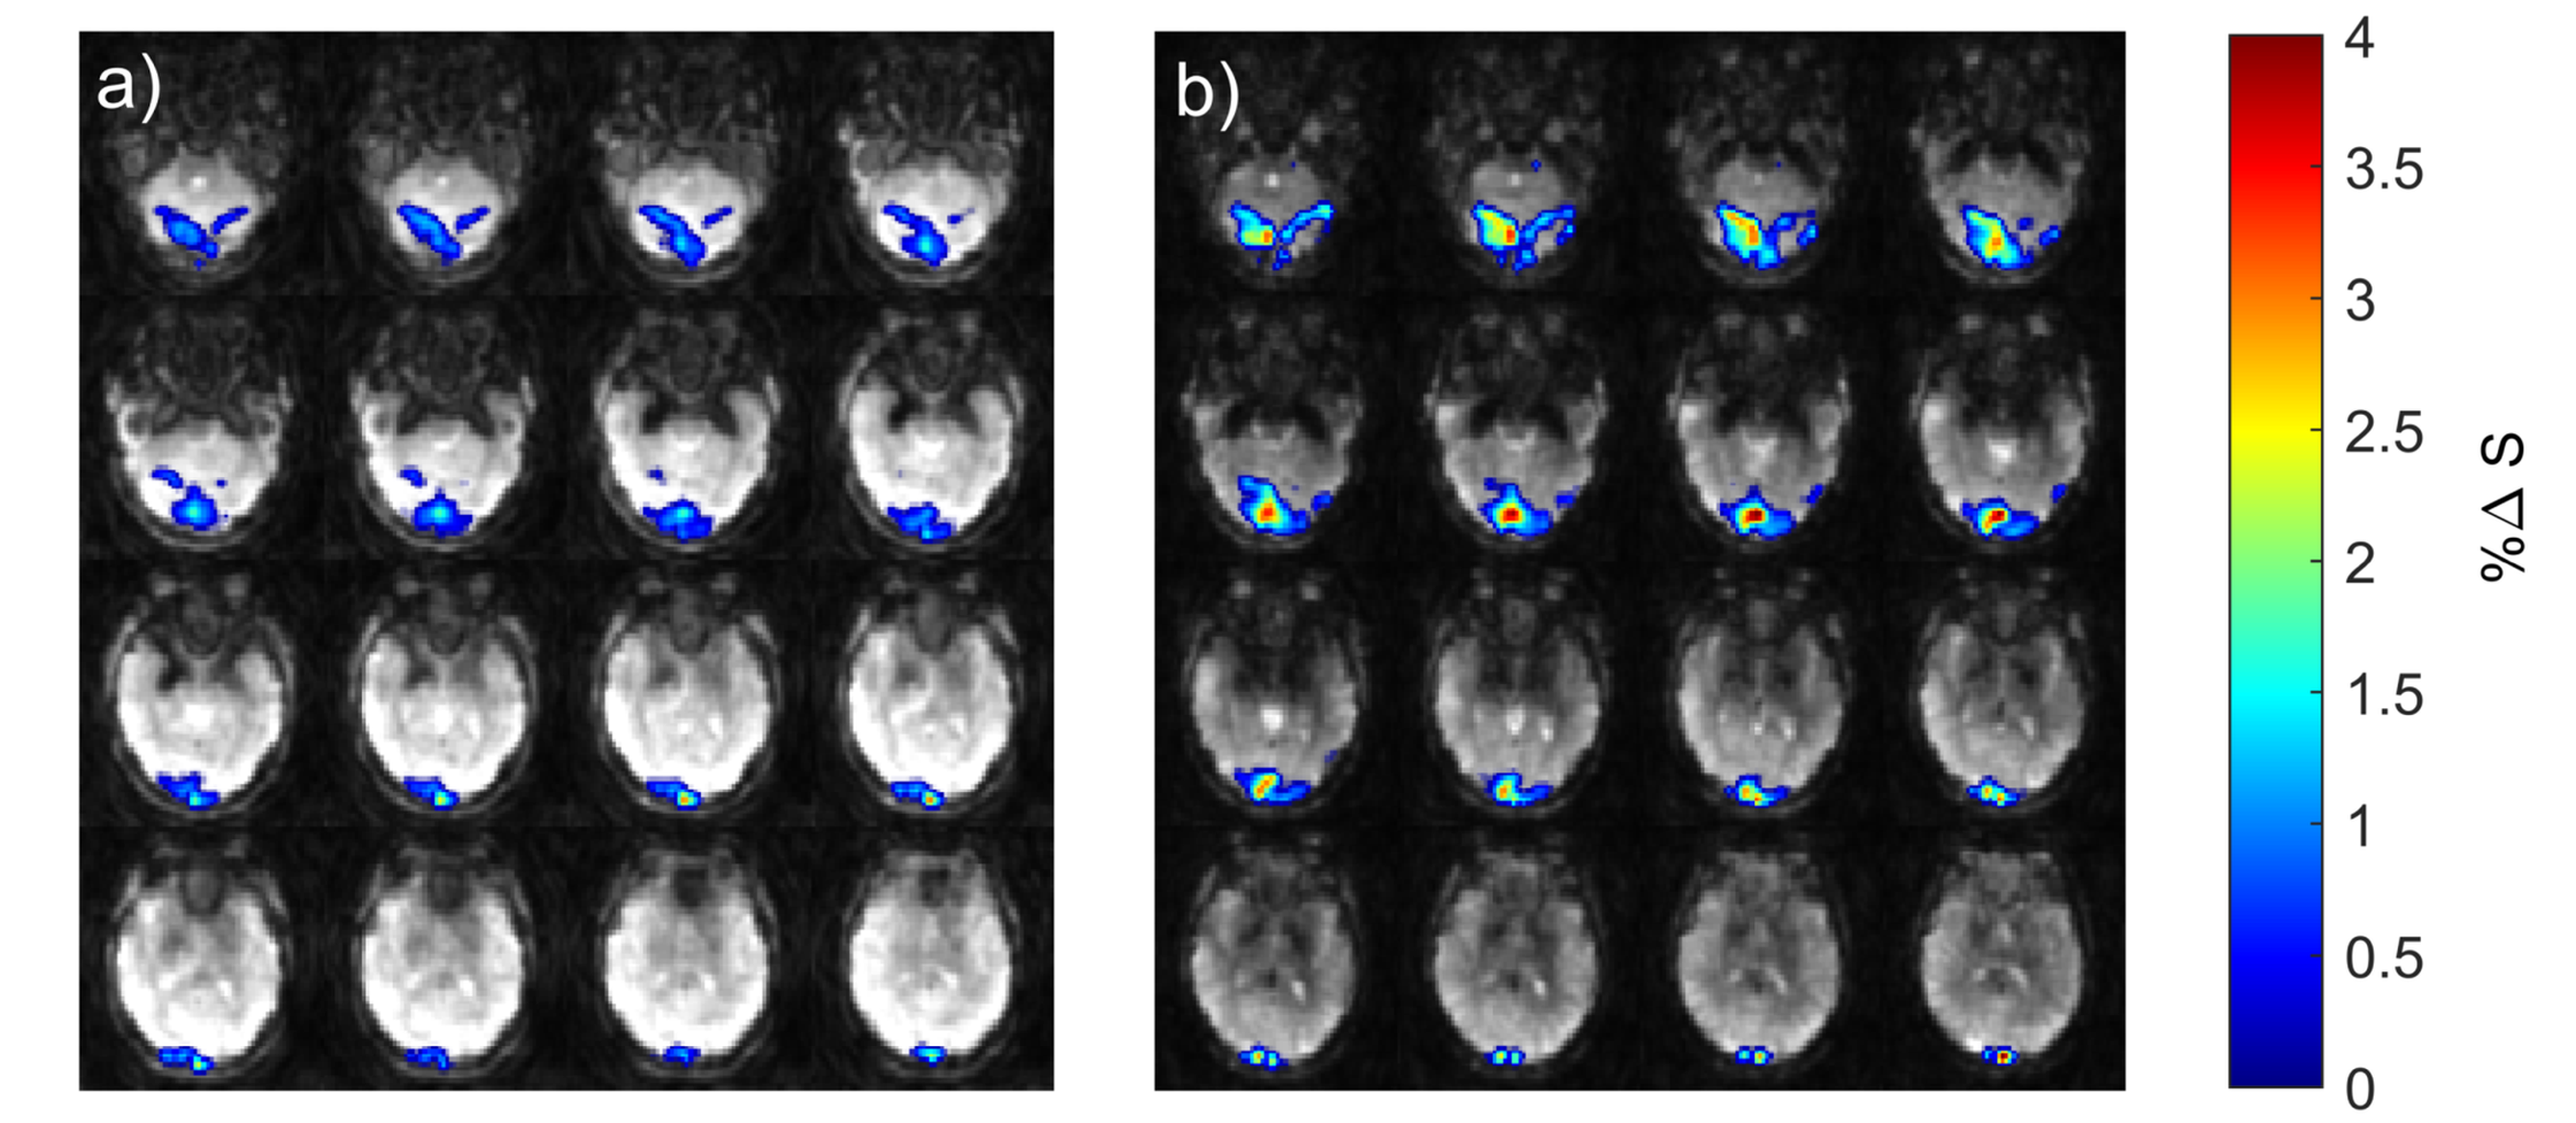
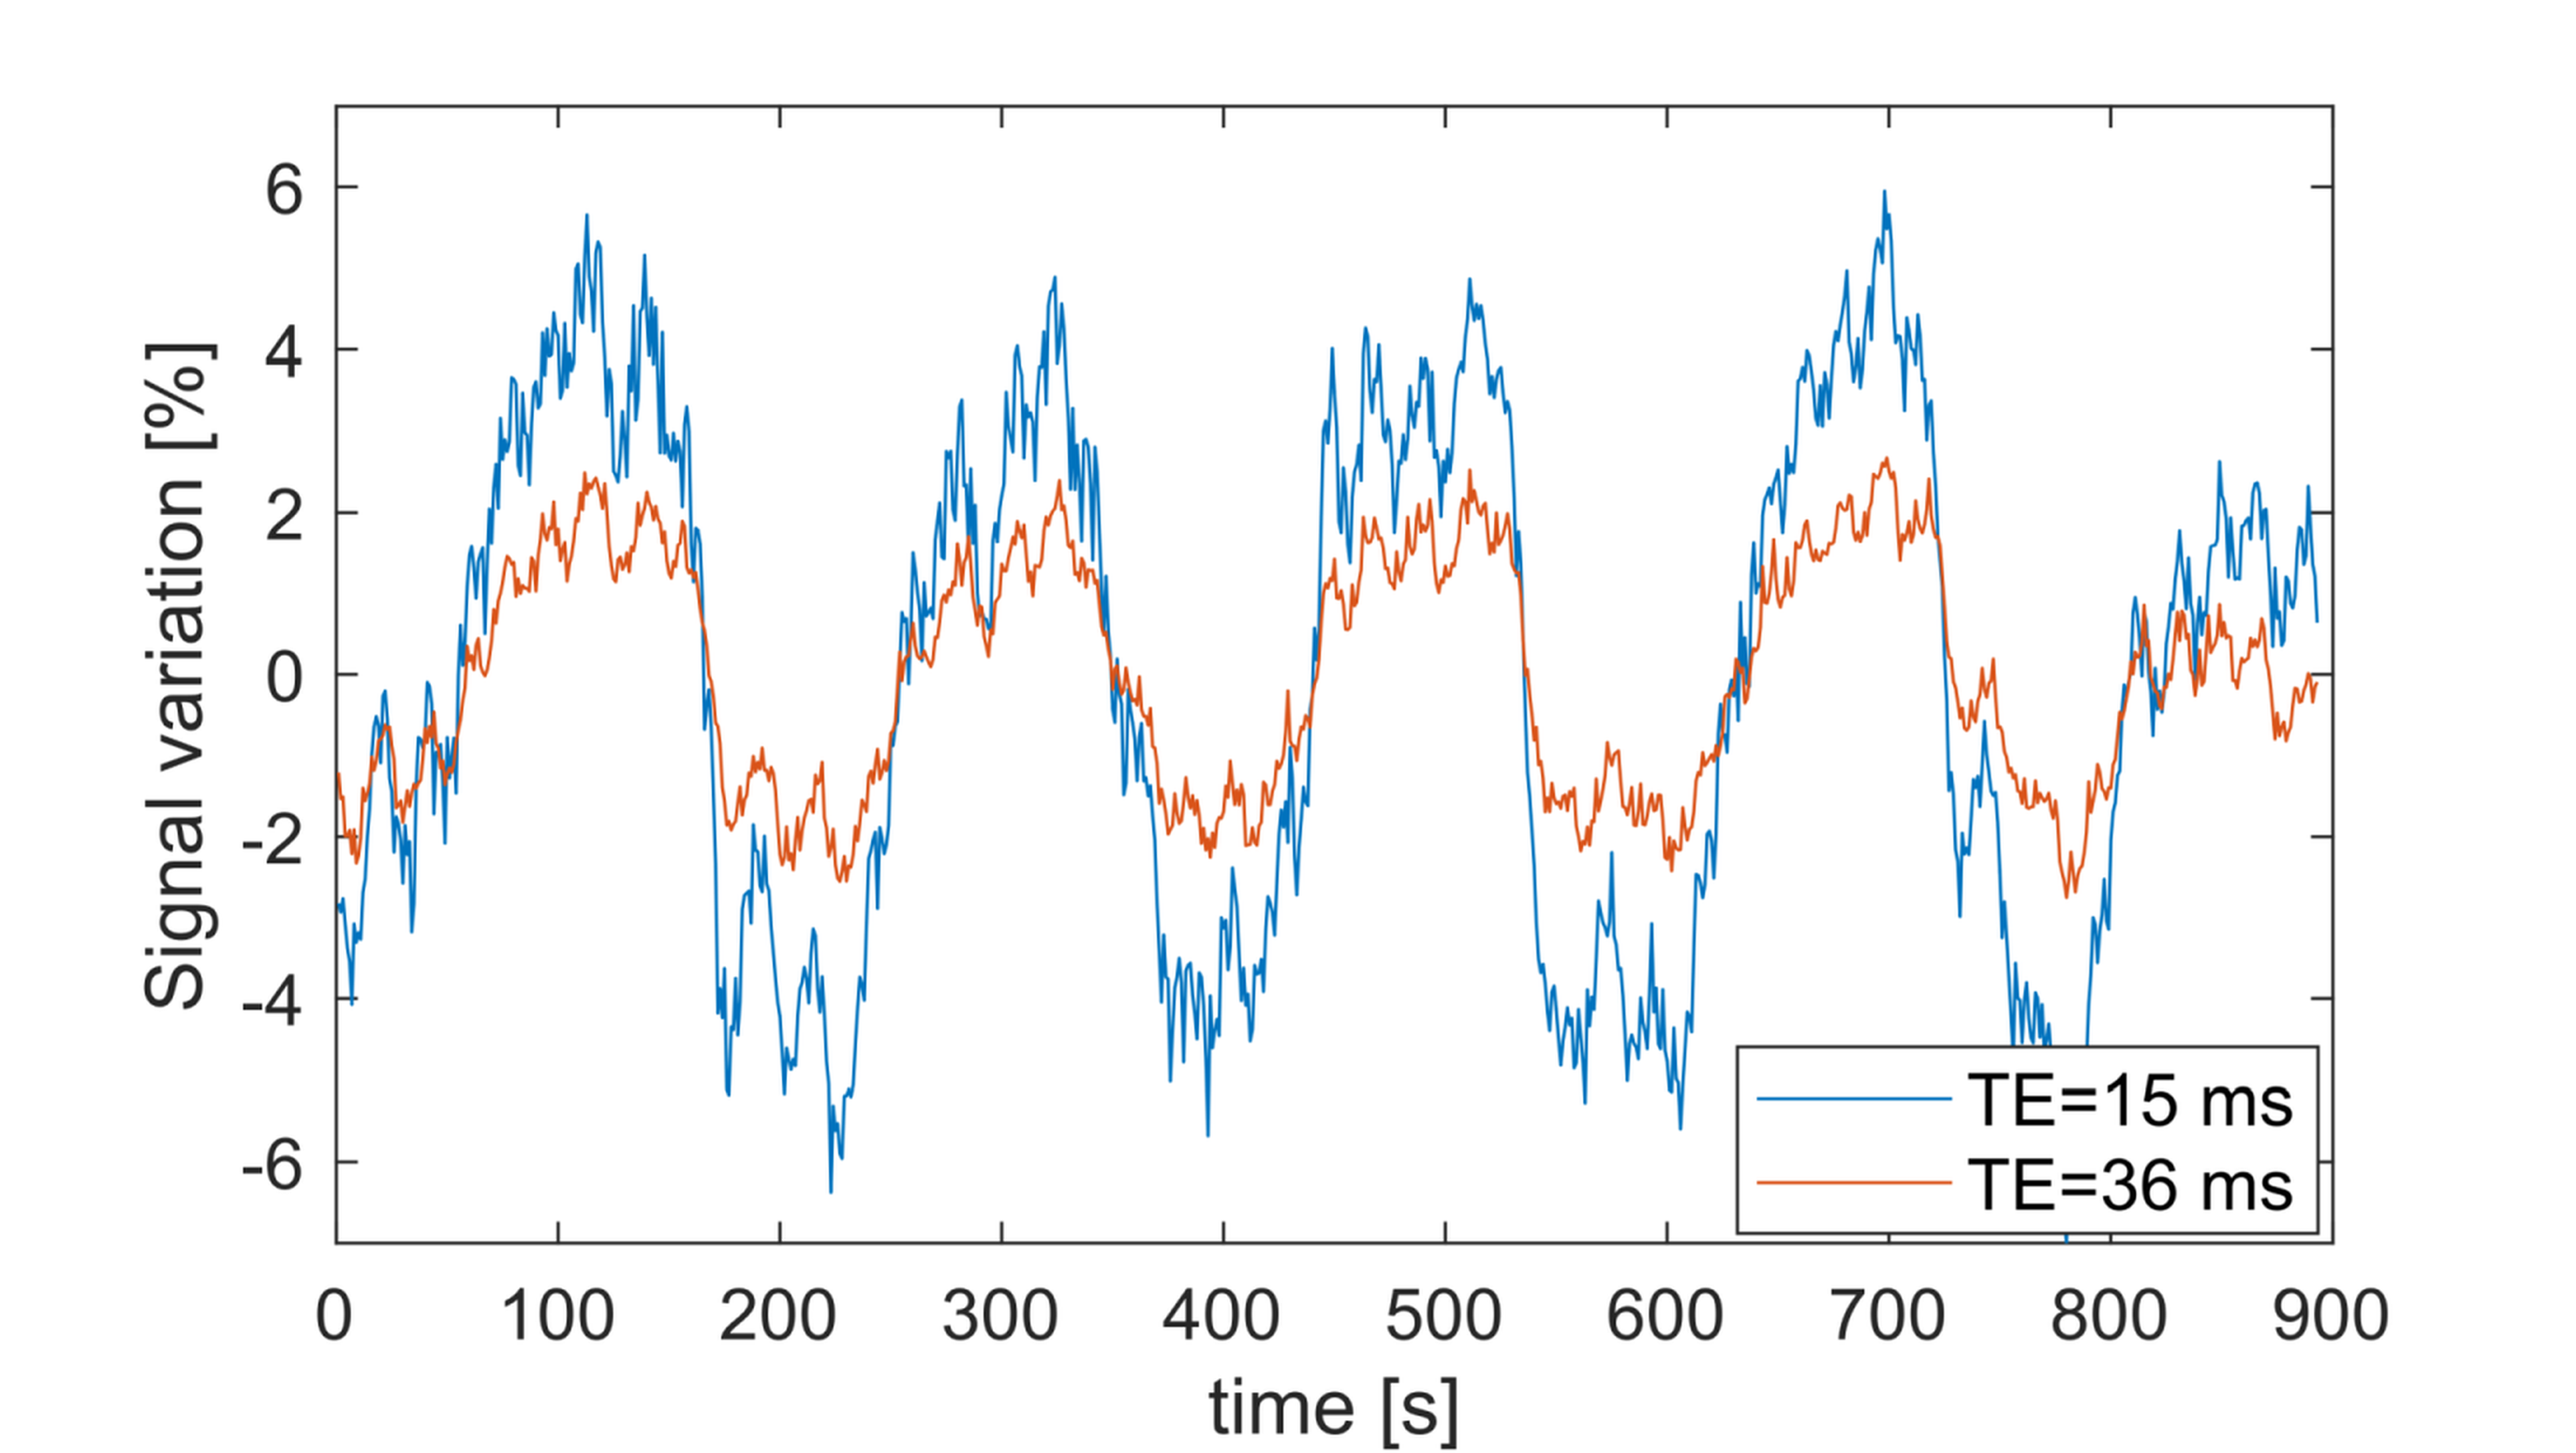
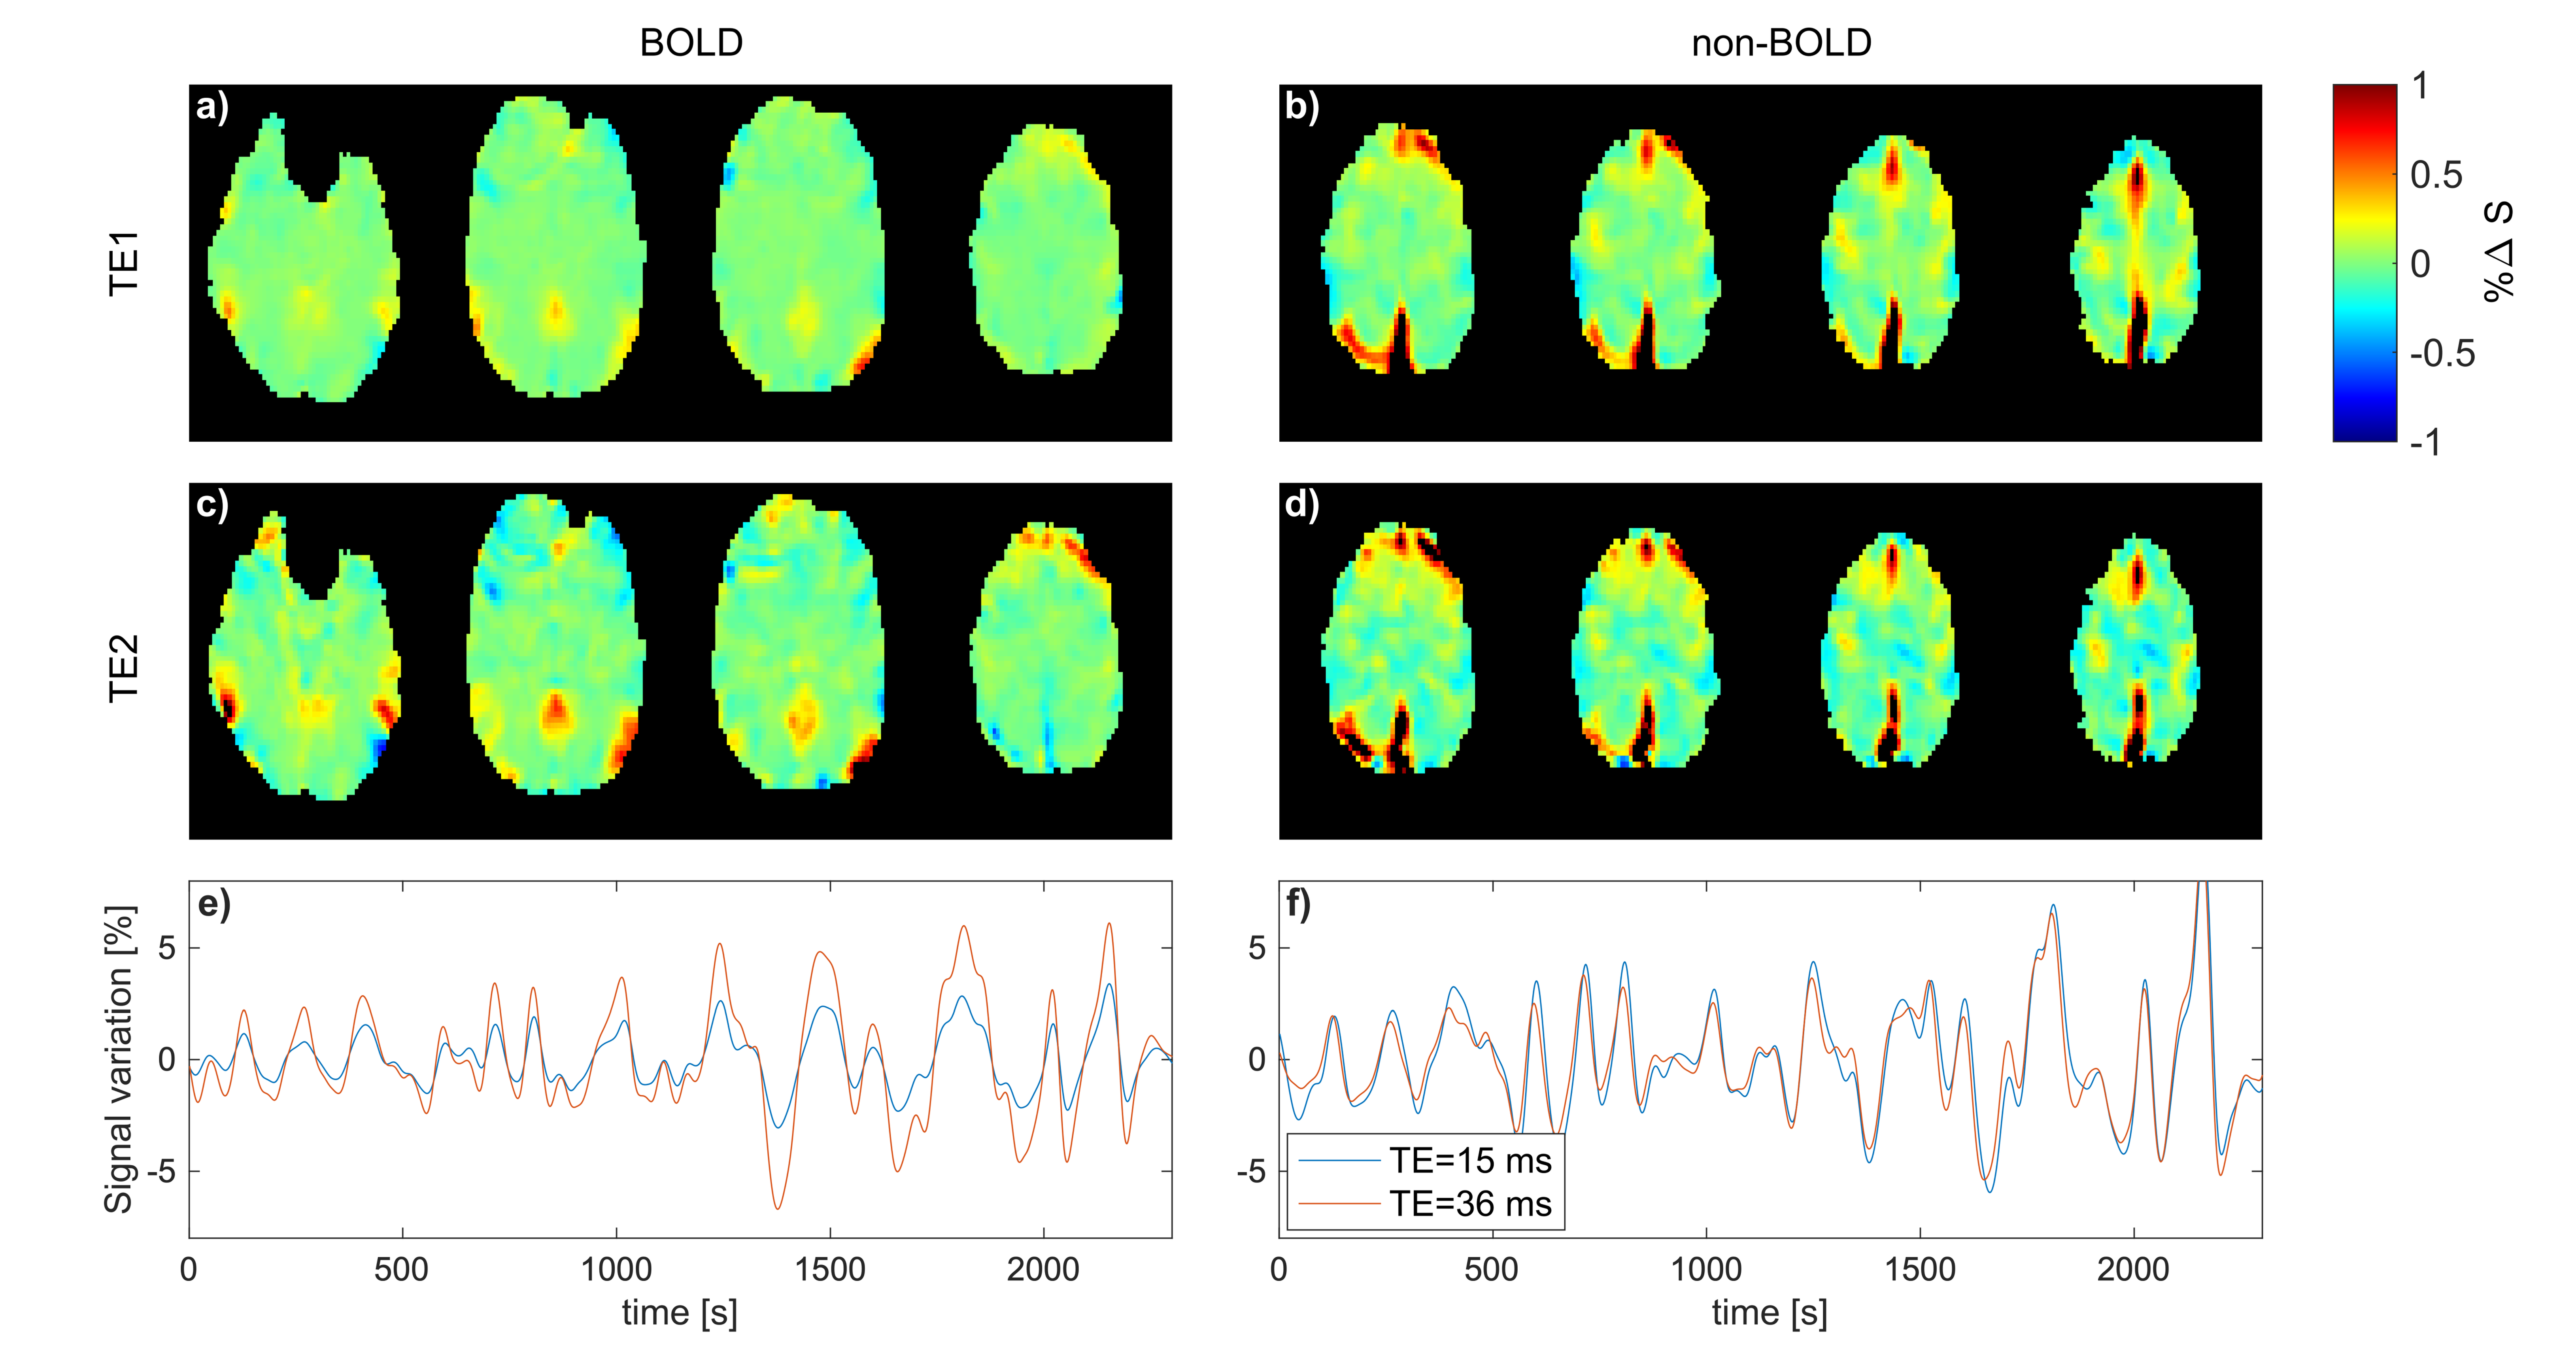
Figure 2 shows the percent signal changes of the BOLD response after visual stimulation for TE1=15 ms and TE2=36 ms, respectively. The percentage change in the visual cortex was higher for TE=36 ms in all three subjects. The total number of voxels activated above a statistical t-threshold of t=6 (p<0.05, uncorrected) was16 percent higher for TE=36 ms compared to TE=15 ms. ICA analysis of resting-state data yielded a mean number of 26.5±4.7 and 36.5±2.4 extracted networks for TE1=15 and TE2=36 ms, respectively. From the time series response of each component, BOLD-like components showed to have a higher response amplitude in the second echo, e.g. the default mode network shown in Fig. 4e). For non-BOLD components, the response amplitude remains constant or is lower in the second echo, e.g. the sagittal sinus shown in Fig. 4f). The higher response amplitude in the second echo was also observed in other networks such as the executive control, motor, and visual networks, whereas no clear response increase was observed in motion and nuisance components.Discussion/Conclusion
It was shown that the presented asymmetrical stack of spirals trajectory design with a TE of 15 ms is suitable for multi-echo imaging at TR=200 ms. The shorter echo time leads to a broadening of the point spread function, as seen in Figure 1c)-however, since all fMRI data is commonly smoothed with Gaussian kernels up to 6mm-8mm10, this did not appear to affect the analysis in the present work. As to be expected6, the percent signal change of the BOLD response after visual stimulation was higher for the second echo for all three volunteers (Figure 3). In the resting-state connectivity analysis, this higher percent signal change was also observed for BOLD-like components, while non-BOLD components exhibited no increase. Future work will focus on the development of a robust statistical analysis for ME-MREG. Since there has been an increased amount of interest in high frequency brain connectivity over the last years11,12, a resting-state connectivity analysis in the higher frequency range as well as an investigation of BOLD- and non-BOLD contributions to the observed signal correlations will be performed. Furthermore, signal fluctuations caused by the fluctuating periodicity of the ECG and respiration will be investigated and compared for both TE=15 ms and TE=36 ms.Acknowledgements
No acknowledgement found.References
1. LeVan, P., Akin, B. & Hennig, J. Fast imaging for mapping dynamic networks. NeuroImage 180, 547–558 (2018).
2. Akin, B., Lee, H.-L., Hennig, J. & LeVan, P. Enhanced subject-specific resting-state network detection and extraction with fast fMRI. Human brain mapping 38, 817–830 (2017).
3. Kiviniemi, V. et al. Ultra-fast magnetic resonance encephalography of physiological brain activity – Glymphatic pulsation mechanisms?: Journal of Cerebral Blood Flow & Metabolism (2015) doi:10.1177/0271678X15622047.
4. Hennig, J. et al. 15 Years MR-encephalography. MAGMA 34, 85–108 (2021).
5. Assländer, J. et al. Single shot whole brain imaging using spherical stack of spirals trajectories. Neuroimage 73, 59–70 (2013).
6. Kundu, P. et al. Multi-echo fMRI: A review of applications in fMRI denoising and analysis of BOLD signals. NeuroImage 154, 59–80 (2017).
7. Hugger, T. et al. Fast Undersampled Functional Magnetic Resonance Imaging Using Nonlinear Regularized Parallel Image Reconstruction. PLOS ONE 6, e28822 (2011).
8. Jenkinson, M., Beckmann, C. F., Behrens, T. E. J., Woolrich, M. W. & Smith, S. M. FSL. Neuroimage 62, 782–790 (2012).
9. Worsley, K. J. et al. A General Statistical Analysis for fMRI Data. NeuroImage 15, 1–15 (2002).
10. Strother, S. C. Evaluating fMRI preprocessing pipelines. IEEE Eng Med Biol Mag 25, 27–41 (2006).
11. Lee, H.-L., Zahneisen, B., Hugger, T., LeVan, P. & Hennig, J. Tracking dynamic resting-state networks at higher frequencies using MR-encephalography. Neuroimage 65, 216–222 (2013).
12. Smith-Collins, A. P. R., Luyt, K., Heep, A. & Kauppinen, R. A. High frequency functional brain networks in neonates revealed by rapid acquisition resting state fMRI. Hum Brain Mapp 36, 2483–2494 (2015).
Figures