1101
T-Hex spirals for whole-brain fMRI at 5 frames per second: Image quality and BOLD sensitivity1Institute for Biomedical Engineering, ETH Zurich & University of Zurich, Zürich, Switzerland, 2Translational Neuromodeling Unit, University of Zurich & ETH Zurich, Zürich, Switzerland, 3Max Planck Institute for Metabolism Research, Cologne, Germany
Synopsis
fMRI is one of the driving technologies of neuroscience. During the past years, acquisition speeds below one second per whole-brain volume have been achieved. The recently proposed 3D T-Hex Spiral trajectories provide a powerful approach to enable even faster fMRI. Here, we demonstrate the feasibility of fMRI at a sampling rate of 5Hz with these trajectories at 7T. We acquired whole-brain images of one subject performing a visuo-motor task in the scanner. Our results indicate high BOLD sensitivity and fidelity of voxel timeseries. In total, we analyzed 9000 volumes obtained during 30min of scanning.
Introduction
Functional MRI (fMRI) is central to investigating human brain function. One focus of ongoing development concerns rapid acquisition schemes (see (1) for an overview), with multiplexed EPI as a prominent example2. Important benefits of fast fMRI include increased statistical power, reduced vulnerability to physiological noise, and greater sensitivity of analyses of functional/effective brain connectivity.Spiral trajectories provide a very time-efficient, and therefore attractive, readout strategy. Here, we use a 3D Spiral-In trajectory3. The trajectory passes through a tilted hexagonal (T-Hex) grid in the two phase encoding directions. This results in a well-posed inverse problem for image reconstruction. Additionally, the trajectory is designed such that the k-space is weighted smoothly by the objects magnetization decay during readout.
Contrary to earlier work4, we use a 7T system and make us of higher order SENSE reconstruction5 for increased image quality. Additionally, an event-related, visuo-motor task was implemented providing a demanding, real world use case. We present results from three scan sessions with the same subject. In total, 9000 images obtained during 30min of scanning are analyzed.
Methods
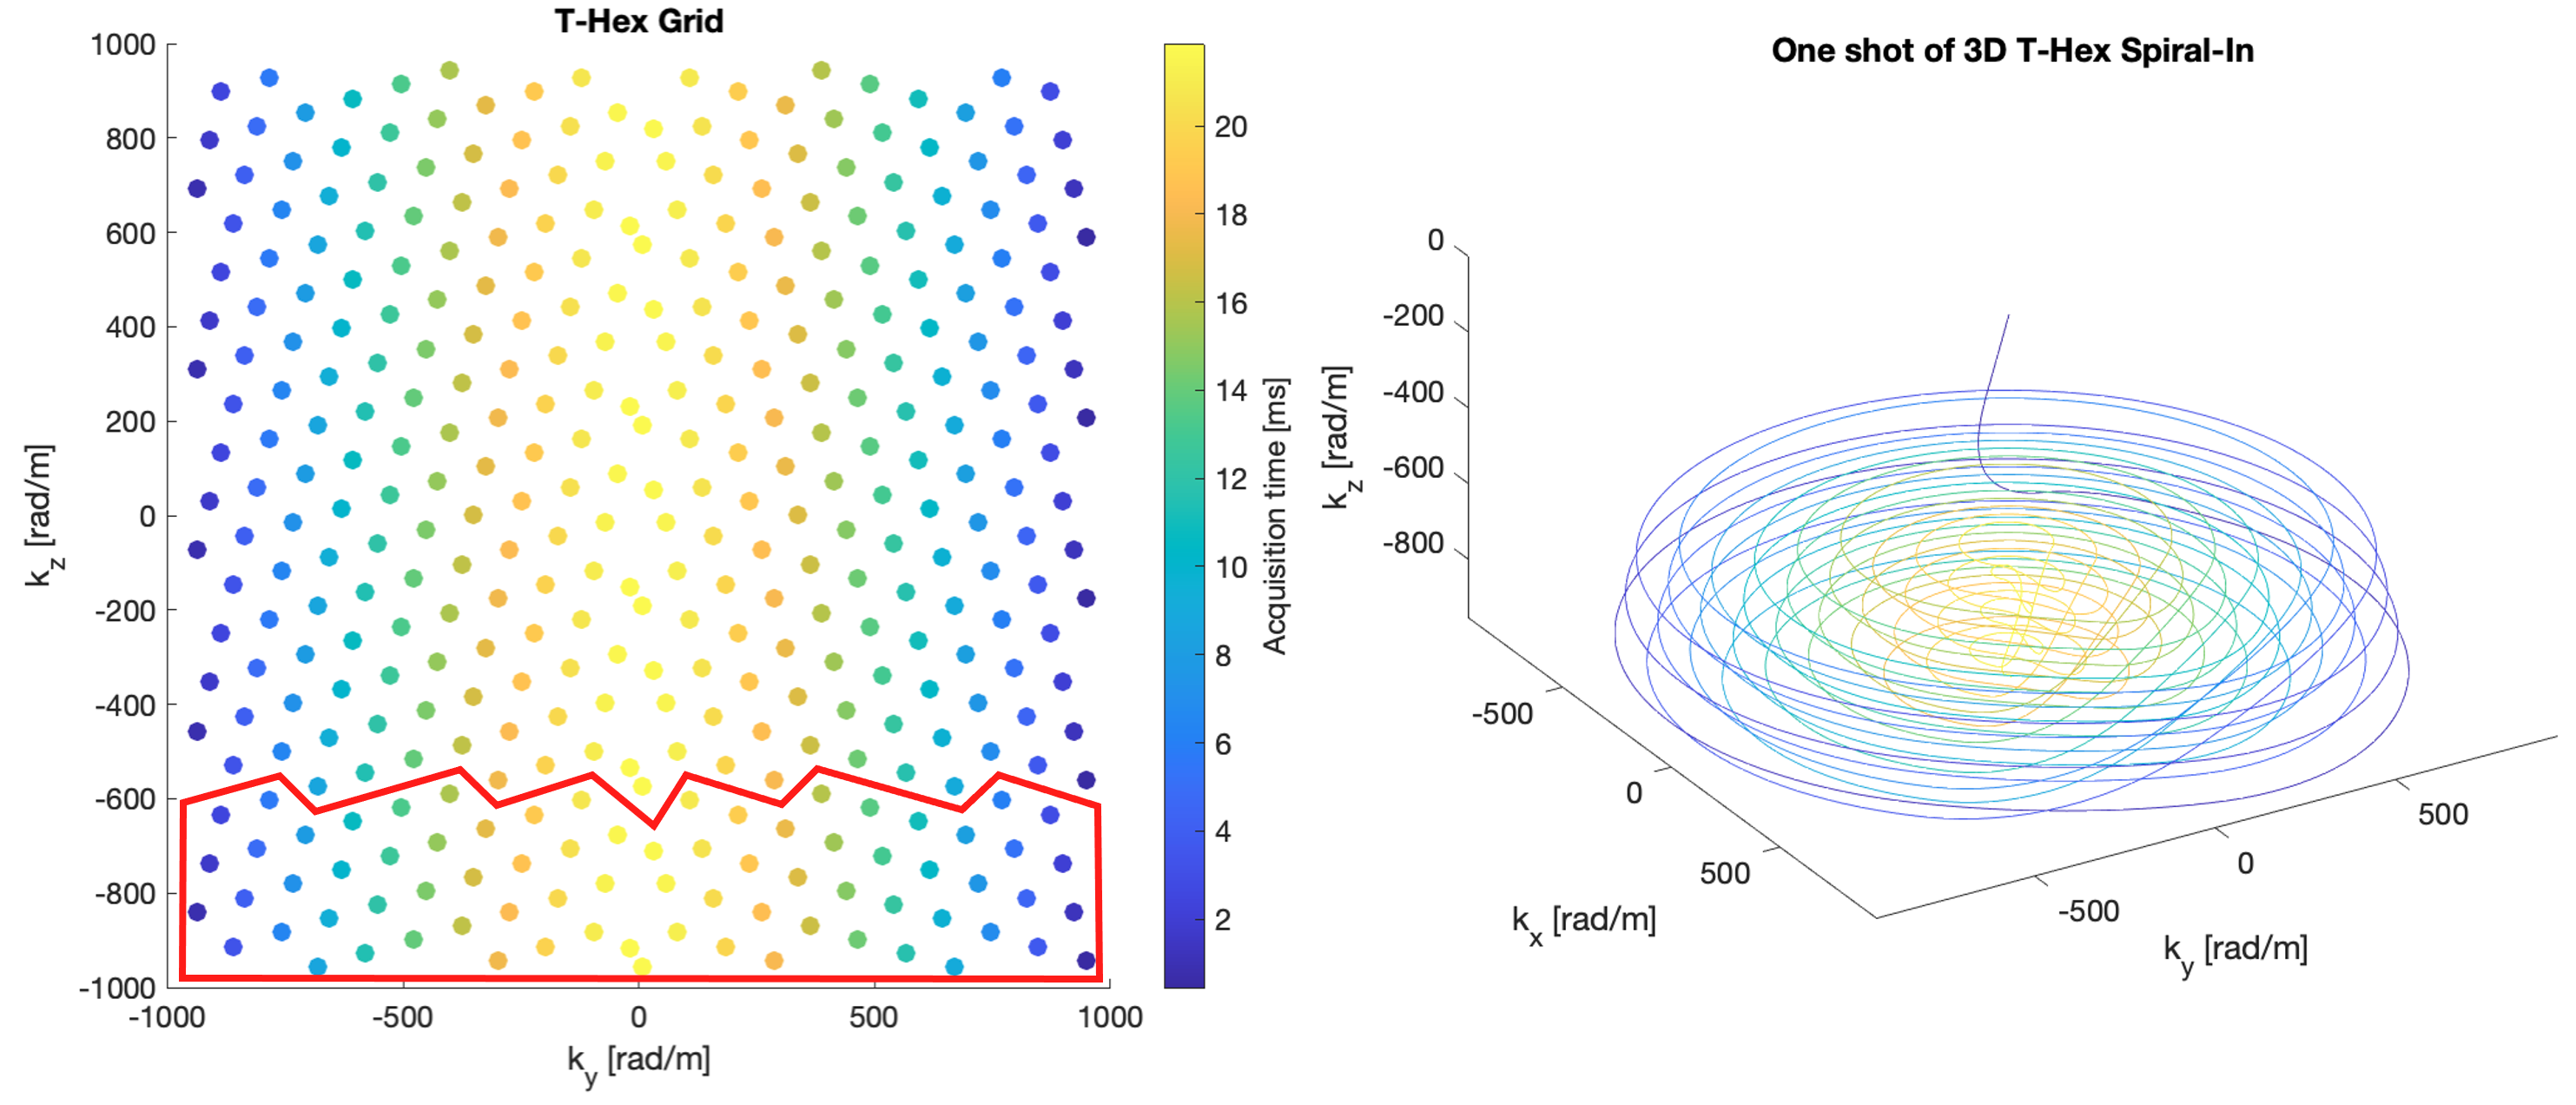
The trajectory (see Figure 1) was designed for a FOV of 200x200x140mm, isotropic resolution of 3.3mm, R=8, and generating lattice vector v=[3,1] (see Figure 2 in (3) for an explanation). 5 shots were used per volume with TR=40ms, and TE=25ms, resulting in 0.2s of scan time per volume. B0- and coil sensitivity maps were obtained from a echo 3D spin-warp sequence, TE1=1.95ms, ΔTE=0.97ms, FOV: 200x200x150mm, and isotropic resolution of 1.5mm.We used the higher order SENSE reconstruction5. However, the algorithm was reimplemented such that it runs efficiently on four GPUs in parallel. 3rd order dynamic field terms, measured concurrently to the fMRI experiment using 16 19F NMR probes, were included in the reconstruction. Finally, an anti-ringing filter was applied in k-space to suppress strongly accentuated high spatial frequencies.
During fMRI, the subject had to report by left- or right-hand button presses the emotion (happy or sad) of real faces presented for 2s in the center of the screen. The appropriate responses (left or right button press) was indicated by two smileys (happy and sad) which were randomly placed on the left and right of the face, respectively. One session consisted of 96 trials (inc. 16 null trials, total duration 10min) which were fully randomized. The onsets of the stimuli were jittered. Between each session, we acquired an additional spin-warp scan.
Data were analyzed using SPM12. The functional scans were realigned, coregistered to the 6th echo of the first spin-warp scan, normalized to MNI space , and smoothed with a 6mm FWHM Gaussian kernel. The data were then analyzed with a GLM including event-related regressors for all conditions (happy faces, sad faces, left button presses, right button presses). All conditions were convolved with the informed basis set. Furthermore, confound regressors for physiological noise and motion were added6. The first 40 scans were excluded from the GLM analysis to allow for T1 saturation effects. SPM’s FAST option7 was used to model the autocorrelation in the noise. Here, we focus on the results for the motor responses.
Results
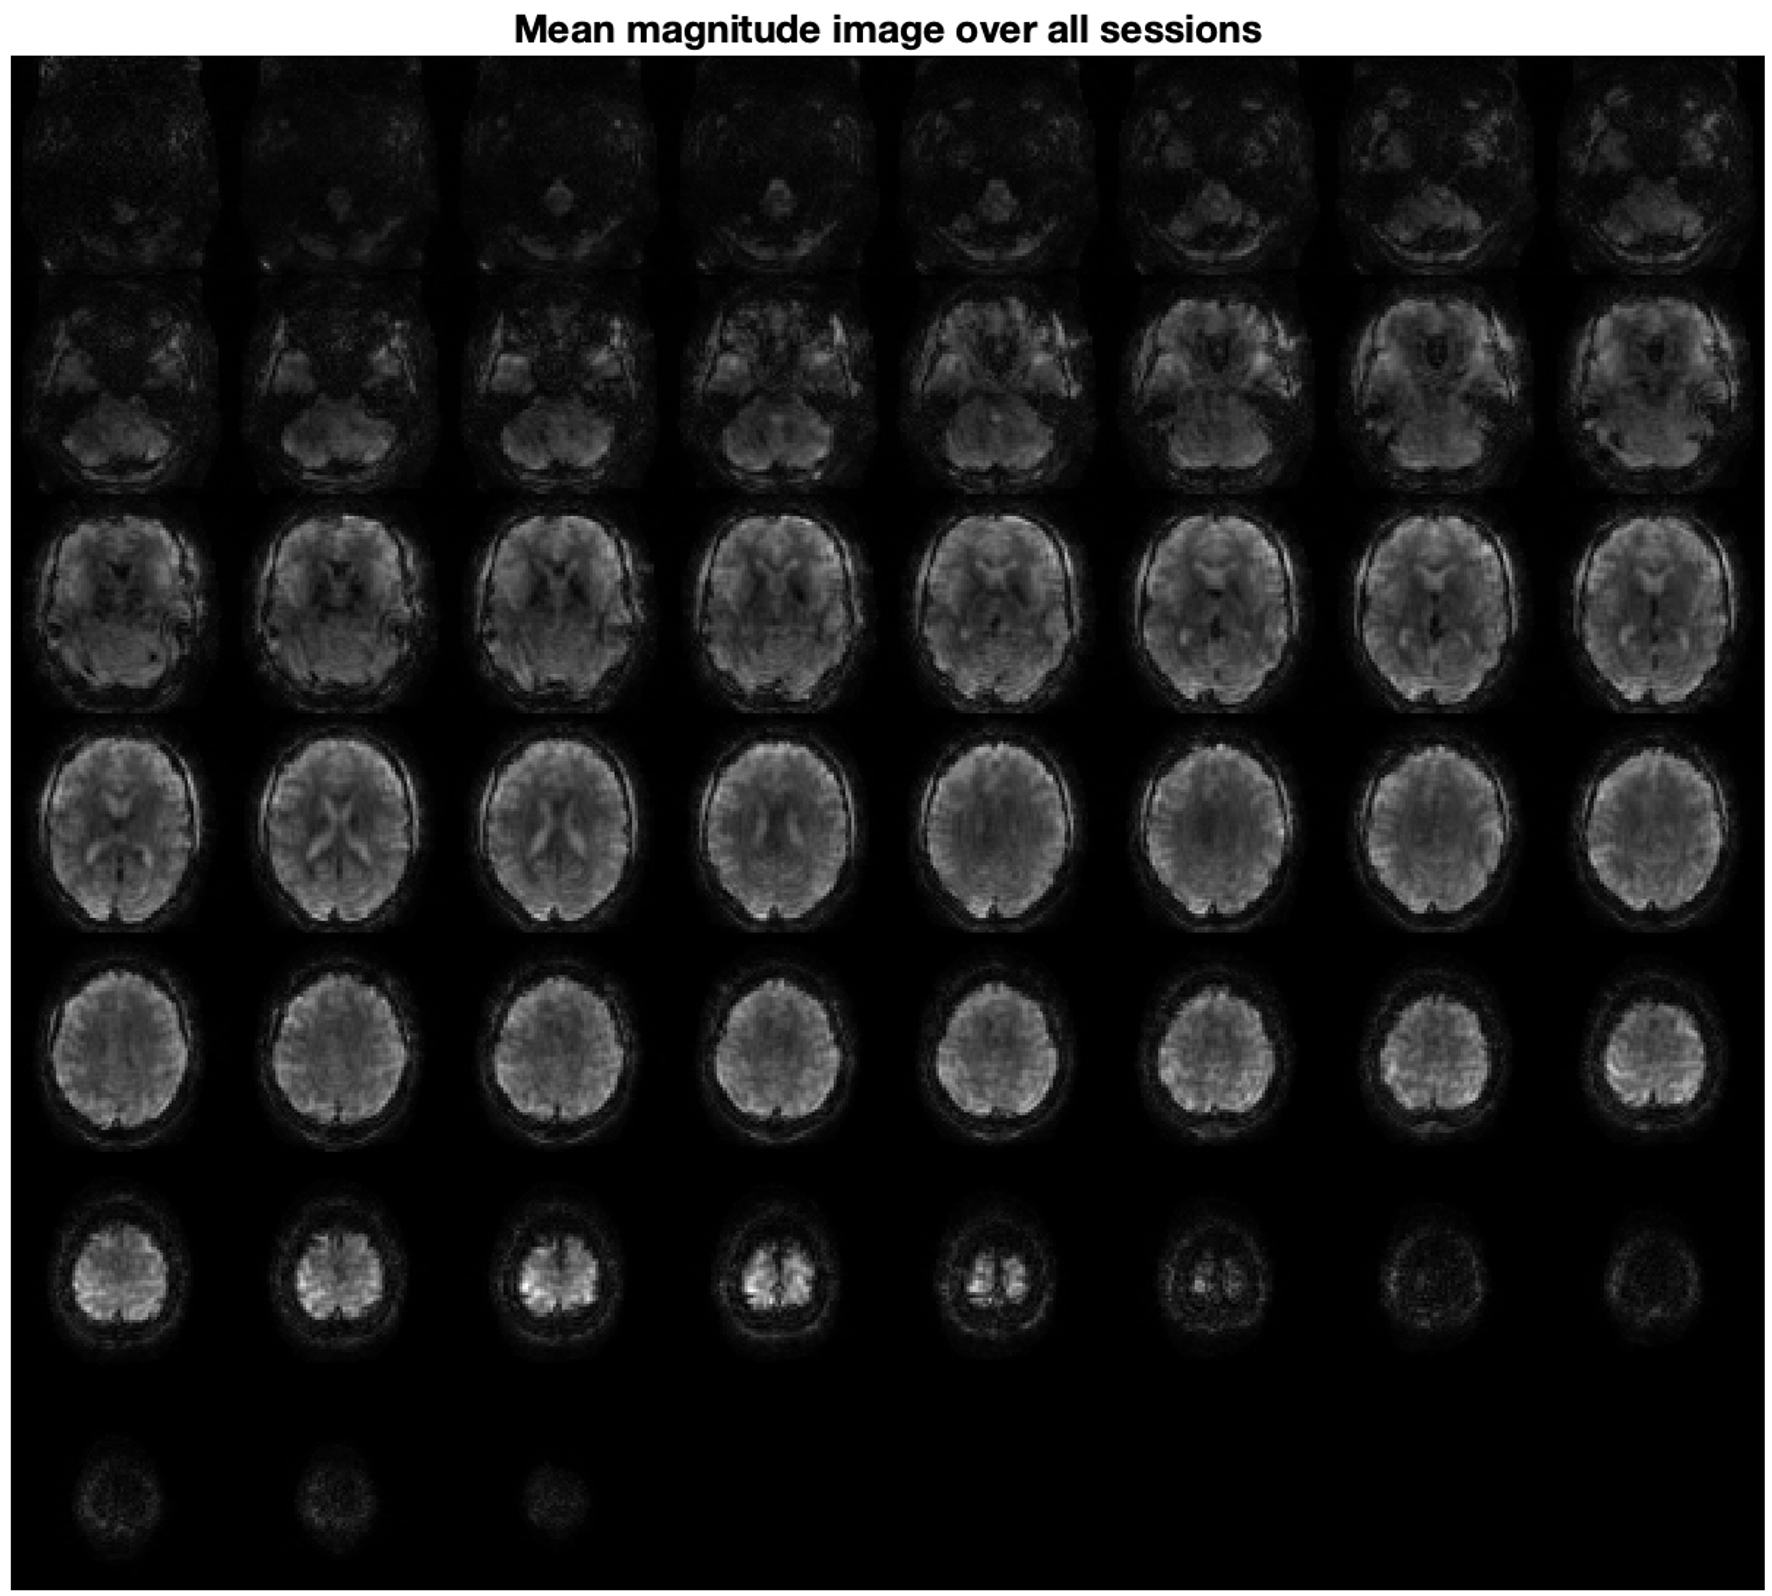
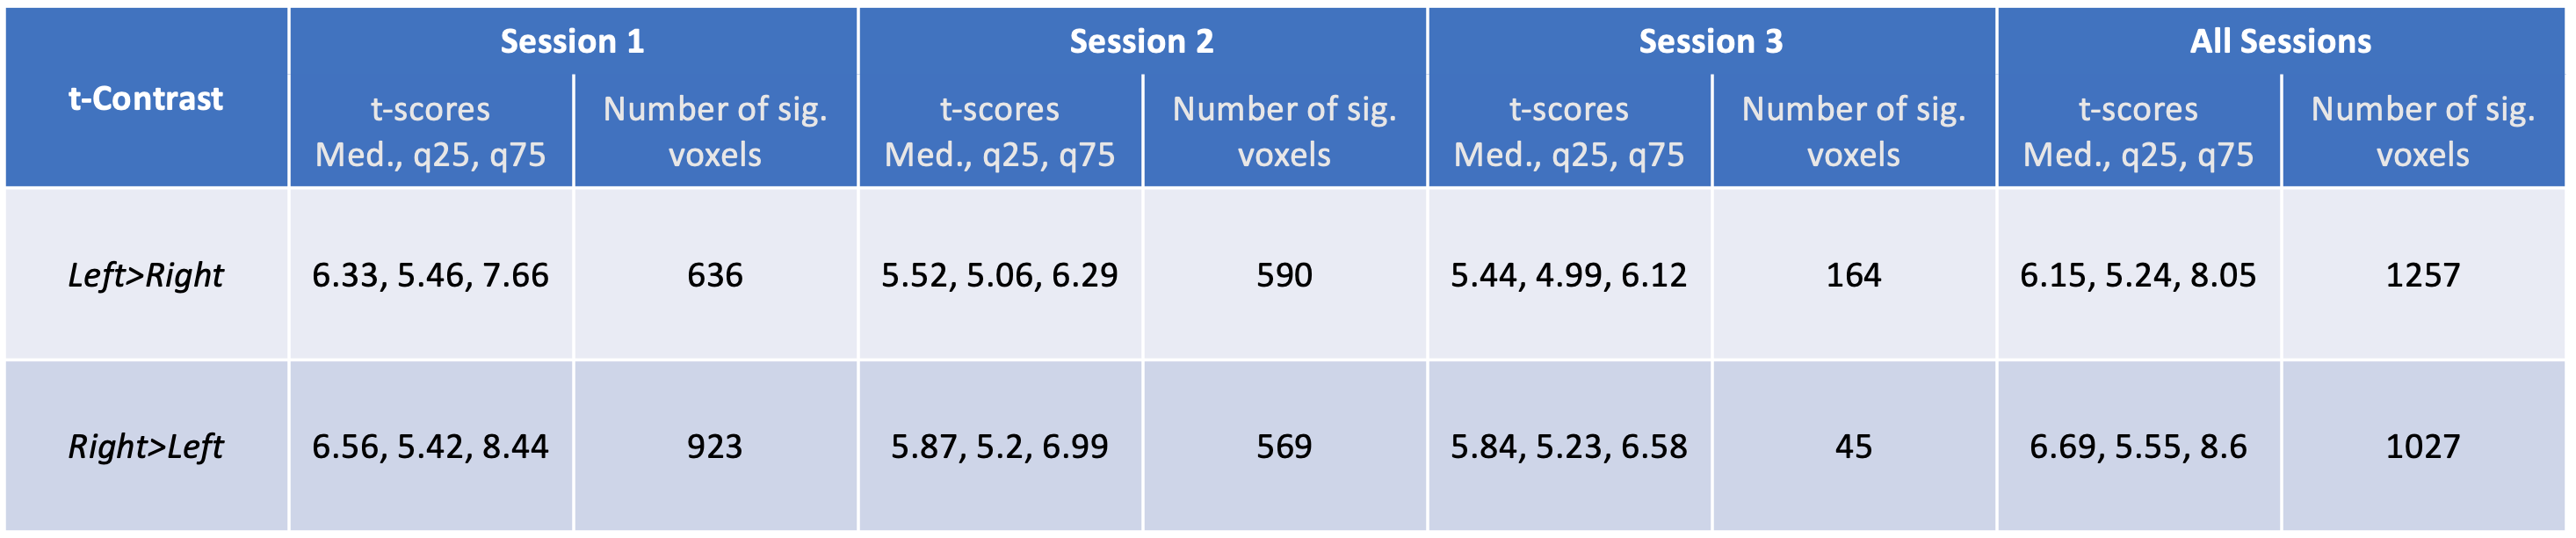
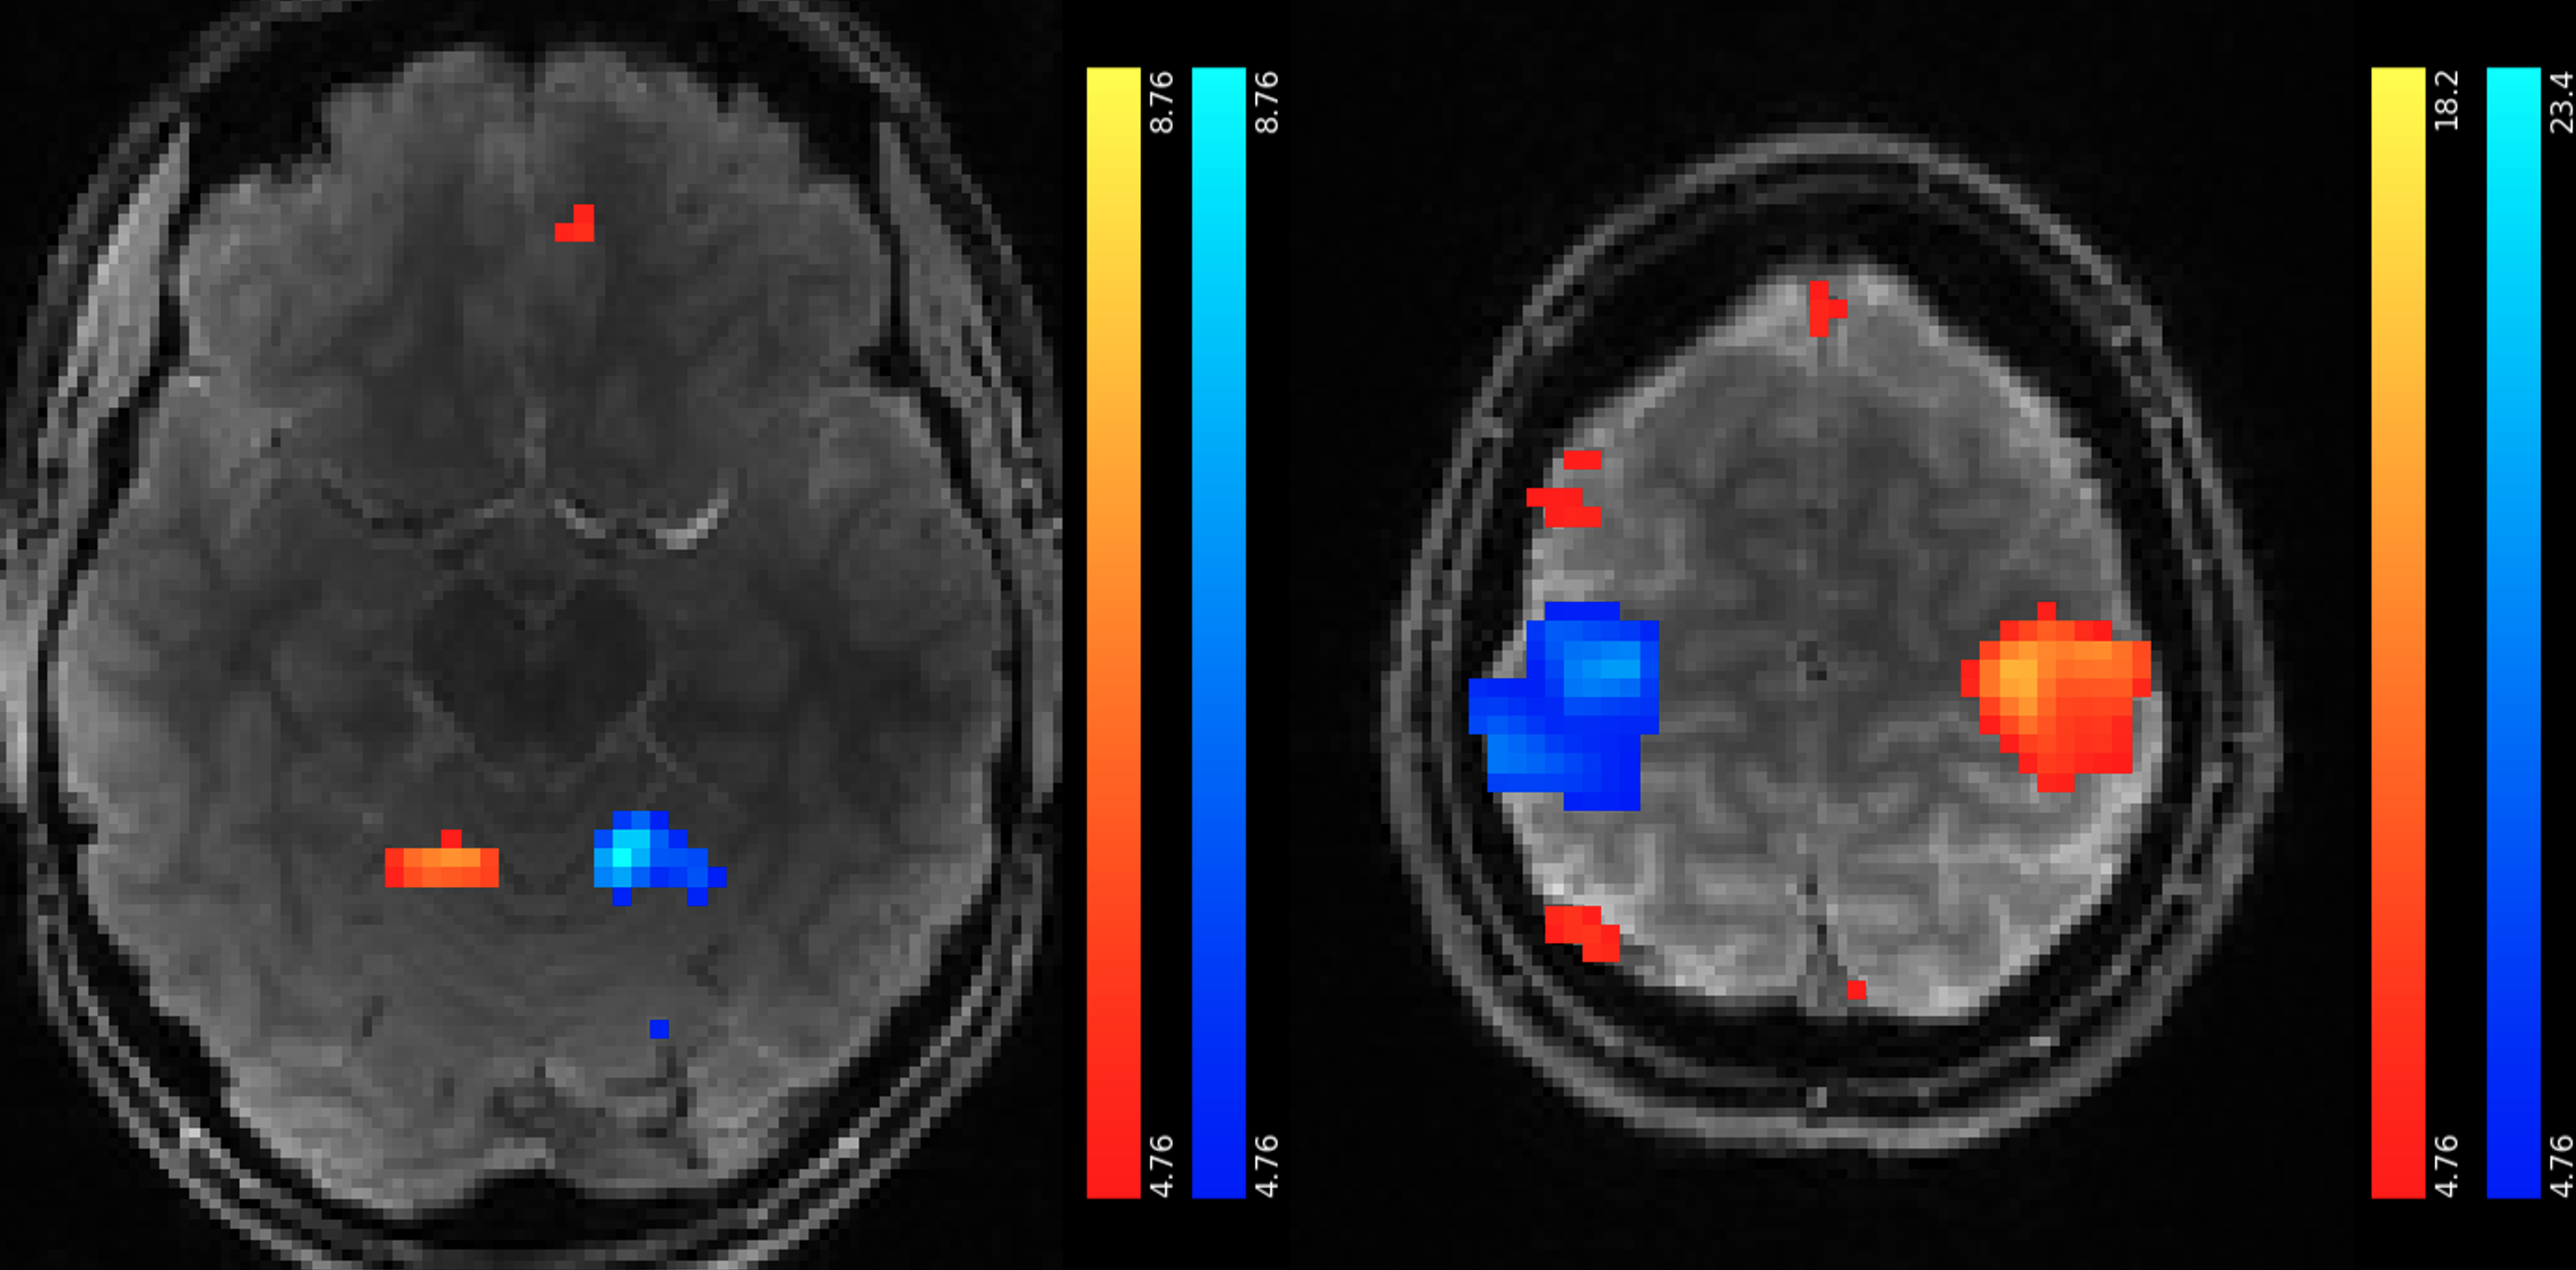
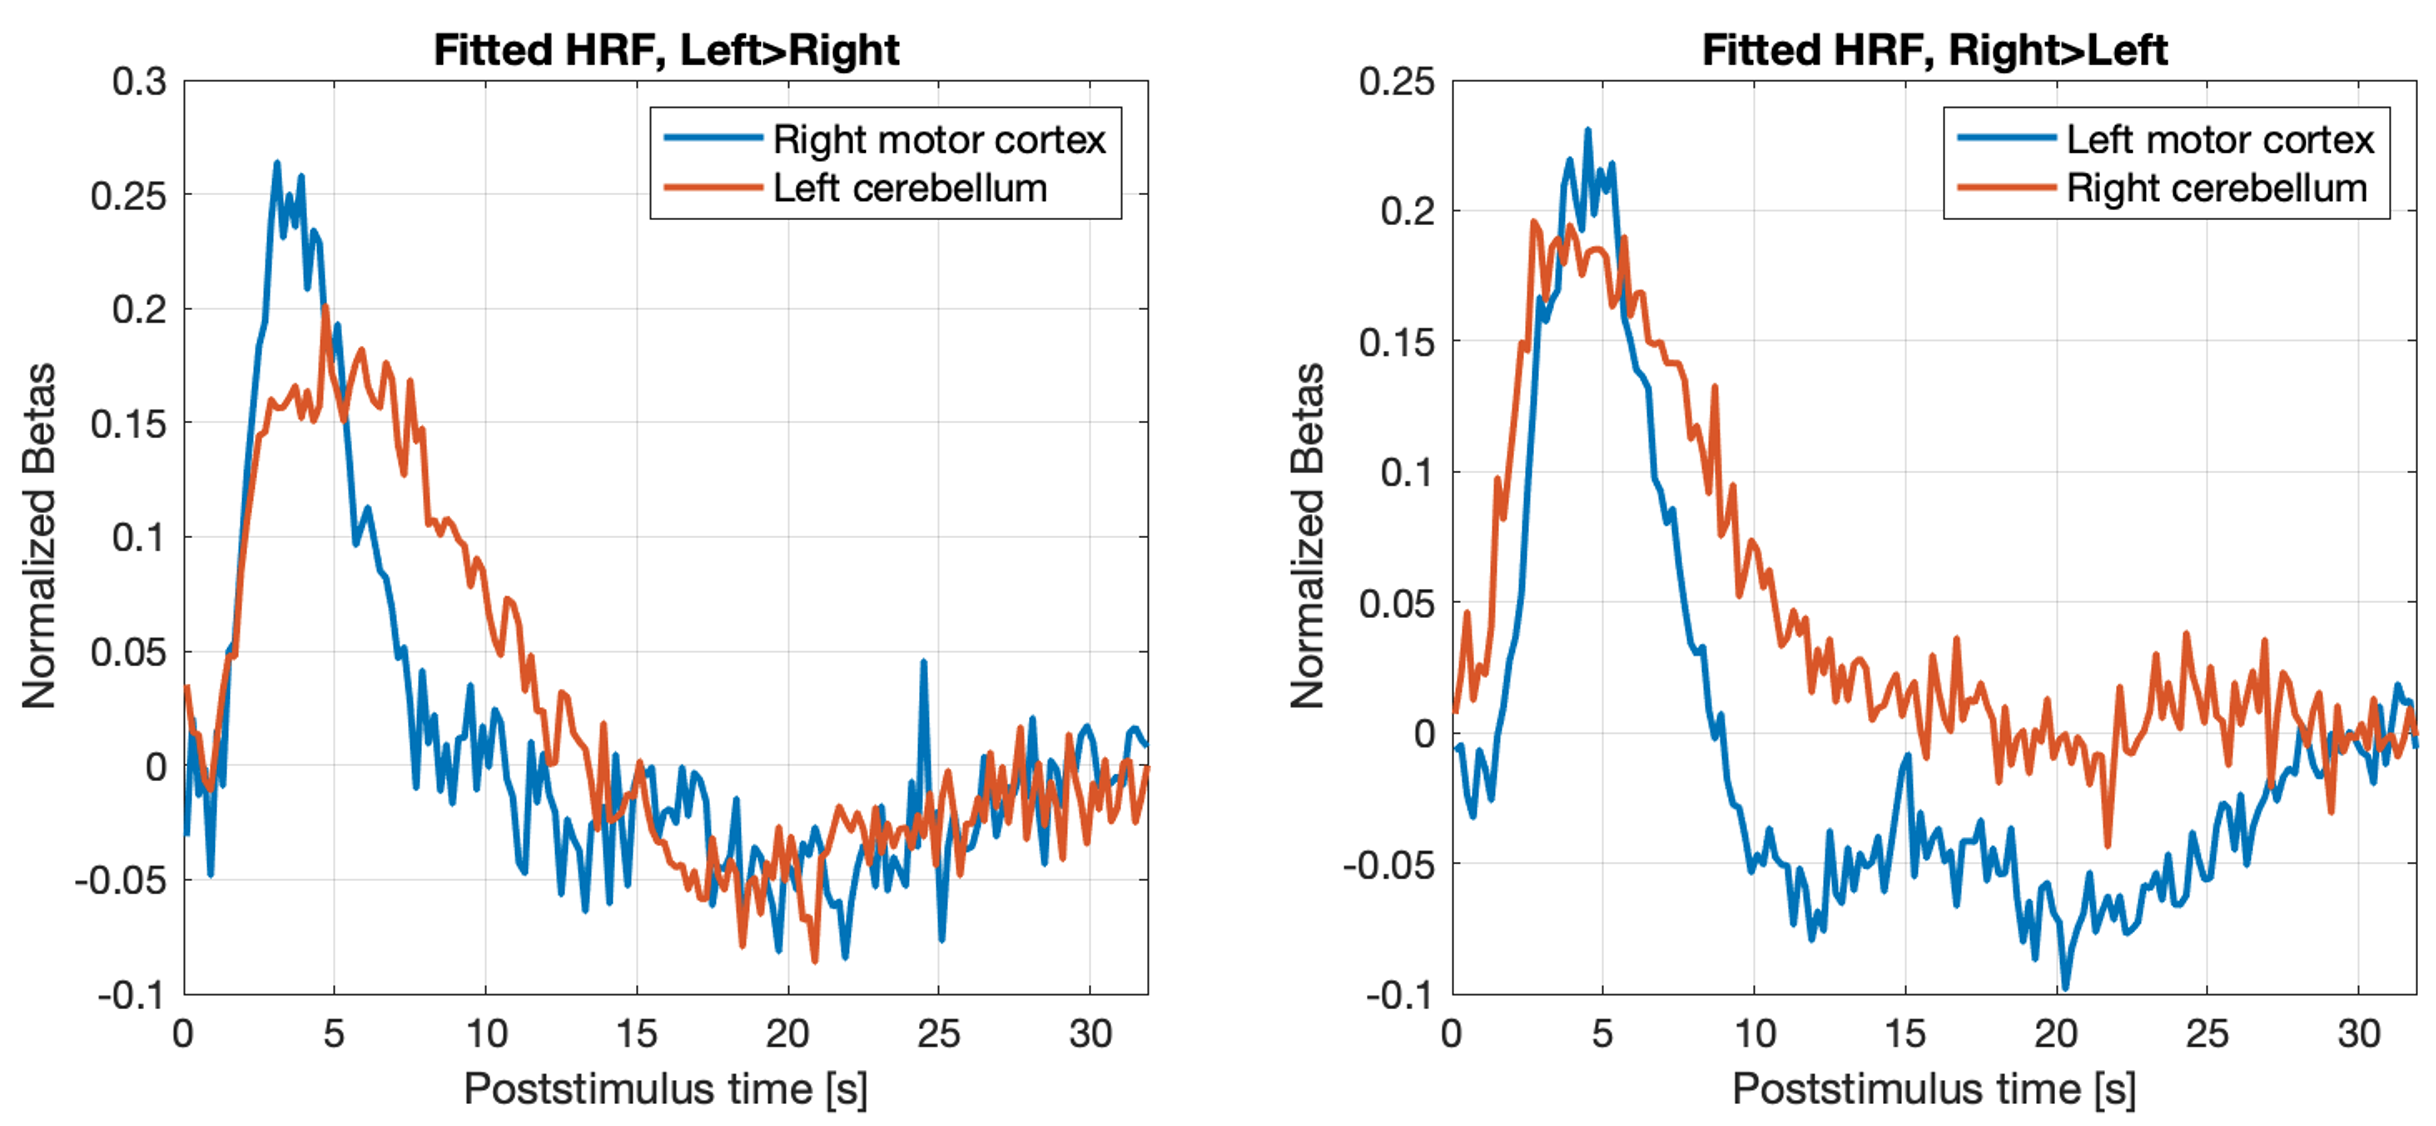
Figure 2 shows the mean magnitude image over all sessions directly after image reconstruction and anti-ringing filtering. Table 1 presents the t-scores for each session individually and all sessions together for t-contrasts Left>Right and Right>Left. A statistical parametric map (for all sessions, FWE corr. p<0.05) superimposed on the structural image is shown in Figure 3. As activity in the contralateral primary motor cortex and the ipsilateral cerebellum can be expected during unilateral hand movements, slices containing these areas are presented. Finally, we used an FIR basis set8 to estimate the HRF of the most active cortical and cerebellar voxels (see Figure 4).Discussion
Fast T-Hex imaging resulted in fMRI images of overall high quality and spatial consistency (see Figure 2). Also, subcortical regions like the cerebellum are accurately depicted. Slight dropouts and B0 artifacts are visible in prefrontal regions and around the air gaps close to the ears.Highly significant activation could be found across all sessions for both contrasts (see Table 1). The strong reduction of significant voxels during session 3 can be explained by strong motion during this session.
As expected, strong activations were found in the contralateral motor cortex and ipsilateral anterior cerebellum (Figure 3).
The FIR-reconstructed HRFs display a consistent onset delay and, in the motor cortex, strongly resembles the canonical HRF. The HRF is wider in the cerebellum which probably contributes to the lower t-scores shown in the left image of Figure 2. It is known that the HRF varies across brain regions9. The onset delay of the HRF is well depicted in all fits.
Both the t-scores and the fitted HRF indicate high BOLD sensitivity and quality of voxel timeseries.
Conclusion
We have successfully demonstrated that 3D T-Hex Spiral-In trajectories are an attractive sequence for rapid fMRI at 7T. Our results indicate high BOLD sensitivity and fidelity of voxel timeseries.Acknowledgements
No acknowledgement found.References
1. Setsompop, K., D.A. Feinberg, and J.R. Polimeni, Rapid brain MRI acquisition techniques at ultra-high fields. NMR Biomed, 2016;29(9):1198-221.
2. Feinberg, D.A., et al., Multiplexed Echo Planar Imaging for Sub-Second Whole Brain FMRI and Fast Diffusion Imaging. PLOS ONE, 2010;5(12):e15710.
3. Engel, M., et al., T-Hex: Tilted hexagonal grids for rapid 3D imaging. Magnetic Resonance in Medicine, 2021;85(5):2507-2523.
4. Engel, M., et al., Whole-brain fMRI at 5 frames per second using T-Hex spiral acquisition. ISMRM 2021, 0886
5. Wilm, B.J., et al., Higher order reconstruction for MRI in the presence of spatiotemporal field perturbations. Magn Reson Med, 2011;65(6):1690-701.
6. Kasper, L., et al., The PhysIO Toolbox for Modeling Physiological Noise in fMRI Data. J Neurosci Methods, 2017;276:56-72.
7. Corbin, N., et al., Accurate modeling of temporal correlations in rapidly sampled fMRI time series. Human Brain Mapping, 2018;39(10):3884-3897.
8. Henson, R., M. Rugg, and K. Friston, The Choice of Basis Functions in event-related fMRI. NeuroImage, 2001;13.
9. Handwerker, D.A., J.M. Ollinger, and M. D'Esposito, Variation of BOLD hemodynamic responses across subjects and brain regions and their effects on statistical analyses. NeuroImage, 2004;21(4):639-1651.
Figures