1096
Why is 7T fMRI in the entorhinal cortex so difficult and what can we do about it?
Nadine N Graedel1, Oliver Warrington1, Barbara Dymerska1, Vahid Malekian1, Oliver Josephs1, Peter Kok1, and Martina F Callaghan1
1Wellcome Centre for Human Neuroimaging, UCL Queen Square Institute of Neurology, University College London, London, United Kingdom
1Wellcome Centre for Human Neuroimaging, UCL Queen Square Institute of Neurology, University College London, London, United Kingdom
Synopsis
Functional MRI in the entorhinal cortex is very challenging due to large and geometrically complex B0 field inhomogeneity. As a result, a quarter of voxels are lost due to T2*-driven dephasing and/or because the echo is pushed outside of the acquisition window. Additionally, off-resonant voxels suffer from poor excitation efficiency with frequency-selective binomial pulse excitation, which are preferred for fat suppression for SAR and time efficiency. We empirically demonstrate substantial signal, and consequently tSNR, gains in off-resonance regions by reducing binomial pulse order (from 1-3-3-1 to 1-2-1 or 1-1) that match numerical predictions.
Introduction
The entorhinal cortex (EC) is a small brain structure located in the medial temporal lobe (Fig.1) below the hippocampus. It interfaces between the hippocampus and cortex playing an important role in memory formation and consolidation1,2. Performing cortical depth-dependent (laminar) fMRI in the EC has potential to provide valuable insights into the EC-hippocampus-cortex network, e.g. in visual perception. However, the EC is plagued by high levels of artefact, particularly signal loss. We investigated the underlying causes of dropout in the EC and how this is affected by excitation (specifically binomial pulse order).Theory
Signal, $$$S= S_0 e^{-t⁄T_2^*}$$$, on gradient-echo 3DEPI images is low in the EC (Fig.1). Mitigation strategies depend on the underlying reason for low signal. We therefore explored the following potential factors:- Intra-voxel B0 inhomogeneity: shortens T2' and therefore T2*
- B0 inhomogeneity interacting with the EPI readout: results in spatially varying TE and complete dropout when the echo forms outside the k-space acquisition window3
- Transmit field (B1+) inhomogeneity: results in non-ideal excitation (lowers S0)
- B0 offset: lowers excitation efficiency (lowers S0) when using frequency-selective (“water excitation”) binomial pulses
Spatial resolution and angulation could be manipulated to mitigate points 1,2 above, but are typically dictated by the research question, especially when studying multiple regions (e.g. EC-hippocampus-V1), and by temporal resolution requirements. Changes to the excitation (mitigating points 3,4) can be implemented relatively easily. We typically use a binomial 1-3-3-1 pulse train for efficient water-selective excitation and fat-suppression. Here we explored lowering the binomial pulse order (to 1-2-1 or 1-1) to increase signal in the EC by increasing the width of the excitation’s pass-band at the cost of narrowing the stop-band (Fig.3).
Methods
One healthy volunteer was scanned at 7T. We acquired three 226-second runs of 0.92mm 3DEPI (acceleration=4x2, in-plane segmentation4 factor=2 to reduce distortions, Partial Fourier(early) = 6/8, TE/TR=18/40ms, flip angle=13°, echo spacing=1.2ms, matrix size=208x208x88, posterior-anterior phase-encoding direction). The acquisitions used either 1-3-3-1, 1-2-1 or 1-1 binomial excitation pulses with an inter-pulse spacing of 1500μs. Data were also collected to provide an anatomical reference (0.65mm MP2RAGE) and map B1+ (Bloch-Siegert 4mm), T2* and B0 (multi-echo FLASH: 0.9mm, 8 echoes, TE1=2.52ms, ΔTE=2.52ms). Combining the B0 map and readout parameters, we calculated a local TE map3 and determined if the echo is sampled.From the 3DEPI time-series mean functional images and tSNR were calculated. We evaluated B0, T2*, local TE and B1+ in EC, V1, Hippocampus and Orbitofrontal cortex (OFC) ROIs.
The excitation efficiency of binomial pulses was simulated (as a series of hard pulses) over a range of frequencies and inter-pulse periods. For comparisons with experimental data noise (SNR≈30) was added to the simulated excitation efficiency. Following frequency-specific smoothing, maps of signal gain were computed as the ratio of the signal from 1-2-1 or 1-1 excitations to that of 1-3-3-1 and compared to B0.
Results
The EC contains a broad range of B0 offsets (Fig.2, Median frequency=-116Hz, IQR=189Hz) encompassing both positive and negative frequencies. The off-resonance is larger compared to other regions such as V1, Hippocampus and even the notoriously difficult-to-image OFC (Median=62Hz, IQR=154Hz). T2* mapping indicated that parts of the EC suffer from short T2*: 22% of voxels have T2*<10ms and can be considered completely dephased at TE=18ms. The strong local field gradients lead to variable local TE, with positive and negative shifts. 27% of voxels in the EC suffered complete dropout because the echo was outside the acquisition window. 36% of voxels were lost to the combination of these two factors (the overlap is due to both being driven by the local field gradients). The B1+ in the EC is homogeneous and close to target efficiency and therefore not considered a driving factor for low EC signal levels.Binomial pulse order dictates the frequency response of the excitation (Fig.3). Whole-brain analysis showed good qualitative correspondence between simulation and experiment as pulse order changes (Fig.4). As predicted, signal gains occurred as off-resonance increases, especially in the range 100-300Hz, and subsequently decrease.
In the EC we observed the same pattern with improvements for off-resonant voxels (Fig.5). The improved excitation translated into improved tSNR for the 1-1 excitation (median tSNR=10.0, IQR=8.2) compared to 1-3-3-1 (median tSNR=7.0, IQR=8.2).
Discussion
The large and geometrically complex local distortion of the B0 field makes fMRI of the EC very challenging. Reducing the binomial pulse order to 1-2-1 or even 1-1 is a simple and effective strategy to boost signal in off-resonance regions but comes at the cost of reduced fat suppression. No fat artefact was visible in these data but was occasionally seen in other volunteers and protocols (data not shown).Even after improvement with the 1-1 pulse the tSNR in the EC remains low, with a substantial number of voxels (almost) completely dephased. The large spread of B0 values (including both positive and negative frequency offsets/gradients) makes mitigation challenging. For many strategies, such as shortening nominal TE, we would expect to gain in some areas of the EC but lose in others. Further development is needed to make EC fMRI at 7T robust. Due to the lower field inhomogeneity, 3T fMRI may compete with 7T fMRI for the EC, especially if combined with an SNR-enhancing technique, e.g. NORDIC5.
Acknowledgements
The Wellcome Centre for Human Neuroimaging is supported by core funding from the Wellcome [203147/Z/16/Z].References
1. Staresina, B.P., Reber, T.P., Niediek, J. et al. Recollection in the human hippocampal-entorhinal cell circuitry. Nat Commun 10, 1503 (2019)2. Koster, Raphael et al. Big-Loop Recurrence within the Hippocampal System Supports Integration of Information across Episodes. Neuron vol. 99,6 (2018): 1342-1354.e6.
3. Dymerska, Barbara et al. The Impact of Echo Time Shifts and Temporal Signal Fluctuations on BOLD Sensitivity in Presurgical Planning at 7 T. Investigative radiology vol. 54,6 (2019): 340-348.
4. Stirnberg, R, Stöcker, T. Segmented K-space blipped-controlled aliasing in parallel imaging for high spatiotemporal resolution EPI. Magn Reson Med. 2020; 85: 1540-1551.
5. Moeller, Steen et al. NOise reduction with DIstribution Corrected (NORDIC) PCA in dMRI with complex-valued parameter-free locally low-rank processing. NeuroImage. 2021; 226: 1053– 8119.
Figures
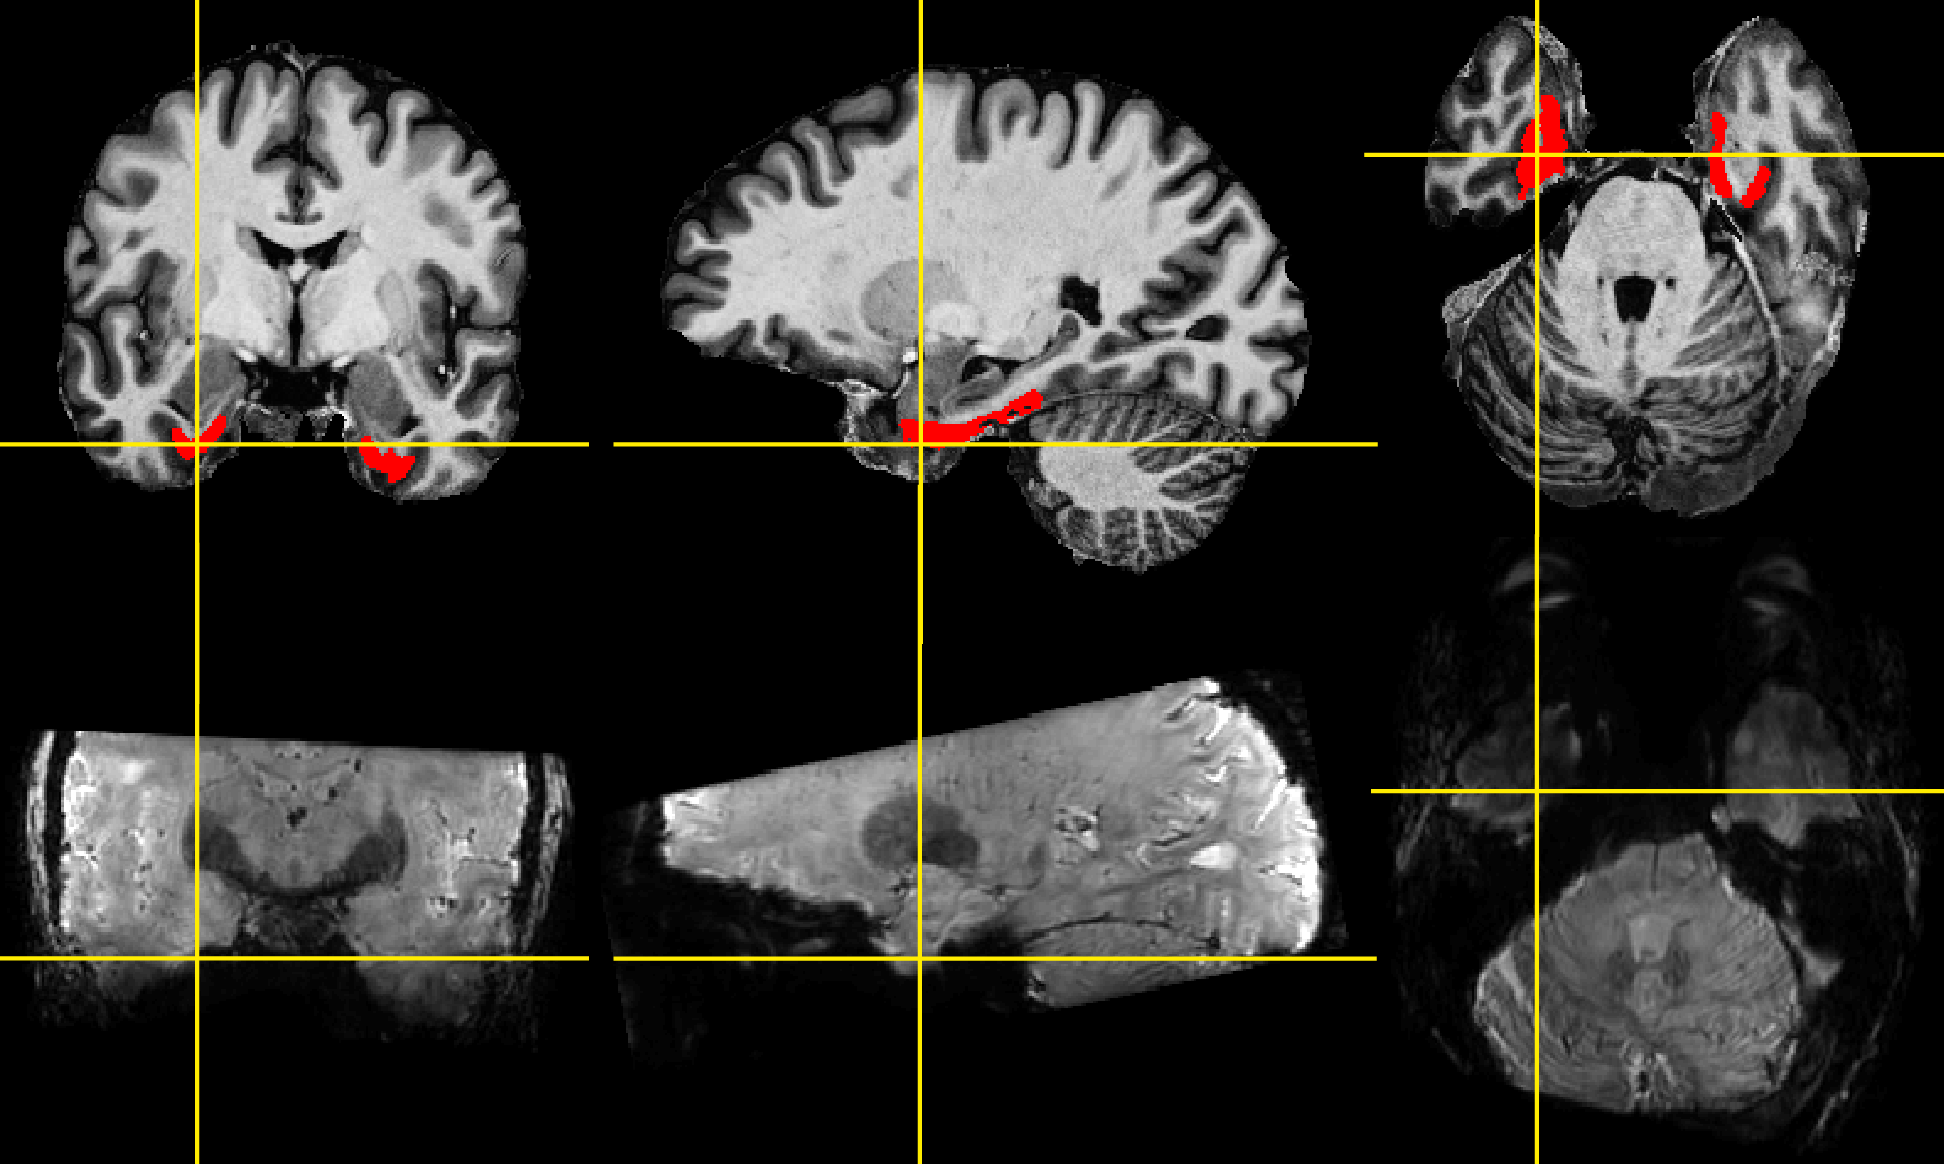
Fig 1: Entorhinal cortex (red ROI) overlaid on the participant’s MP2RAGE image (top) and corresponding 3DEPI image with 0.92 mm resolution and 1-3-3-1 binomial pulse (bottom).
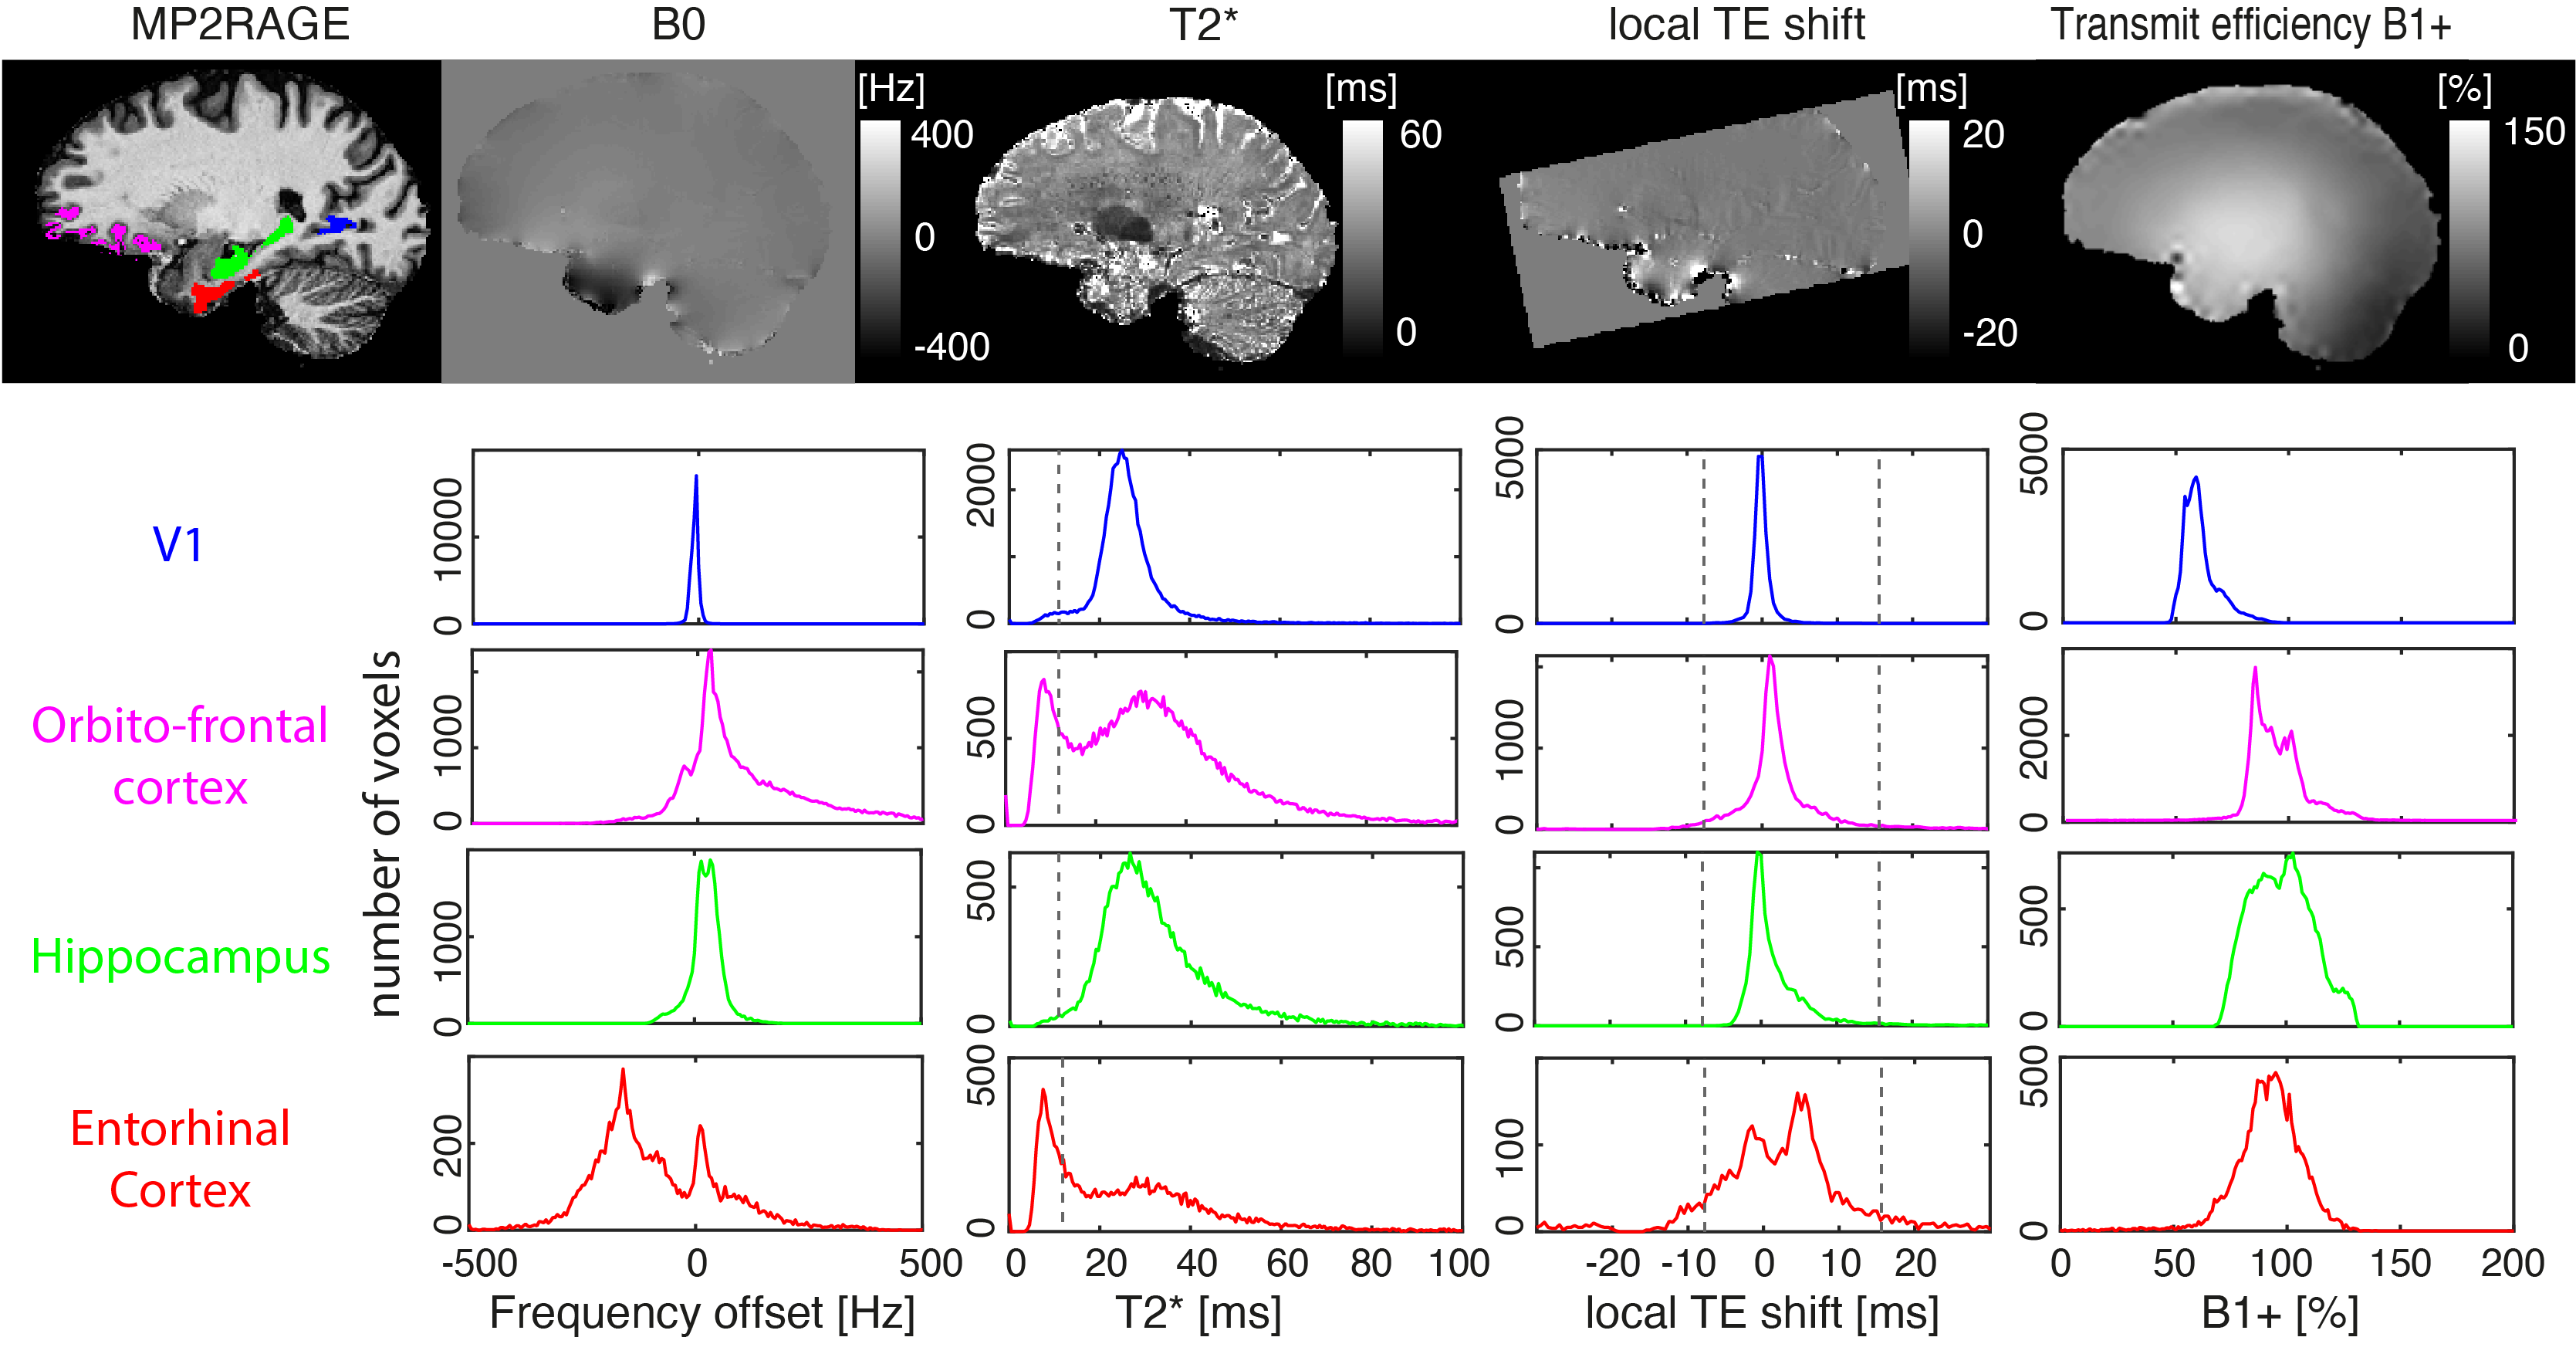
Fig 2: B0 field, T2*, local TE shift and B1+ for four ROIs. Histograms of these quantities are displayed for V1 (a typically unproblematic region), OFC and Hippocampus (which are generally considered challenging) and the entorhinal cortex (EC) which is the primary target of this investigation. Vertical dashed lines in the local TE shift histogram indicate the values at which complete signal loss occurs because the echo is not sampled in k-space. Vertical dashed line in T2* plots indicates T2*=10ms, the threshold used to characterise fully dephased voxels.
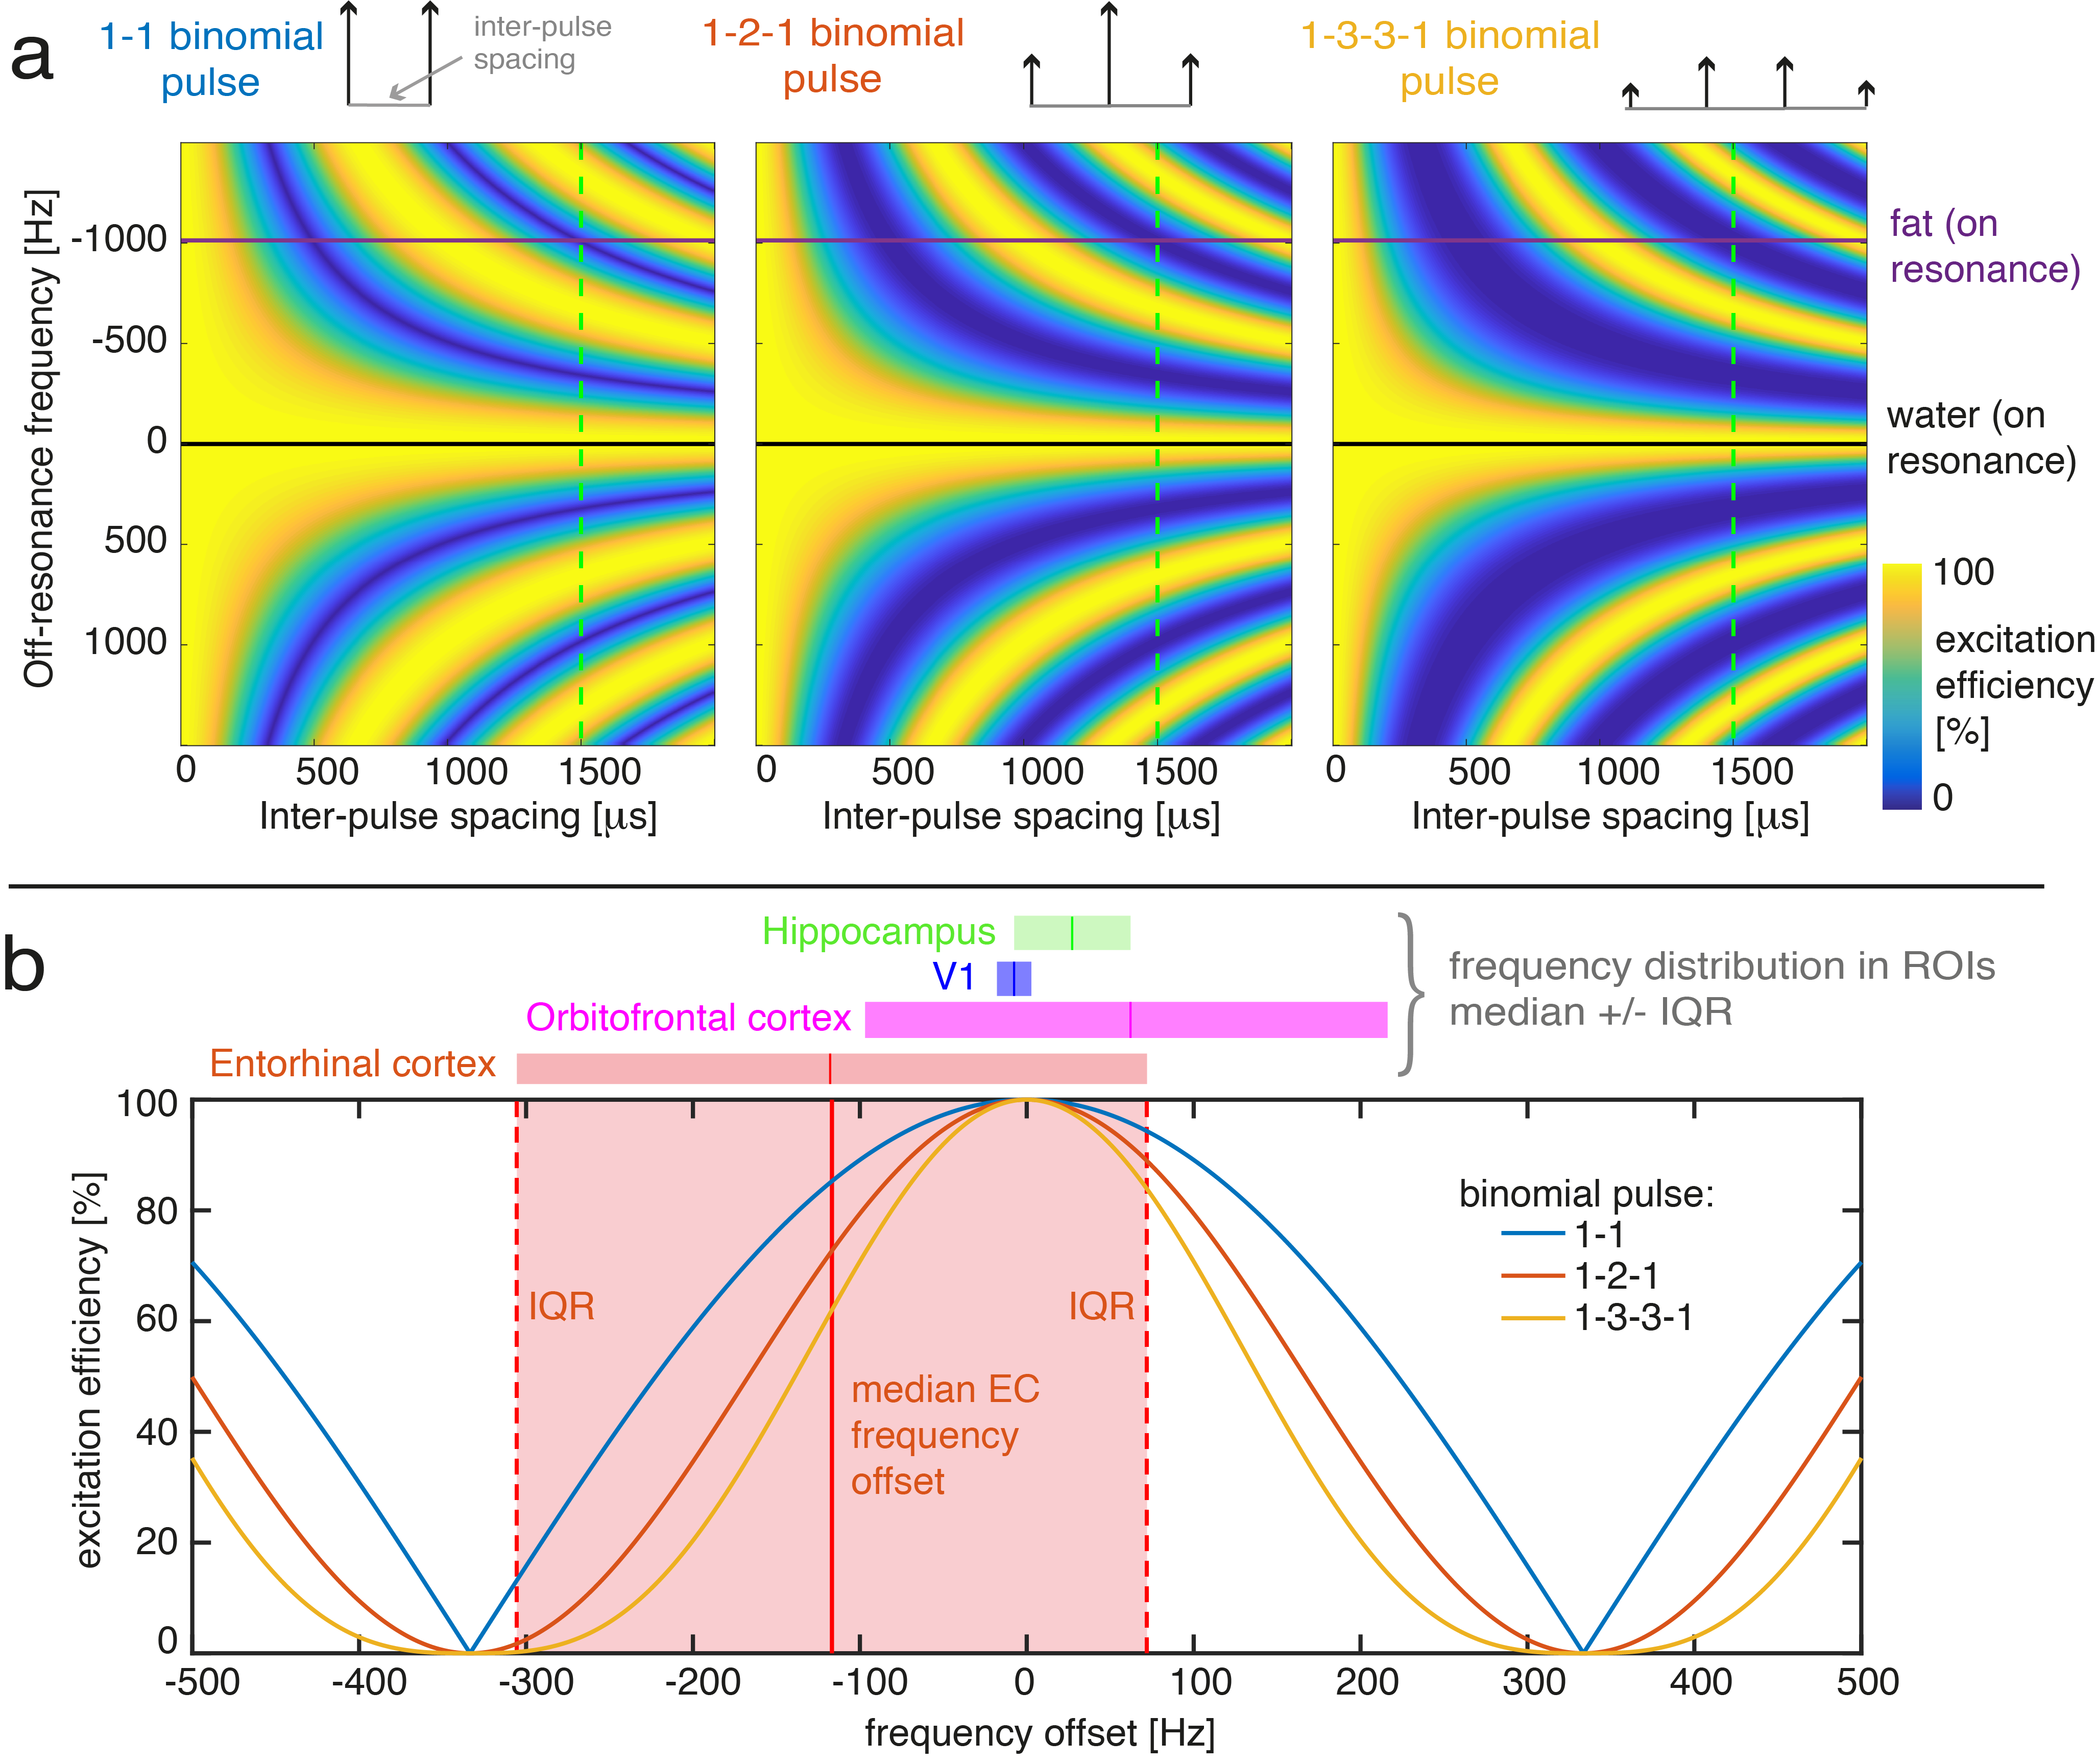
Fig 3: Simulation of excitation efficiency of binomial pulses (a) as a function of frequency and inter-pulse spacing for 1-1, 1-2-1 and 1-3-3-1. The horizontal lines at 0Hz (black) and 1kHz (purple) indicate on-resonance for water and fat respectively. All experiments used an inter-pulse spacing of 1500μs (green dashed vertical lines) to supress fat (blue) while exciting water (yellow). (b) Line plots of excitation efficiency for inter-pulse spacing=1500μs and frequency offset=[-500,500]. Coloured bars indicate the range of frequencies within the ROIs (median +/- IQR).
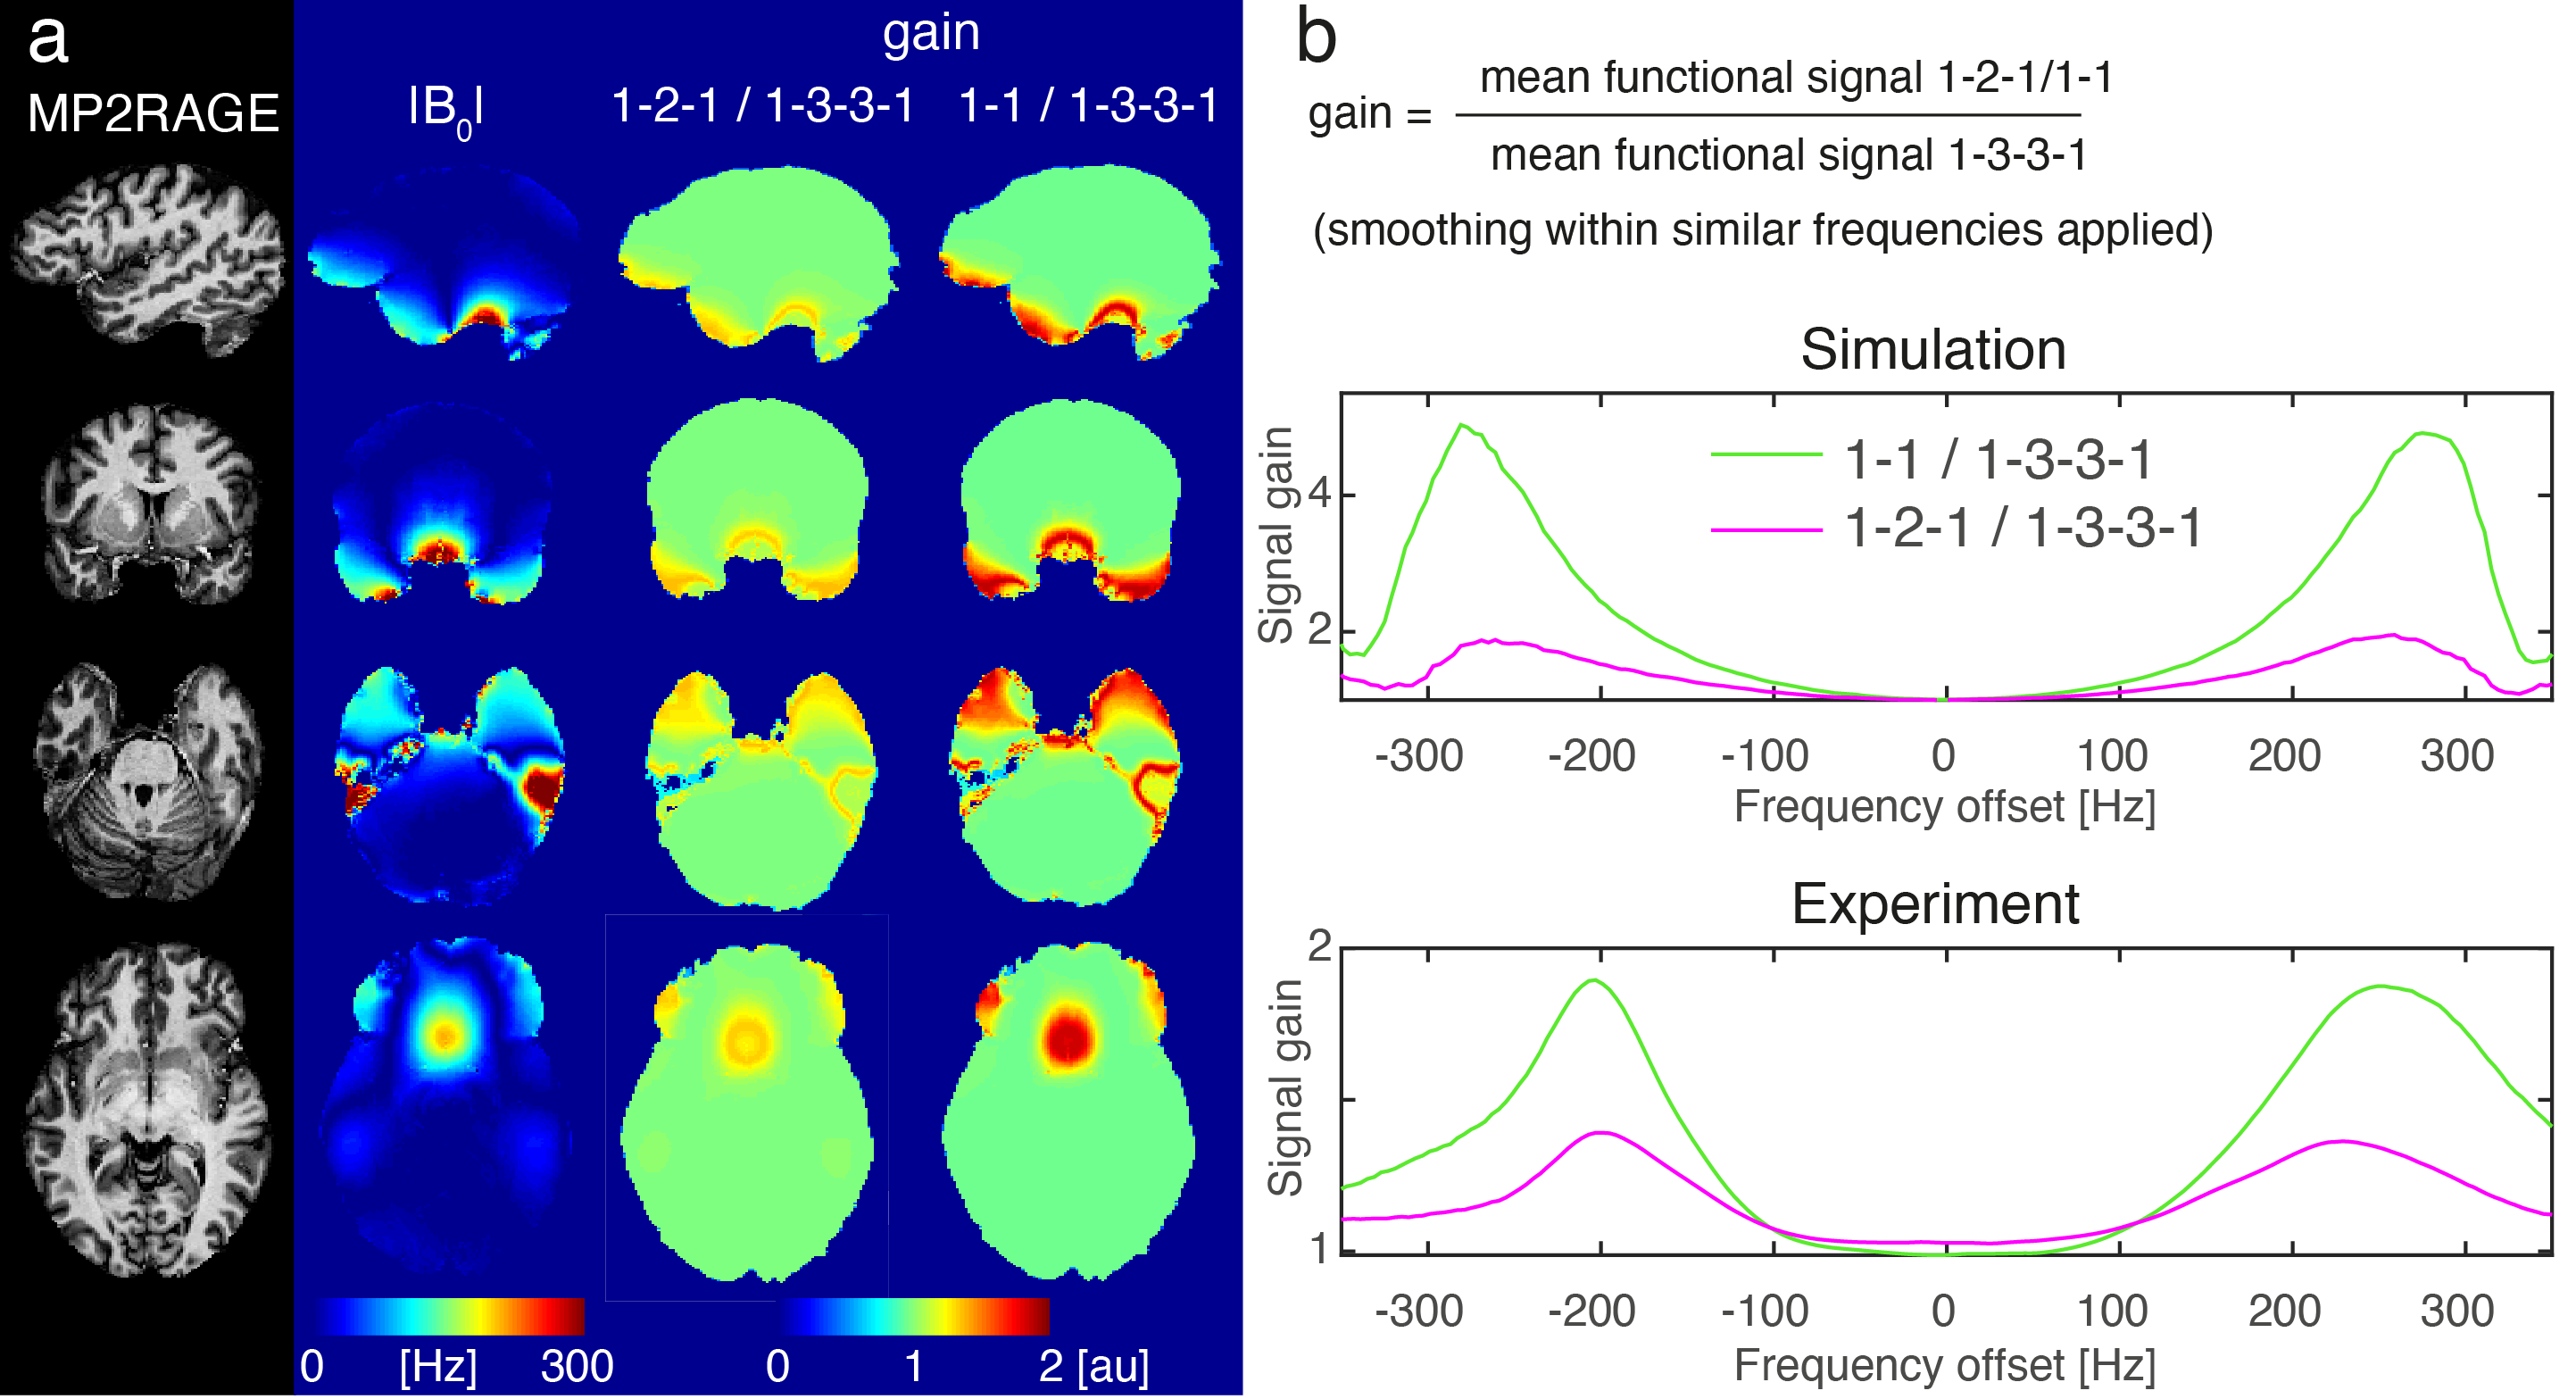
Fig 4: Whole brain results: (a) Maps of absolute B0 offset and empirical signal gain going from 1-3-3-1 to 1-2-1 or 1-1. (b) Comparison of simulated (top) and experimental signal gain (bottom) over a range of frequencies. The shape of the gain profile matches well. Note that in the simulation the gain level depends on the amount of noise added, which may underlie the discrepancy in absolute values.
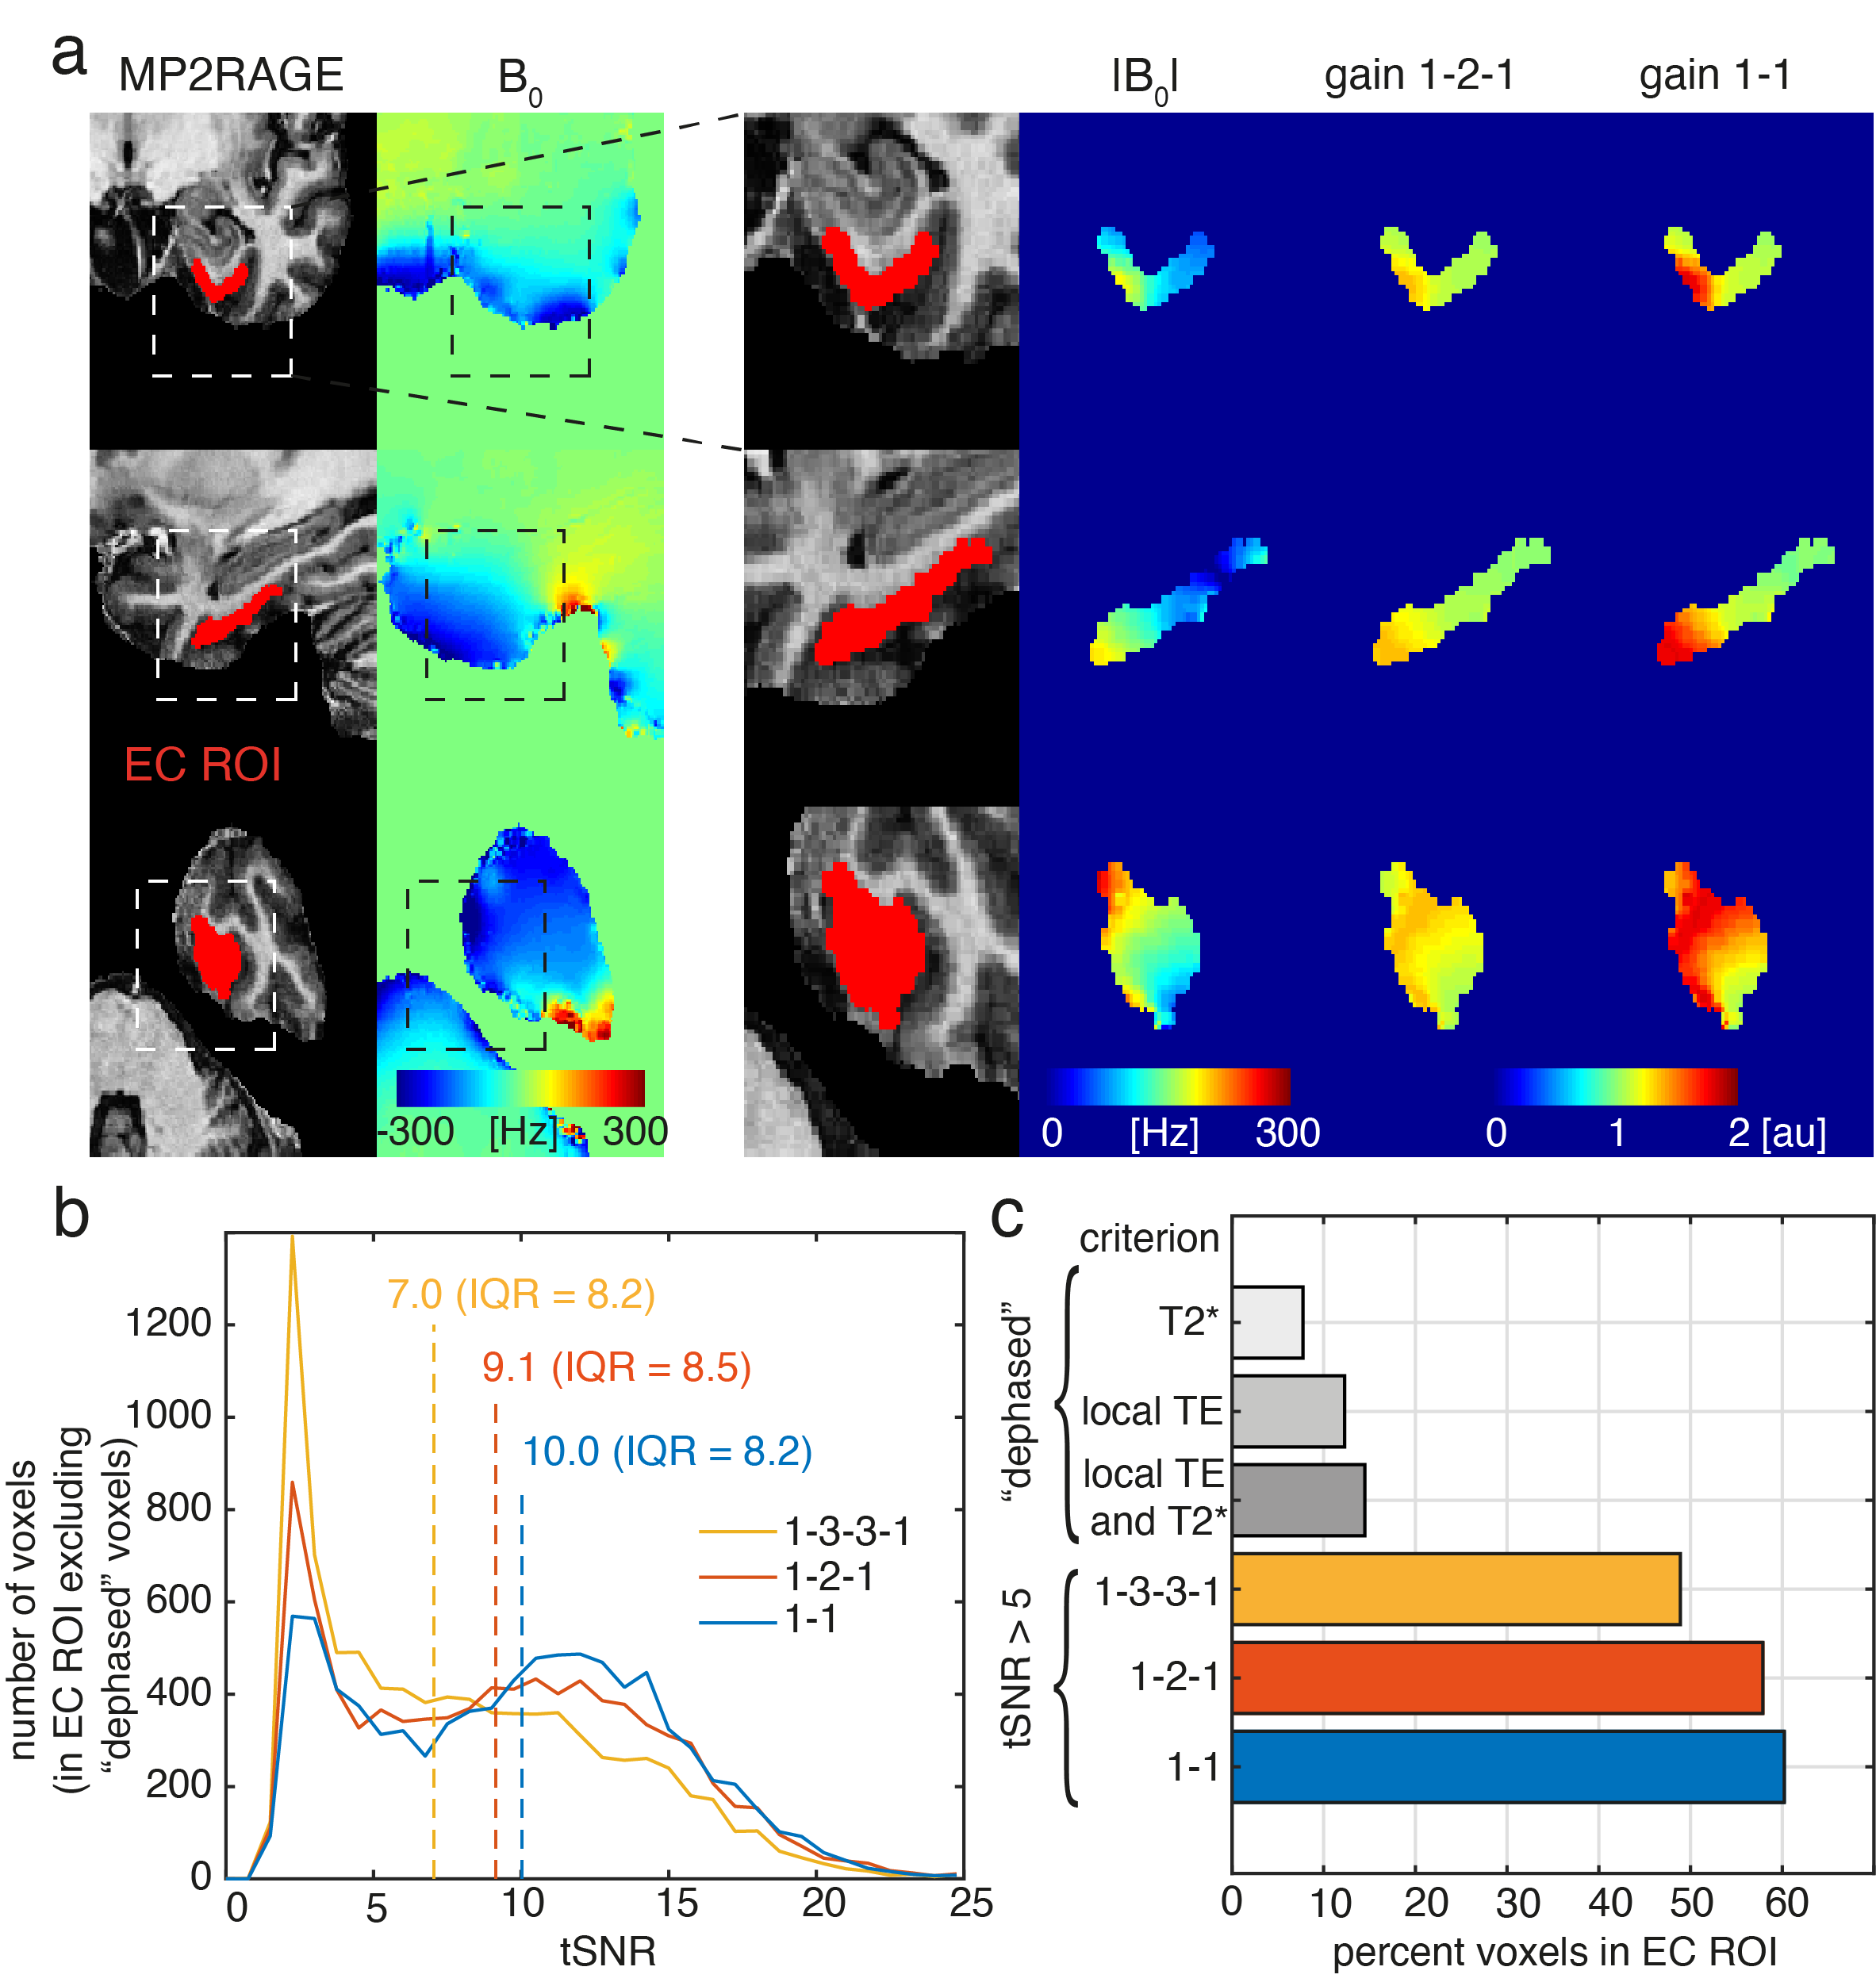
Fig 5: Entorhinal cortex results:
(a) Good correspondence between absolute B0 offsets and signal gain for 1-2-1
and 1-1 pulses (compared to 1-3-3-1). (b) tSNR
histogram of EC voxels (excluding dephased voxels) for 1-3-3-1/1-2-1/1-1 data
sets. Dashed lines indicate median tSNR values. (c) Percentage of EC voxels with tSNR > 5 for the three pulses and percentage of voxels dephased based on T2* only, local TE only or the two combined.
DOI: https://doi.org/10.58530/2022/1096