1093
Application of Haralick Texture Analysis to Differentiate Suspicious Prostate Lesions from Normative Tissue on Low-field MRI
Dang Bich Thuy Le1, Ram Narayanan1, Meredith Sadinski1, Kathryn Nicholas2, Aleksandar Nacev1, Dinesh Kumar1, and Srirama Venkataraman1
1Promaxo, Oakland, CA, United States, 2Lakeland Radiologists PA, Jackson, MS, United States
1Promaxo, Oakland, CA, United States, 2Lakeland Radiologists PA, Jackson, MS, United States
Synopsis
Haralick texture features extract frequencies of local spatial variations in signal intensity, quantifying pixel relationships within regions of interest. In this study, Haralick texture features were used to differentiate biopsy-proven, cancerous lesions from non-suspicious regions in low-field MR images. The results demonstrate consistency in texture measures for cancerous regions compared to non-suspicious, where Energy and Homogeneity are elevated while Contrast and Correlation are reduced within cancerous regions compared to non-suspicious regions.
Introduction
Prostate cancer is the second most commonly diagnosed cancer, and fourth leading cause of cancer mortality in men1. Identifying suspicious regions accurately for acquiring a biopsy is essential for accurate diagnosis, and timely and effective treatment. Haralick texture analysis of prostate MRIs have been studied for cancer detection on T2-weighted, 3T images showing promise for prostate cancer detection2. Promaxo, low-field, MRI system is an office-based, open single-sided scanner, operating at low, non-uniform B0 field (58-74mT) with non-linear x- and y-axis gradients and a permanent, built-in z-gradient. The system is FDA-cleared for guiding prostate biopsy interventions. The purpose of this study is to assess feasibility of distinguishing cancerous regions in the prostate from normal tissue by applying Haralick texture analysis to low field, T2-weighted images.Methods
The analysis includes 4 patients suspected of prostate cancer due to an elevated PSA score who underwent mpMRI on a 3T MRI (Philips Healthcare, Amsterdam, NL). Suspicious regions of interest (ROI) were annotated on corresponding 3T, T2-weighted images by a radiologist and assigned a PI-RADS score. Patients subsequently underwent an IRB approved transperineal biopsy with the guidance of low-field (58-74mT) (Promaxo Inc, Oakland, CA) prostate MR images. Following histopathologic analysis, biopsied lesions with Gleason Score 4+3 and higher were identified along with the corresponding, manually registered 3T and low-field, T2-weighted image slices. 3T and low-field MRI volumes were rigidly registered to ensure texture features were calculated at the same regions on both high-field and low-field images. The radiologist-performed annotations were propagated from the 3T image to the co-registered, low-field image. For each cancerous ROI, a secondary ROI of identical size was drawn on the same slice in a clinically non-suspicous region of the prostate presumed to be normal tissue.For both 3T and low-field datasets, images were normalized and rescaled to intensity of 0-63 gray levels. If multiple cores were collected for a single ROI with discordant results then portions of the ROIs which were negative for prostate cancer on biopsy were excluded. For each ROI, the grey level co-occurrence matrix (GLCM) was computed in 8 directions on transverse, 2D slices. In total, 6 image slices from 4 patients were analyzed with one patient presenting more than one lesion.
Haralick texture features are correlated with each other. They are divided into 3 groups that are independent of each other. The Contrast group includes Contrast, Dissimilarity, Homogeneity, using weights related to the distance from the GLCM diagonal. Orderliness group measures how often a given pair of two grey levels occur within a window. Orderliness features include Angular Second Moment (ASM), Energy, Maximum Probability, and Entropy. Descriptive statistics group includes GLCM Mean, Variance, and Correlation3, 4. We limited our analysis to Energy, Correlation, Contrast, and Homogeneity based on prior literature identifying them as useful for distinguishing cancer by outcomes2.
Two methods of calculating texture features were implemented. The first is to extract Haralick texture measures within respective ROIs (cancerous and non-suspicious regions) (method 1). The second is to create four texture maps (Contrast, Energy, Correlation and Homogeneity) to assess the pixel-to-pixel relationship in cancerous and non-suspicious regions by calculating texture measures within a local neighborhood using a sliding window technique over the entire prostate region of the image then averaging the values of the resulting texture maps in cancerous and non-suspicious ROIs (method 2).
Results
Figure. 1 shows a 3T, T2-weighted image registered on the low-field image. The biopsy-proven, cancerous lesion was marked (red) on axial slices of 3T, T2-weighted image. A non-suspicious region with the same radius was marked (green) for texture feature comparison.Tables in Figure. 2 show texture features for each ROI. When evaluating features within ROIs from the same patient for cancerous and non-suspicious regions, Contrast and Correlation values were lower, while Energy and Homogeneity values were higher in cancerous regions than in non-suspicious regions. These findings are consistent with those reported on high-field (3T) images.
Discussion
The power of Haralick features as a discriminator between cancer and clinically normative regions appear to extend to low-field images. This result is consistent over the small cohort of patients tested in this feasibility study. The predictive power of these features will be studied further and validated as more data is collected.Conclusion
In this feasibility study, Haralick texture features were computed on a small sample of low-field MRI images to test its applicability in distinguishing clinically suspicious regions of the prostate from normal tissue on low-field, low-resolution T2-weighted images. Although interpatient variability of features will need to be assessed with a larger cohort, we have demonstrated consistent intrapatient trends in four texture features between non-suspicious and cancerous regions of the prostate in this preliminary cohort. More images are being acquired in our clinical study to validate a broader pool of patients.Acknowledgements
No acknowledgement found.References
- H. Sung, J. Ferlay, R.L. Siegel, M. Laversanne, I. Soerjomataram, A. Jemal, F. BrayGlobal cancer statistics 2020: GLOBOCAN estimates of incidence and mortality worldwide for 36 cancers in 185 countries CA Cancer J. Clin., 71 (2021), pp. 209-249.
- Wibmer A, Hricak H, Gondo T, et al. Haralick texture analysis of prostate MRI:utility for differentiating non-cancerous prostate from prostate cancer and differentiating prostate cancers with different Gleason scores. Eur Radiol 2015;25(10):2840–2850
- Haralick RM, Shanmuga K, Dinstein I. Textural Features for Image Classification. Ieee Transactions on Systems Man and Cybernetics Smc. 1973; 3:610–621
- Hall-Beyer, M., 2017a. GLCM Texture: A Tutorial v. 3.0 March 2017. Available at https://prism.ucalgary.ca/handle/1880/51900 (Online; accessed 14-March-2018).
Figures
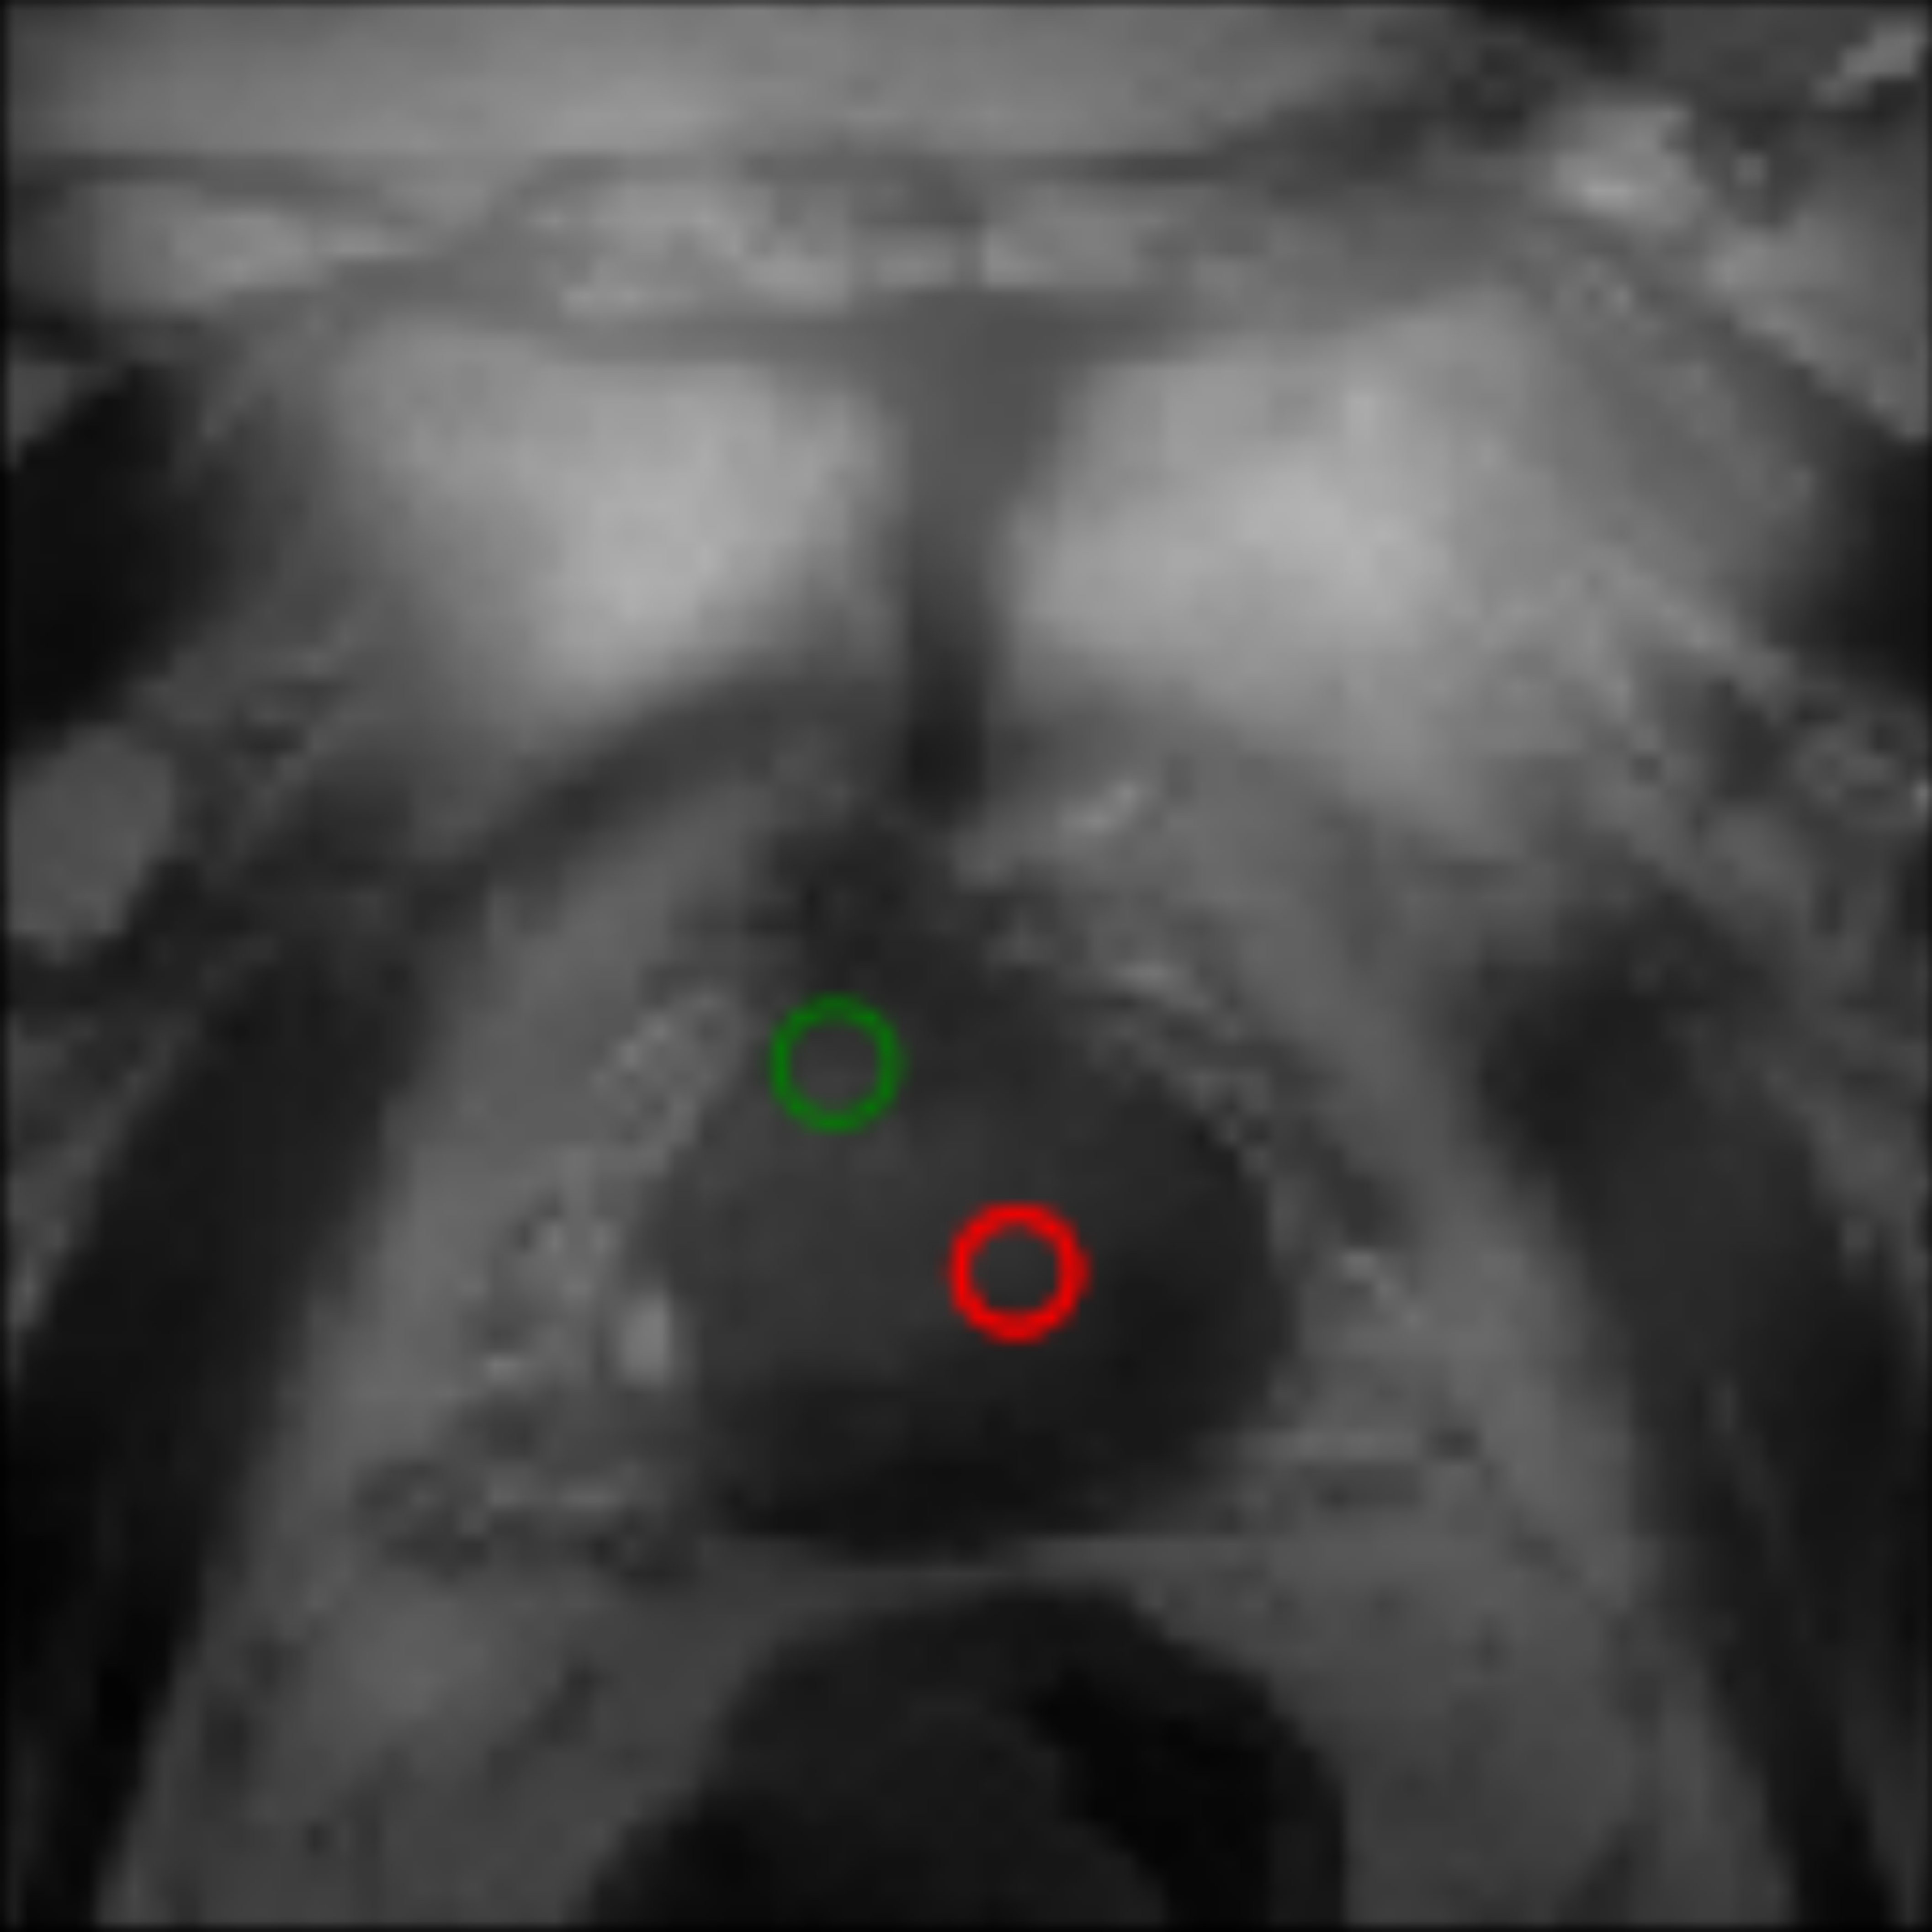
Figure 1. Co-registered T2-weighted images of 3T and low-field MR of a 77 years old male with a Gleason score 4+5 prostate cancer. The biopsy-proven, cancerous lesion (red) and a non-suspicious region with the same radius (green) were marked.

Figure 2. Haralick texture measures calculated using each method for 3T (a) and low-field (b) MR images for cancerous and non-suspicious ROIs. Method 1: Extract Haralick texture measures within respective ROIs. Method 2: Create four texture maps (Contrast, Energy, Correlation and Homogeneity) by calculating texture measures within a local neighborhood using a sliding window technique over the entire prostate region of the image then averaging the values of the resulting texture maps in respective ROIs.
DOI: https://doi.org/10.58530/2022/1093