1089
A multi-directional laser ablation device for 3D conformational ablation guided by real-time volumetric MR-thermometry1UMR5536 CRMSB, Université de Bordeaux, Bordeaux, France, 2Certis Therapeutics, Pessac, France, 3IHU Liryc, Electrophysiology and Heart Modeling Institute, Hopital Xavier Arnozan, Pessac, France, 4ALPhANOV, Talence, France, 5Centre de Recherche Cardio-Thoracique de Bordeaux, U1045, University of Bordeaux, Bordeaux, France, 6INSERM, Centre de Recherche Cardio-Thoracique de Bordeaux, U1045, Bordeaux, France
Synopsis
We present here a new laser device allowing us to induce local temperature increase in several directions around the inserted probe to create conformational thermal ablation. The device incorporates 6 independent emitters illuminating several angles radially to the probe. We illustrate the capabilities of the device to create various heating shapes that can be visualized by real-time 2D multi-slice MR-thermometry.
Introduction
Thermal ablative techniques are commonly used as alternatives to traditional resectional surgery allowing less pain and shorter recovery time. Laser Interstitial Thermal Therapy (LITT) is intrinsically MRI-compatible and light can be emitted to tissue via an inserted small fiber to target deep-lying organs. Current LITT devices are mainly used to treat cerebral [1] or urology diseases [2], and are usually composed of one laser fiber incorporating a diffuser tip at its distal end to create a heating volume with a symmetry of revolution. This limits the ability to create a conformal treatment with a more complex shape than an ellipsoid and requires very precise positioning of the device at the center of the targeted area [3]. The purpose of this work is to present a new prototype of MRI-compatible LITT integrating a multi-probe laser unit to create thermal ablations of various shapes. The device is presented and several heating patterns are produced and monitored by real-time 2D multi-slice MRI thermometry.Material & Methods
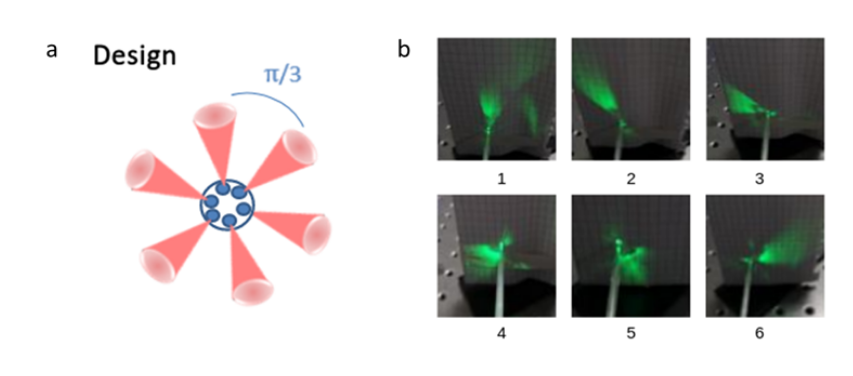
Laser device: The laser device presented in Figure 1a was specifically developed for this study (ALPhANOV, Talence, France). It consists of a fully integrated laser diodes module comprising six laser diodes emitting at a wavelength of 976 nm and a maximum average power of 9 W, optic fibers, and a dedicated electronic board to drive the pump power and the emission duration of each channel independently. The probe consists of a homemade fiber bundle composed by 6 multimode fibers (200 µm of core diameter) which were arranged circularly. The tip which has a total diameter of 2 mm over a length of few centimeters was shaped to ensure radial propagation of the individual laser beams in a different direction (approximately 60° each, distributed over 360°).Qualitative characterization of the tip of the device: Light beams were visualized for each fiber output by connecting a 532 nm laser diode (green light, visible domain) and taking a photograph of the result.
Real-time MRI thermometry pipeline: The laser probe was inserted horizontally into a gelatin gel. 10 slices of a single shot echo planar imaging sequence [4] positioned perpendicular to the laser tip were acquired every 2 seconds on a 1.5 T clinical scanner (Avanto, Siemens Healthcare) with the following parameters: TE=18 ms, FOV=180x180 mm2, 3 mm slice thickness (resulting spatial resolution of 1.4x1.4x3 mm3), FA = 60°, GRAPPA acceleration=2, bandwidth/pixel = 1446 Hz. The flex and two spines coils surrounded the sample, with 12 channels used during real-time image reconstruction. Images were transferred and processed online to create 3D temperature images that were displayed in real-time on a dedicated console (Certis Solution, Certis Therapeutics, France).
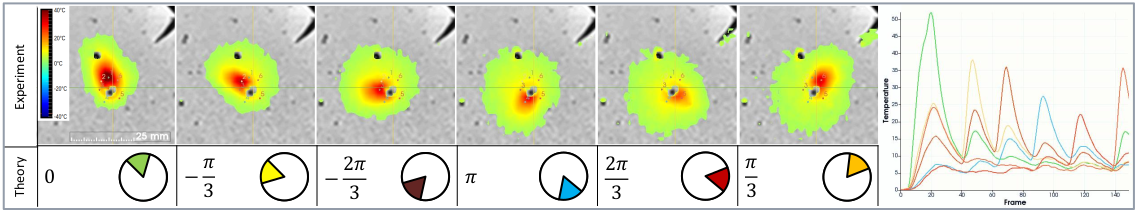
Heating characterization of the device: Each diode was iteratively switched on at an average power of 4.2W during 30 s each with a pause delay of 10 s, monitored by real-time 2D multi-slice MR thermometry. The maximal temperature increase was measured and directions illuminated by each individual fiber was retrieved, locating the hottest point in the temperature map relative to the center of the fiber tip.
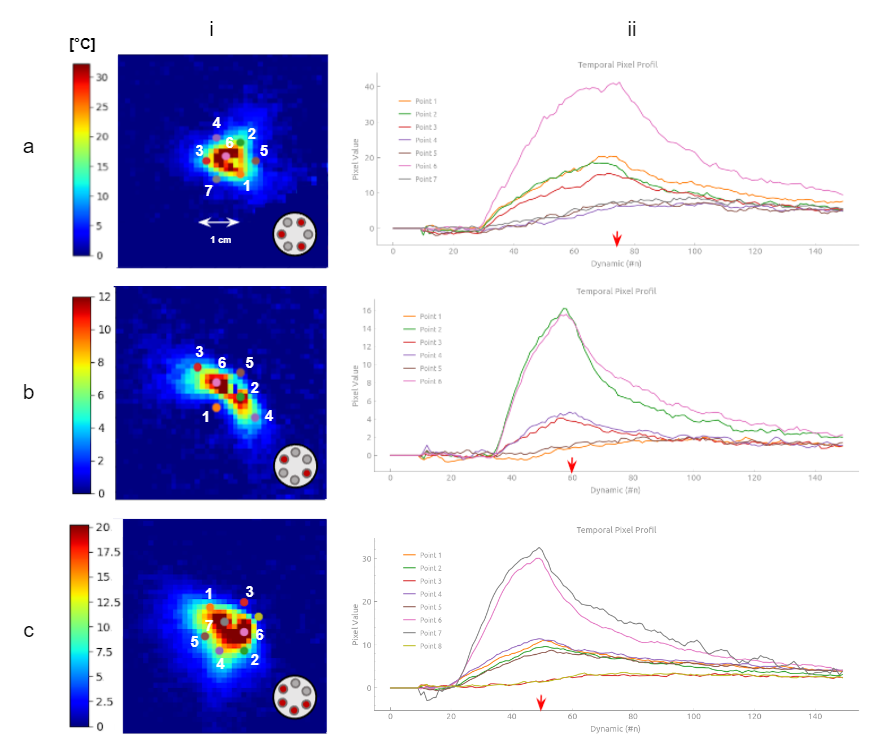
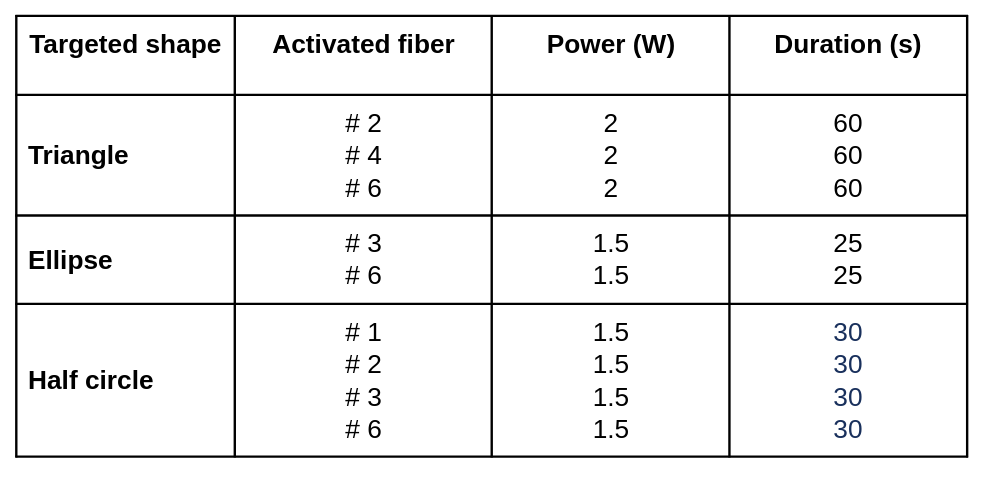
Test of different heating patterns: Three configurations were tested with the purpose of creating different heating patterns. Characteristics of each condition are reported in Table 1.
Results
Figure 1b shows output light beam photographs of the emitted beam for each individual fiber. We observe that fibers #1, #2 and #3 provide a regular cone angle of light, whereas fibers #4 and #5 show a more diffuse emitting beam. Fiber #6 shows a more homogeneous cone beam than fibers #4 and #5 but with a larger aperture than the first 3 fibers. Thermometry data displayed in Figure 2 provide a quantitative description of the heating patterns of each fiber. The highest temperature rise was observed for fiber #1, nearly identical values were observed for fibers #2, #3 and #6 and lower temperature increase were measured for fibers #4 and #5. Angles of illumination were found to be 0°, 33.5°, 77°, 138°, 244°, and 315.5° for each fiber respectively, with 0° set as reference for fiber #1. Figure 3 shows the results of the 3 tested configurations presented in Table 1. The resulting heated patterns show that a triangle, an ellipse and a half sphere can be created with the same device by selecting different laser emitting characteristics.Conclusion & Discussion
These results show that the proposed LITT device is MR-compatible and allows us to create various heating shapes that can be visualized in real-time by rapid volumetric MRI-thermometry. The quantitative thermometry data can serve to quantify heating patterns of each emitting fiber. Optimization of the multi-element fiber tip is required to provide a homogeneous and spatially distributed illumination that allows adaptive heating patterns. Such an approach combined with real-time 2D multi-slice MR-thermometry has the potential to improve the therapeutic efficiency of LITT.Acknowledgements
No acknowledgement found.References
[1] A. van Luijtelaar, J. J. Fütterer, et J. G. Bomers, « Minimally invasive magnetic resonance image-guided prostate interventions », Br. J. Radiol., p. 20210698, November 2021
[2] D. C. de A. Bastos et al., « The use of laser interstitial thermal therapy in the treatment of brain metastases: a literature review », Int. J. Hyperthermia, vol. 37, no 2, p. 53‑60, July 2020
[3] N. V. Patel et al., « Laser Interstitial Thermal Therapy Technology, Physics of Magnetic Resonance Imaging Thermometry, and Technical Considerations for Proper Catheter Placement During Magnetic Resonance Imaging–Guided Laser Interstitial Thermal Therapy », Neurosurgery, vol. 79, p. S8‑S16, December 2016
[4] P. Bour, V. Ozenne, F. Marquet, B. Denis De Senneville, E. Dumont, et B. Quesson, « Evaluation of 2D simultaneous multi-slice EPI at 1.5T for MR-thermometry in presence of motion », Paris, France, June 2018
Figures