1084
Replicability of 1H MR spectroscopic imaging in mild traumatic brain injury1Center for Biomedical Imaging, Department of Radiology, New York University Grossman School of Medicine, New York, NY, United States, 2Department of Neurology, New York University Grossman School of Medicine, New York, NY, United States, 3Department of Radiology, Cochin Hospital, Paris, France, 4Department of Radiology, University of Miami Miller School of Medicine, Miami, FL, United States, 5Siemens Medical Solutions USA Inc., Malvern, PA, United States, 6Department of Rehabilitation Medicine, New York University Grossman School of Medicine, New York, NY, United States, 7Department of Psychiatry, New York University Grossman School of Medicine, New York, NY, United States, 8Ronald O. Perelman Department of Emergency Medicine, New York University Grossman School of Medicine, New York, NY, United States, 9Center for Advanced Imaging Innovation and Research, Department of Radiology, New York University Grossman School of Medicine, New York, NY, United States
Synopsis
1H-MRS has the potential to provide biomarkers for mild traumatic brain injury (mTBI), a diagnosis in which damage is often imaging-occult, but a lack of replicability and reproducibility studies hampers clinical translation. Here, we tested the replicability of previous MRSI results in mTBI with a different patient cohort. Five out of seven hypotheses were consistent with previous work, with key findings of globally diffuse white matter (WM) injury and limited gray matter injury. However, we report differences in choline and creatine, not N-acetyl-aspartate. Correlations were found between metabolite levels in WM and both symptomatology and neuropsychological testing.
Introduction
About 75% of all traumatic brain injuries are classified as mild (mTBI), of which 15-30% of patients experience persisting neurological or psychological deficits1. Clinical CT and MRI have been used to diagnose mTBI with limited success2, since these imaging modalities are unable to capture microscopic signatures of diffuse axonal injury (DAI), a key feature of TBI3. Biomarkers of DAI pathophysiology are therefore needed to improve the identification of mTBI patients, particularly those who may not fully recover. Single- and multi-voxel proton MR spectroscopy (SVS, MRSI) have shown sensitivity to biochemical alterations in mTBI4, indicated by changes in choline (Cho), creatine (Cr), glutamate plus glutamine (Glx), myo-inositol (mI), and N-acetyl aspartate (NAA), markers of membrane turnover, cellular energy, glutamate cycle, astrogliosis, and neuronal integrity, respectively5. Results, however, have been inconsistent6,7. We therefore investigated whether our MRSI findings in mTBI over the last decade8-11 can be replicated in a separate mTBI patient cohort. Based on our previously reported findings, we hypothesize that global analysis will reveal (H1) diffuse8,9, (H2) white matter (WM) abnormalities8,9, namely (H3) low NAA8,9, which will (H4) correlate with clinical presentation9. We also hypothesize that regional analysis will yield a lack of findings in (H5) six subcortical WM11 and (H6) four deep GM structures10, except for (H7) higher mI in the putamen10 in mTBI patients compared to controls.As add-ons, previously unavailable Glx was included as an additional metabolite in all analyses; and symptomatology and cognitive testing scales (also previously unavailable) were included.
Materials and Methods
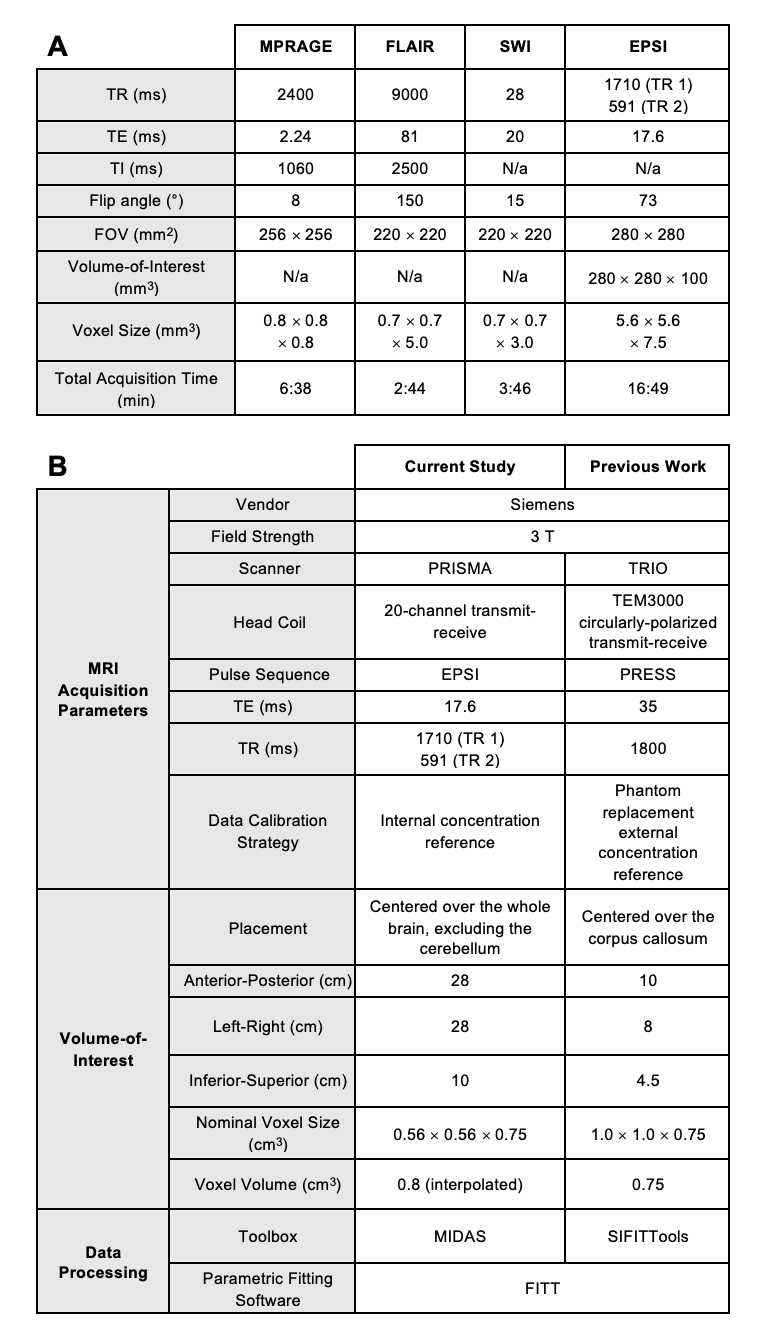
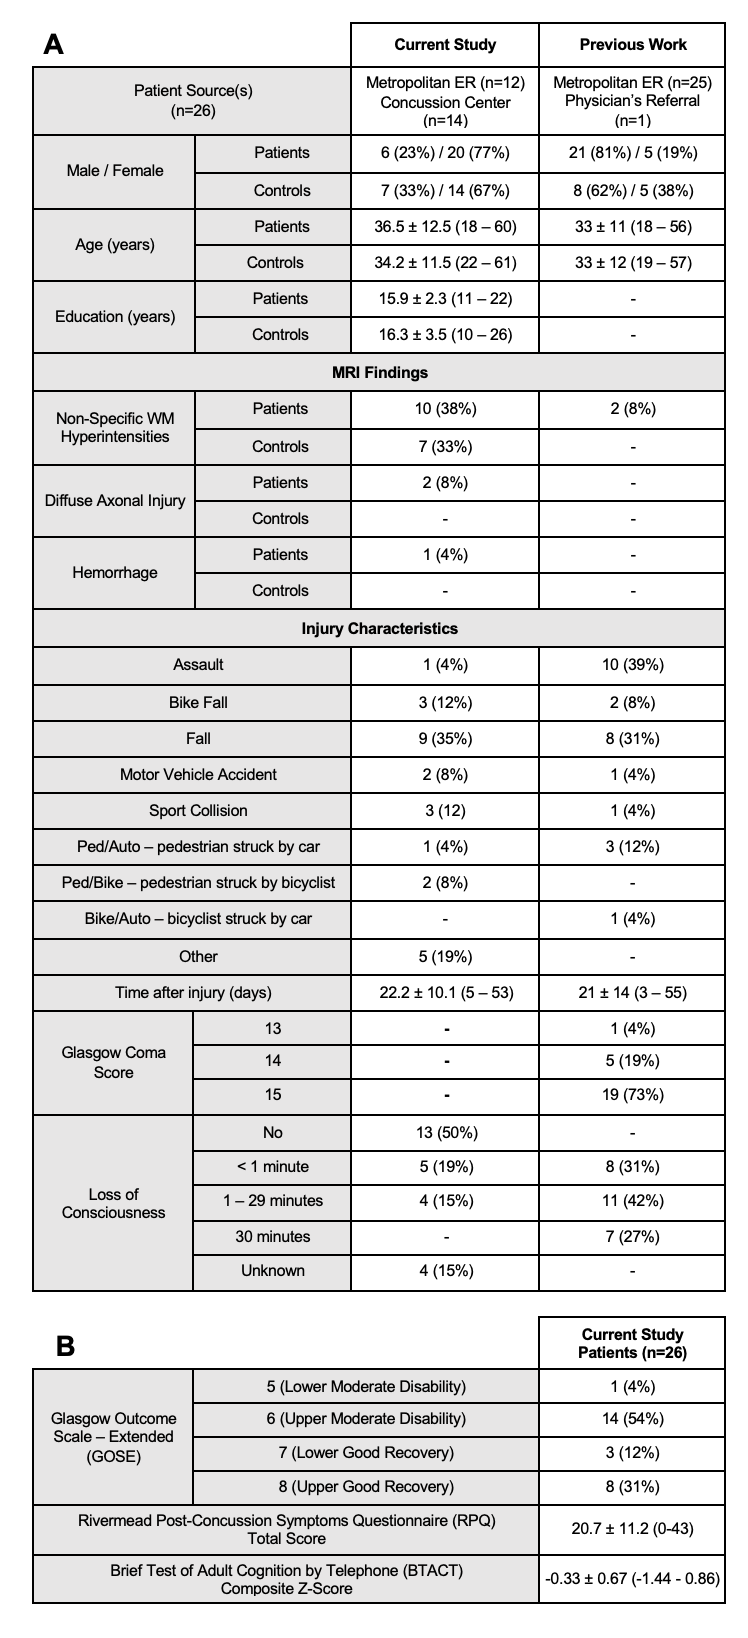
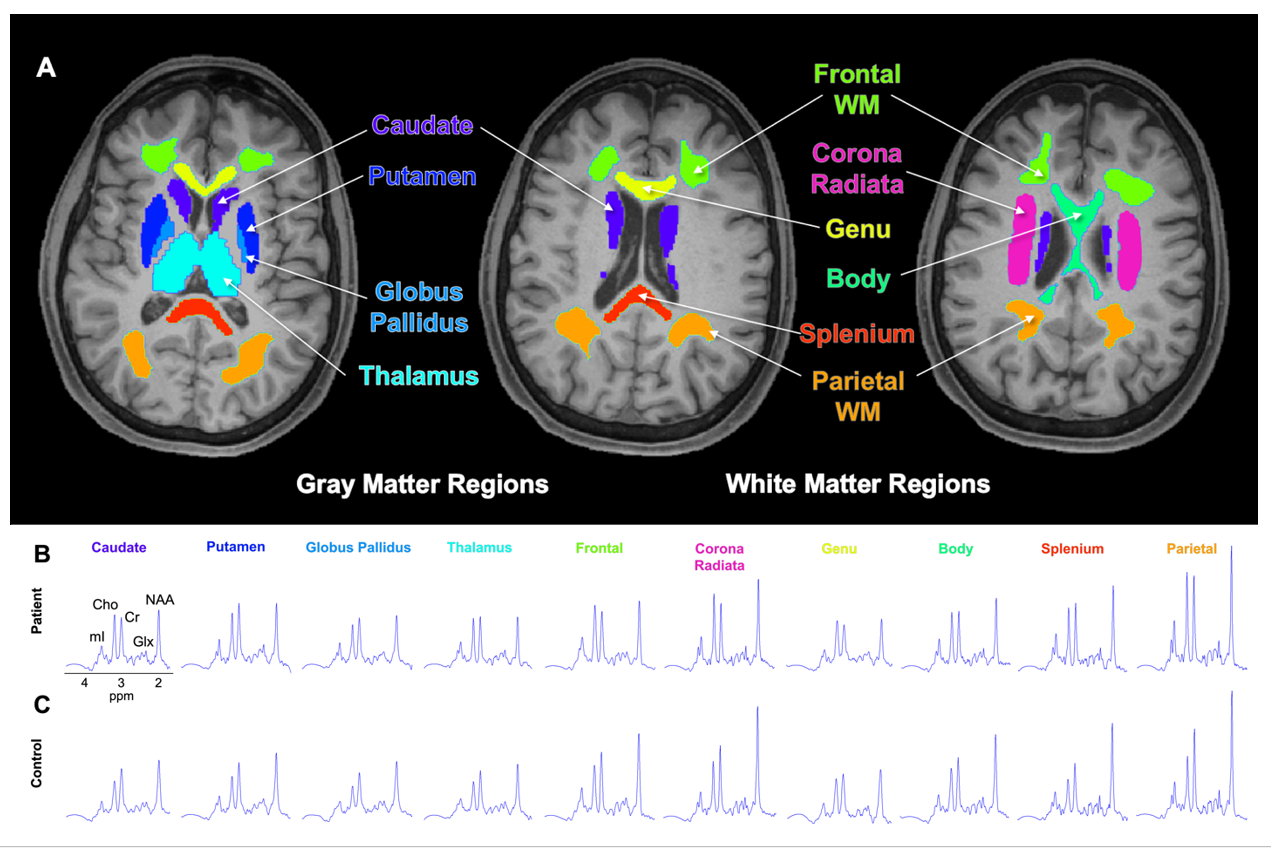
26 mTBI patients (20 females, 36.5±12.5 years old), within two months from injury; and 21 age-, sex-, and education-matched healthy controls (14 females, 34.2±11.5 years old) were scanned at 3T (MAGNETOM Prisma, Siemens Healthcare, Erlangen, Germany) with a 20-channel head coil. The protocol included MPRAGE, FLAIR, SWI, and a prototype 3D EPSI12, detailed in Table 1. Using MIDAS13, regional data were measured from 10 GM and WM structures, segmented in FreeSurfer14 and FireVoxel15 (Figure 1). Global data were processed by linear regression analysis in atlas-defined frontal, parietal, temporal, and occipital lobes. Metabolite levels were normalized to internal water and presented in institutional units (i.u.). Patients’ clinical outcomes were measured by the Glasgow Outcome Scale – Extended (GOSE)16, Rivermead Post-Concussion Symptoms Questionnaire (RPQ)17, and Brief Test of Adult Cognition by Telephone (BTACT)18. Mann-Whitney tests were used to assess patient and control group differences across Cho, Cr, Glx, mI and NAA levels. All mTBI patients were further stratified into non-recovered (n=18, GOSE<8) and recovered (n=8, GOSE=8) subgroups. Additional Mann-Whitney tests compared both non-recovered and recovered patients with their respectively matched controls. Spearman’s rank correlations were used to examine associations between patients’ metabolite levels and symptomatology (RPQ total score) and cognitive functioning (BTACT composite z-score). Statistical significance was defined as p<0.05.Results
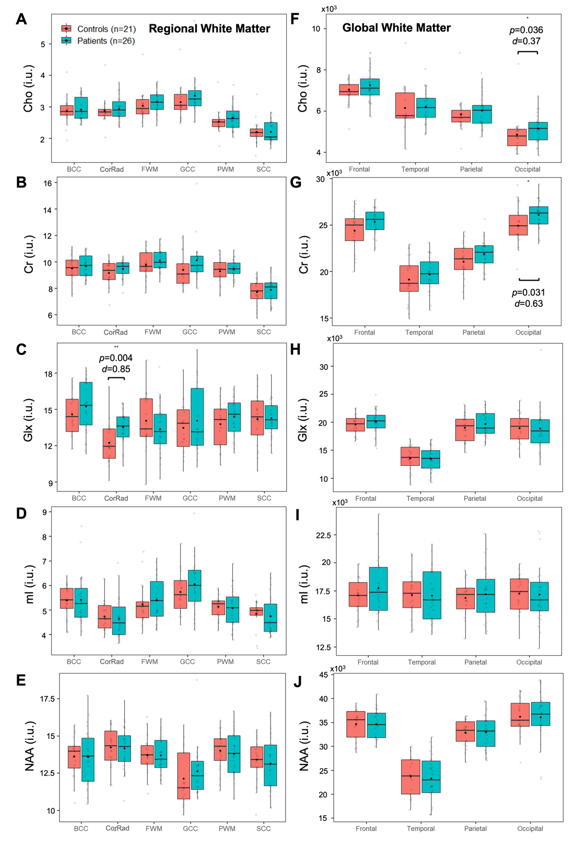
Demographics, clinical and neuropsychological testing results are compiled in Table 2.Regional Analyses: Group comparisons revealed only higher corona radiata (CorRad) Glx in all mTBI patients compared to controls (Figures 2A-E). After stratification, we again found higher CorRad Glx, plus higher frontal WM Cho and parietal WM Glx in non-recovered patients than in controls.
Global Analyses: Group comparisons revealed higher occipital WM Cho and Cr in all mTBI patients compared to controls (Figures 2F-J). These statistically significant differences remained after stratification, with effect size increases of 9.0% and 6.5% in occipital WM Cho and Cr, respectively, for non-recovered patients compared to controls. No group differences were found between recovered patients and controls. For all WM Cho and Cr comparisons without statistical significance, unidirectional effect sizes were observed (Cohen’s d for Cho: 0.07-0.37, for Cr: 0.22-0.63).
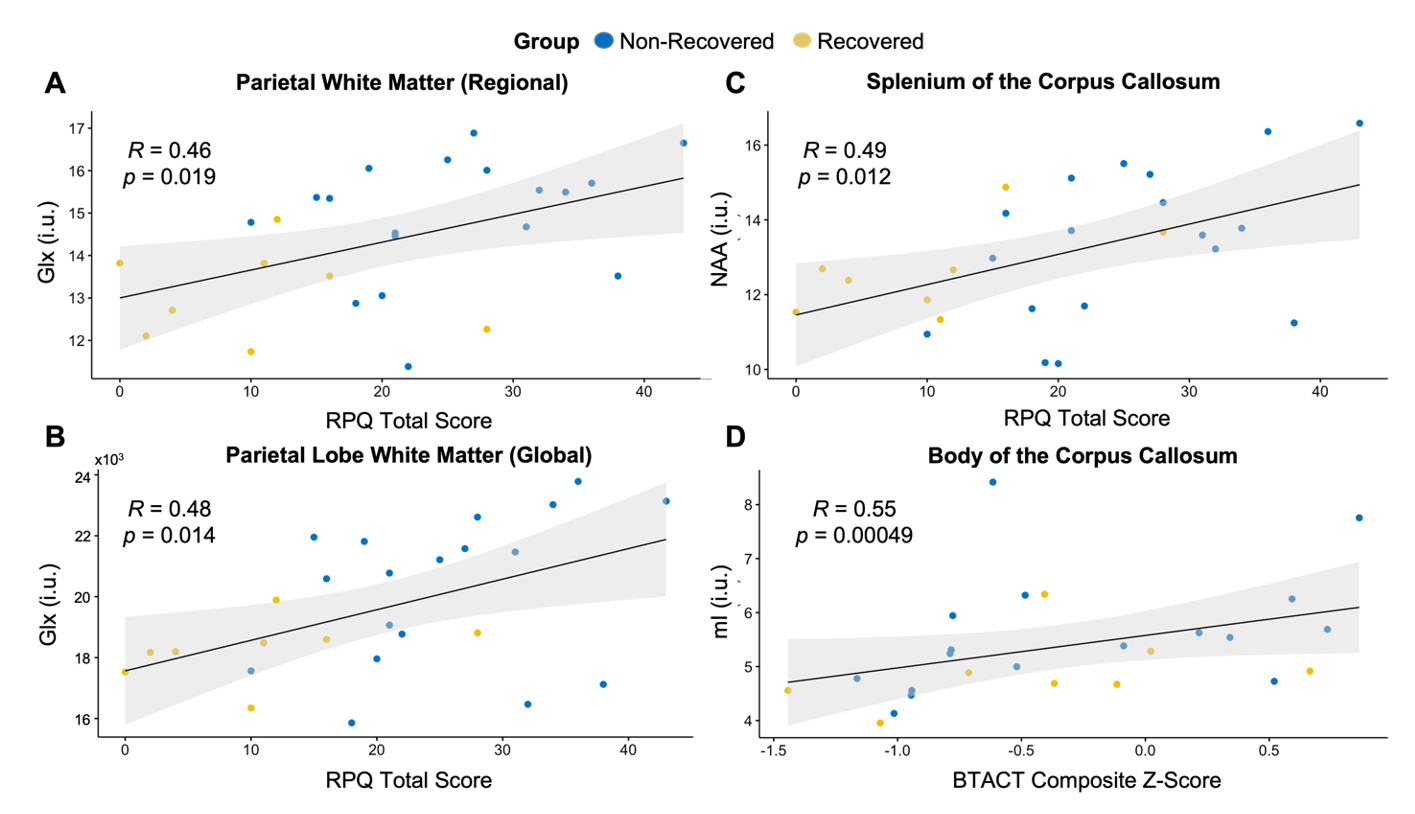
Spearman's correlations revealed direct associations between parietal Glx, corpus callosum splenium NAA and RPQ, and corpus callosum body mI and BTACT (Figure 3).
Discussion
Our results supported five out of seven hypotheses from the previous work8-11. We replicated globally diffuse WM injury which correlated with functional outcome, and found no GM injury (H1-H2, H4-H6). The findings, however, were among the glial markers Cho and Cr, not the neuronal marker NAA (H3), and were absent in putaminal mI (H7).As additional analyses (not part of H1-H7), we investigated group differences in regional and global Glx, as well as correlations between metabolite levels and symptomatology and cognitive assessment scores. Higher levels of Glx, NAA, and mI in the corpus callosum and parietal WM - areas relevant to network communication19 - correlated with either higher RPQ (more symptomatology) or higher BTACT (better cognitive performance) scores. Although this merits further exploration, functional MRI studies have reported increased connection strength after injury in these regions20, perhaps modulated by the elevated metabolite markers of glutamatergic neurotransmission21 and potential neuronal recovery22 observed here.
The successfully replicated MRSI findings from this current study allow us to conclude that the biochemical signature from this mTBI patient cohort differs from that of the previous work8-11, but its (diffuse) distribution does not. Hence, this study’s main implication, pending multi-site verification, is that clinic-friendly high-SNR SVS voxels may be placed anywhere in WM to identify injury11. Of note, mTBI patients exhibited elevated Cr, a widely used metabolite in relative quantification (i.e., ratios). It may thus be prudent to perform absolute quantification for a more precise interpretation of findings.
Acknowledgements
This work was supported by grants R01NS097494 and R01EB026456 from the National Institutes of Health (NIH).References
1 National Center for Injury Prevention and Control (US). Report to Congress on mild traumatic brain injury in the United States: Steps to prevent a serious public health problem. (Centers for Disease Control and Prevention, 2003).
2 Shin, S. S., Bales, J. W., Edward Dixon, C. & Hwang, M. Structural imaging of mild traumatic brain injury may not be enough: overview of functional and metabolic imaging of mild traumatic brain injury. Brain Imaging Behav 11, 591-610, doi:10.1007/s11682-017-9684-0 (2017).
3 Johnson, V. E., Stewart, W. & Smith, D. H. Axonal pathology in traumatic brain injury. Exp Neurol 246, 35-43, doi:10.1016/j.expneurol.2012.01.013 (2013).
4 Marino, S., Ciurleo, R., Bramanti, P., Federico, A. & De Stefano, N. 1H-MR spectroscopy in traumatic brain injury. Neurocrit Care 14, 127-133, doi:10.1007/s12028-010-9406-6 (2011).
5 Mountford, C. E., Stanwell, P., Lin, A., Ramadan, S. & Ross, B. Neurospectroscopy: the past, present and future. Chem Rev 110, 3060-3086, doi:10.1021/cr900250y (2010).
6 Bartnik-Olson, B. L. et al. The clinical utility of proton magnetic resonance spectroscopy in traumatic brain injury: recommendations from the ENIGMA MRS working group. Brain Imaging Behav 15, 504-525, doi:10.1007/s11682-020-00330-6 (2021).
7 Narayana, P. A. White matter changes in patients with mild traumatic brain injury: MRI perspective. Concussion 2, CNC35, doi:10.2217/cnc-2016-0028 (2017).
8 Kirov, II et al. Diffuse axonal injury in mild traumatic brain injury: a 3D multivoxel proton MR spectroscopy study. J Neurol 260, 242-252, doi:10.1007/s00415-012-6626-z (2013).
9 Kirov, II et al. Proton MR spectroscopy correlates diffuse axonal abnormalities with post-concussive symptoms in mild traumatic brain injury. J Neurotrauma 30, 1200-1204, doi:10.1089/neu.2012.2696 (2013).
10 Kierans, A. S. et al. Myoinositol and glutamate complex neurometabolite abnormality after mild traumatic brain injury. Neurology 82, 521-528, doi:10.1212/WNL.0000000000000105 (2014).
11 Davitz, M. S. et al. Quantitative multivoxel proton MR spectroscopy for the identification of white matter abnormalities in mild traumatic brain injury: Comparison between regional and global analysis. J Magn Reson Imaging 50, 1424-1432, doi:10.1002/jmri.26718 (2019).
12 Ding, X. Q. et al. Reproducibility and reliability of short-TE whole-brain MR spectroscopic imaging of human brain at 3T. Magn Reson Med 73, 921-928, doi:10.1002/mrm.25208 (2015).
13 Maudsley, A. A. et al. Comprehensive processing, display and analysis for in vivo MR spectroscopic imaging. NMR Biomed 19, 492-503, doi:10.1002/nbm.1025 (2006).
14 Fischl, B. FreeSurfer. Neuroimage 62, 774-781, doi:10.1016/j.neuroimage.2012.01.021 (2012).
15 Rusinek, H. et al. Fully automatic segmentation of white matter lesions: error analysis and validation of a new tool. Int J Comput Assist Radiol Surg 8, 289-291 (2013).
16 Wilson, J. T., Pettigrew, L. E. & Teasdale, G. M. Structured interviews for the Glasgow Outcome Scale and the extended Glasgow Outcome Scale: guidelines for their use. J Neurotrauma 15, 573-585, doi:10.1089/neu.1998.15.573 (1998).
17 King, N. S., Crawford, S., Wenden, F. J., Moss, N. E. & Wade, D. T. The Rivermead Post Concussion Symptoms Questionnaire: a measure of symptoms commonly experienced after head injury and its reliability. J Neurol 242, 587-592, doi:10.1007/BF00868811 (1995).
18 Tun, P. A. & Lachman, M. E. Telephone assessment of cognitive function in adulthood: the Brief Test of Adult Cognition by Telephone. Age Ageing 35, 629-632, doi:10.1093/ageing/afl095 (2006).
19 Sharp, D. J., Scott, G. & Leech, R. Network dysfunction after traumatic brain injury. Nat Rev Neurol 10, 156-166, doi:10.1038/nrneurol.2014.15 (2014).
20 Venkatesan, U. M. & Hillary, F. G. Functional connectivity within lateral posterior parietal cortex in moderate to severe traumatic brain injury. Neuropsychology 33, 893 (2019).
21 Ramadan, S., Lin, A. & Stanwell, P. Glutamate and glutamine: a review of in vivo MRS in the human brain. NMR Biomed 26, 1630-1646, doi:10.1002/nbm.3045 (2013).
22 Vagnozzi, R. et al. Assessment of metabolic brain damage and recovery following mild traumatic brain injury: a multicentre, proton magnetic resonance spectroscopic study in concussed patients. Brain 133, 3232-3242, doi:10.1093/brain/awq200 (2010).
23 Soher, B. J., Young, K., Govindaraju, V. & Maudsley, A. A. Automated spectral analysis III: application to in vivo proton MR spectroscopy and spectroscopic imaging. Magn Reson Med 40, 822-831, doi:10.1002/mrm.1910400607 (1998).
Figures