1083
A simulation framework to assess the quantification reliability of 2HG in 1H MRS1Division of Medical Physics in Radiology, German Cancer Research Center (DKFZ), Heidelberg, Germany, 2Faculty of Physics and Astronomy, University of Heidelberg, Heidelberg, Germany, 3Faculty of Medicine, University of Heidelberg, Heidelberg, Germany
Synopsis
The non-invasive detection of 2-hydroxyglutarate (2HG) via 1H MRS is of particular interest in brain tumors, but quantification of 2HG may be challenging due the spectral overlap with Glutamate and Glutamine. In this study, we implemented a simulation framework for the assessment of the quantification reliability for 2HG under realistic conditions, and demonstrated its application to a PRESS sequence at B0=9.4T with a representative set of different TEs and SNR levels. With this framework, we aim to identify optimal acquisition parameters for the detection of 2HG in glioma mouse models at a 9.4-T small animal scanner in the future.
Introduction
The onco-metabolite 2-hydroxyglutarate (2HG) is a biomarker of IDH-mutated gliomas and is of particular interest for the interrogation of IDH-mutation status and therapy planning for brain tumor patients1. A valuable tool for the non-invasive detection of 2HG is 1H MRS. Depending on the 1H MRS sequence, e.g. point-resolved spectroscopy (PRESS), optimal parameters, i.e. echo time (TE), for reliable 2HG detection may be found based on its spectral pattern, yielding best possible separation from other metabolites2,3,4. However, 2HG quantification may still suffer from the spectral overlap with Glutamate (Glu) and Glutamine (Gln), particularly in the case of limited signal-to-noise-ratio (SNR), and when the 2HG concentration is not excessively increased. The purpose of the study was to establish a simulation framework for the assessment of the quantification reliability for 2HG under realistic conditions i.e. low SNR levels, in order to identify a range of optimal acquisition parameters, i.e. TE, for the application in small animal models at B0=9.4T.Methods
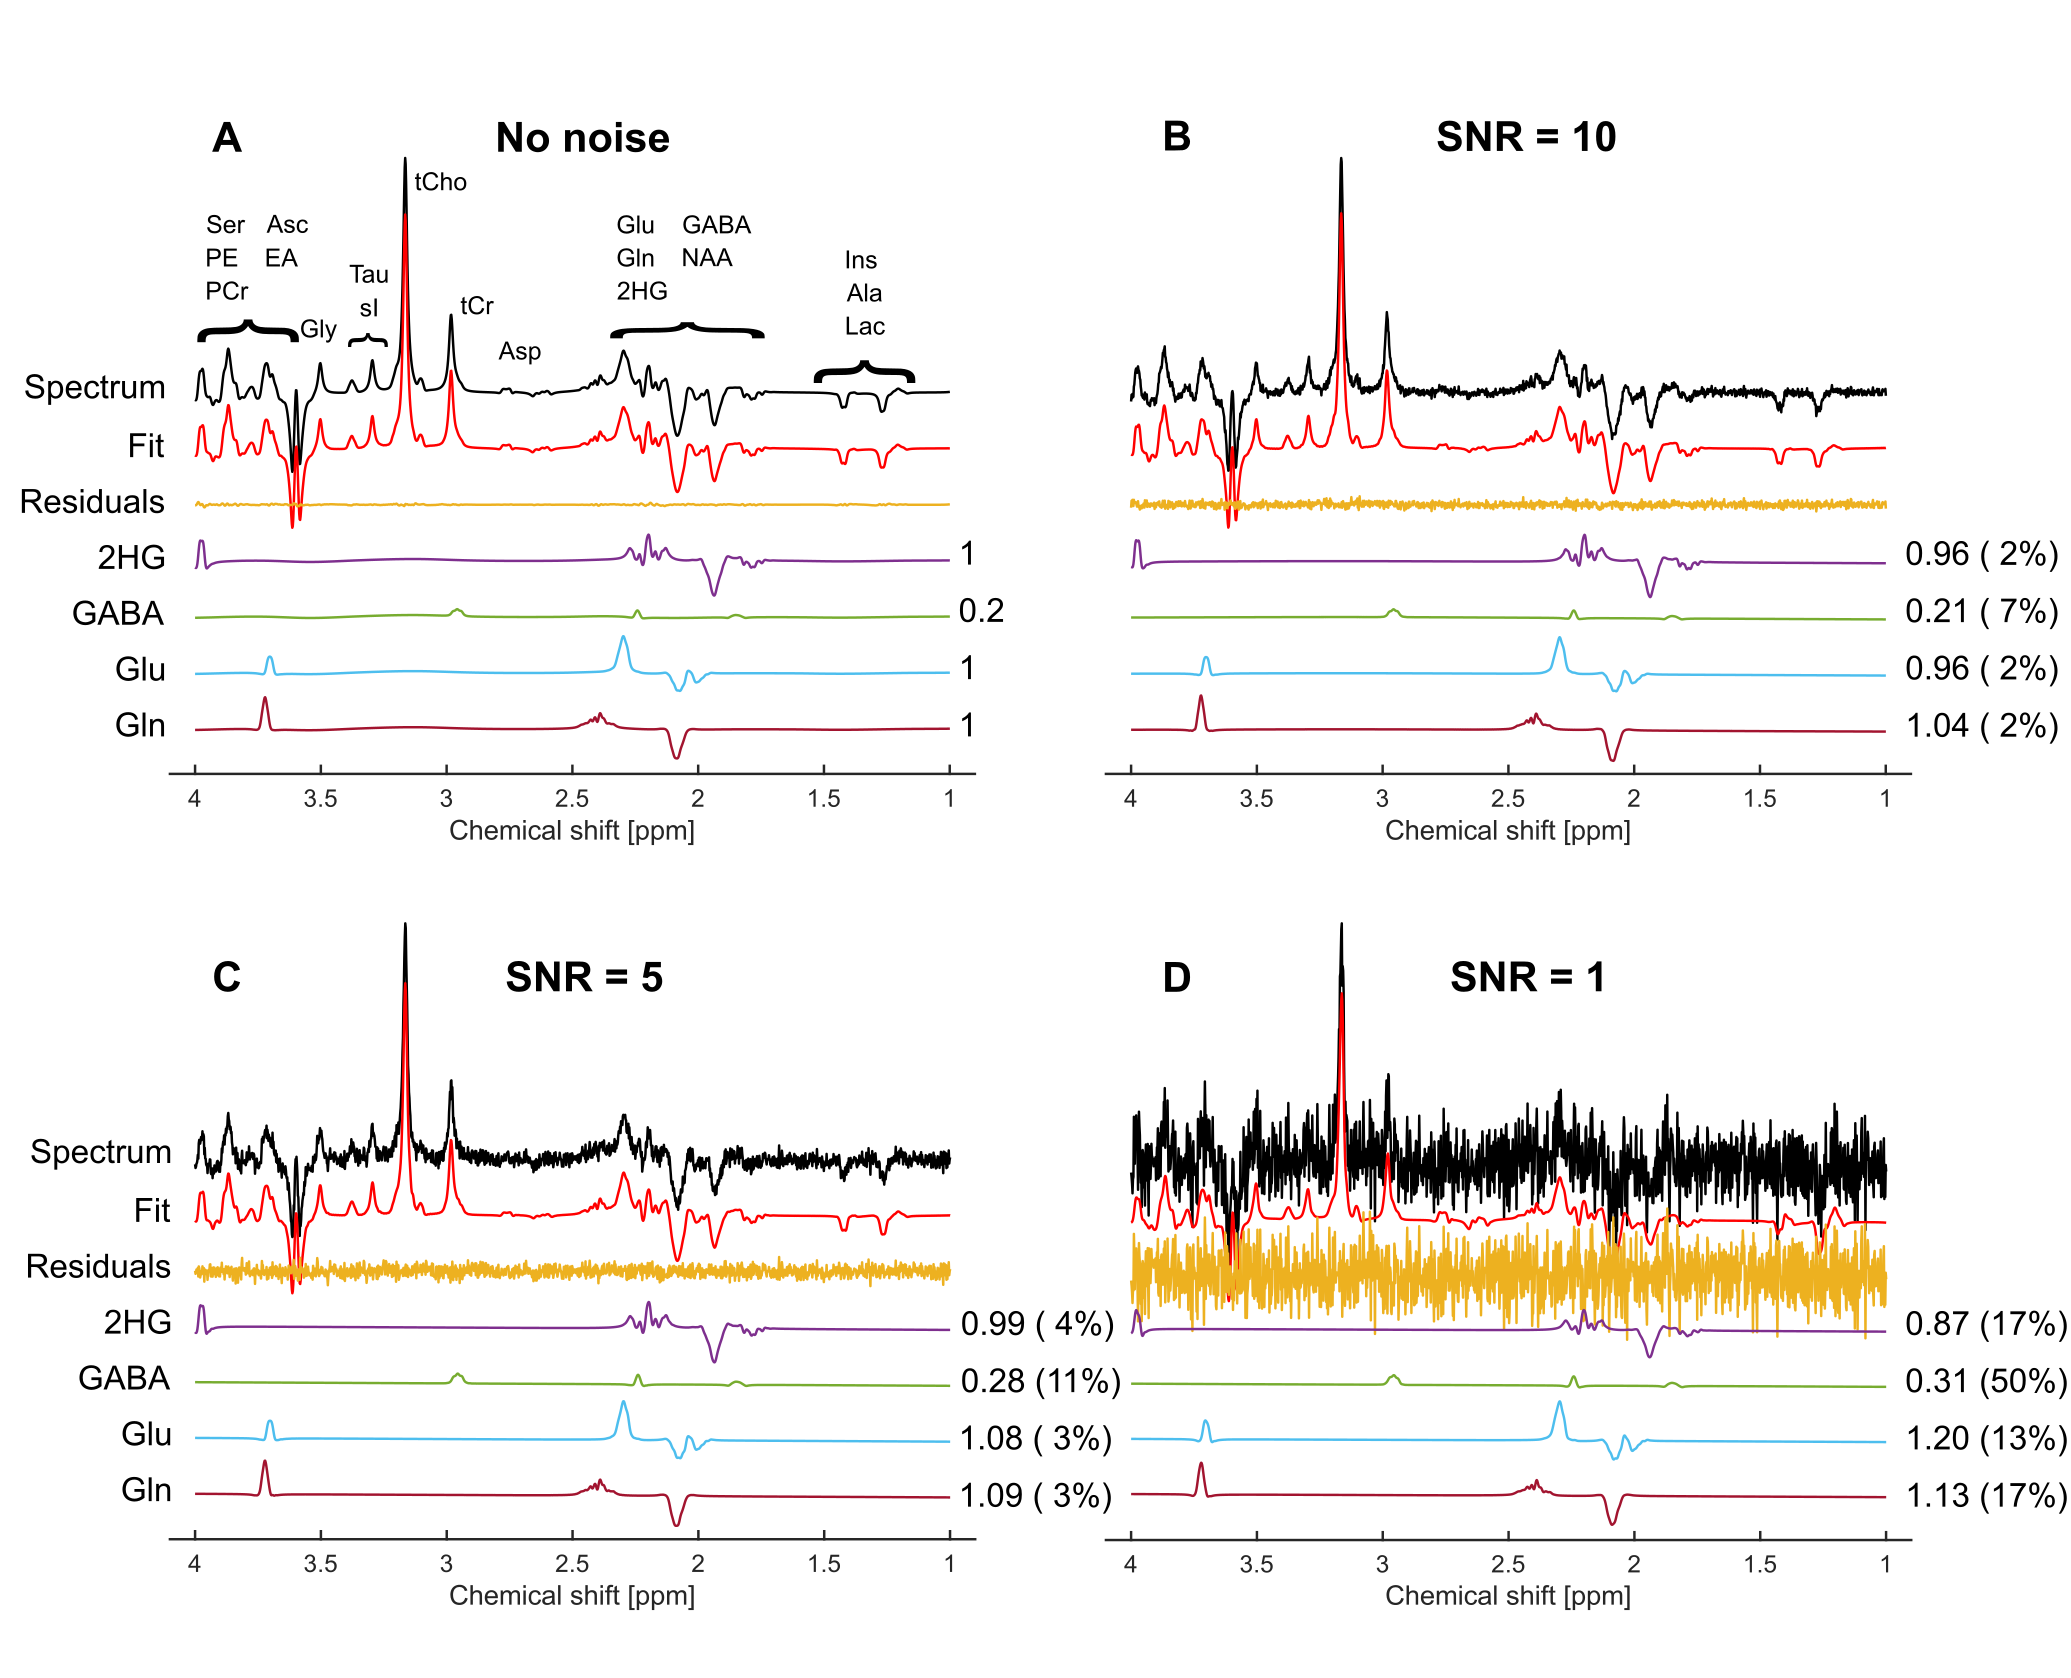
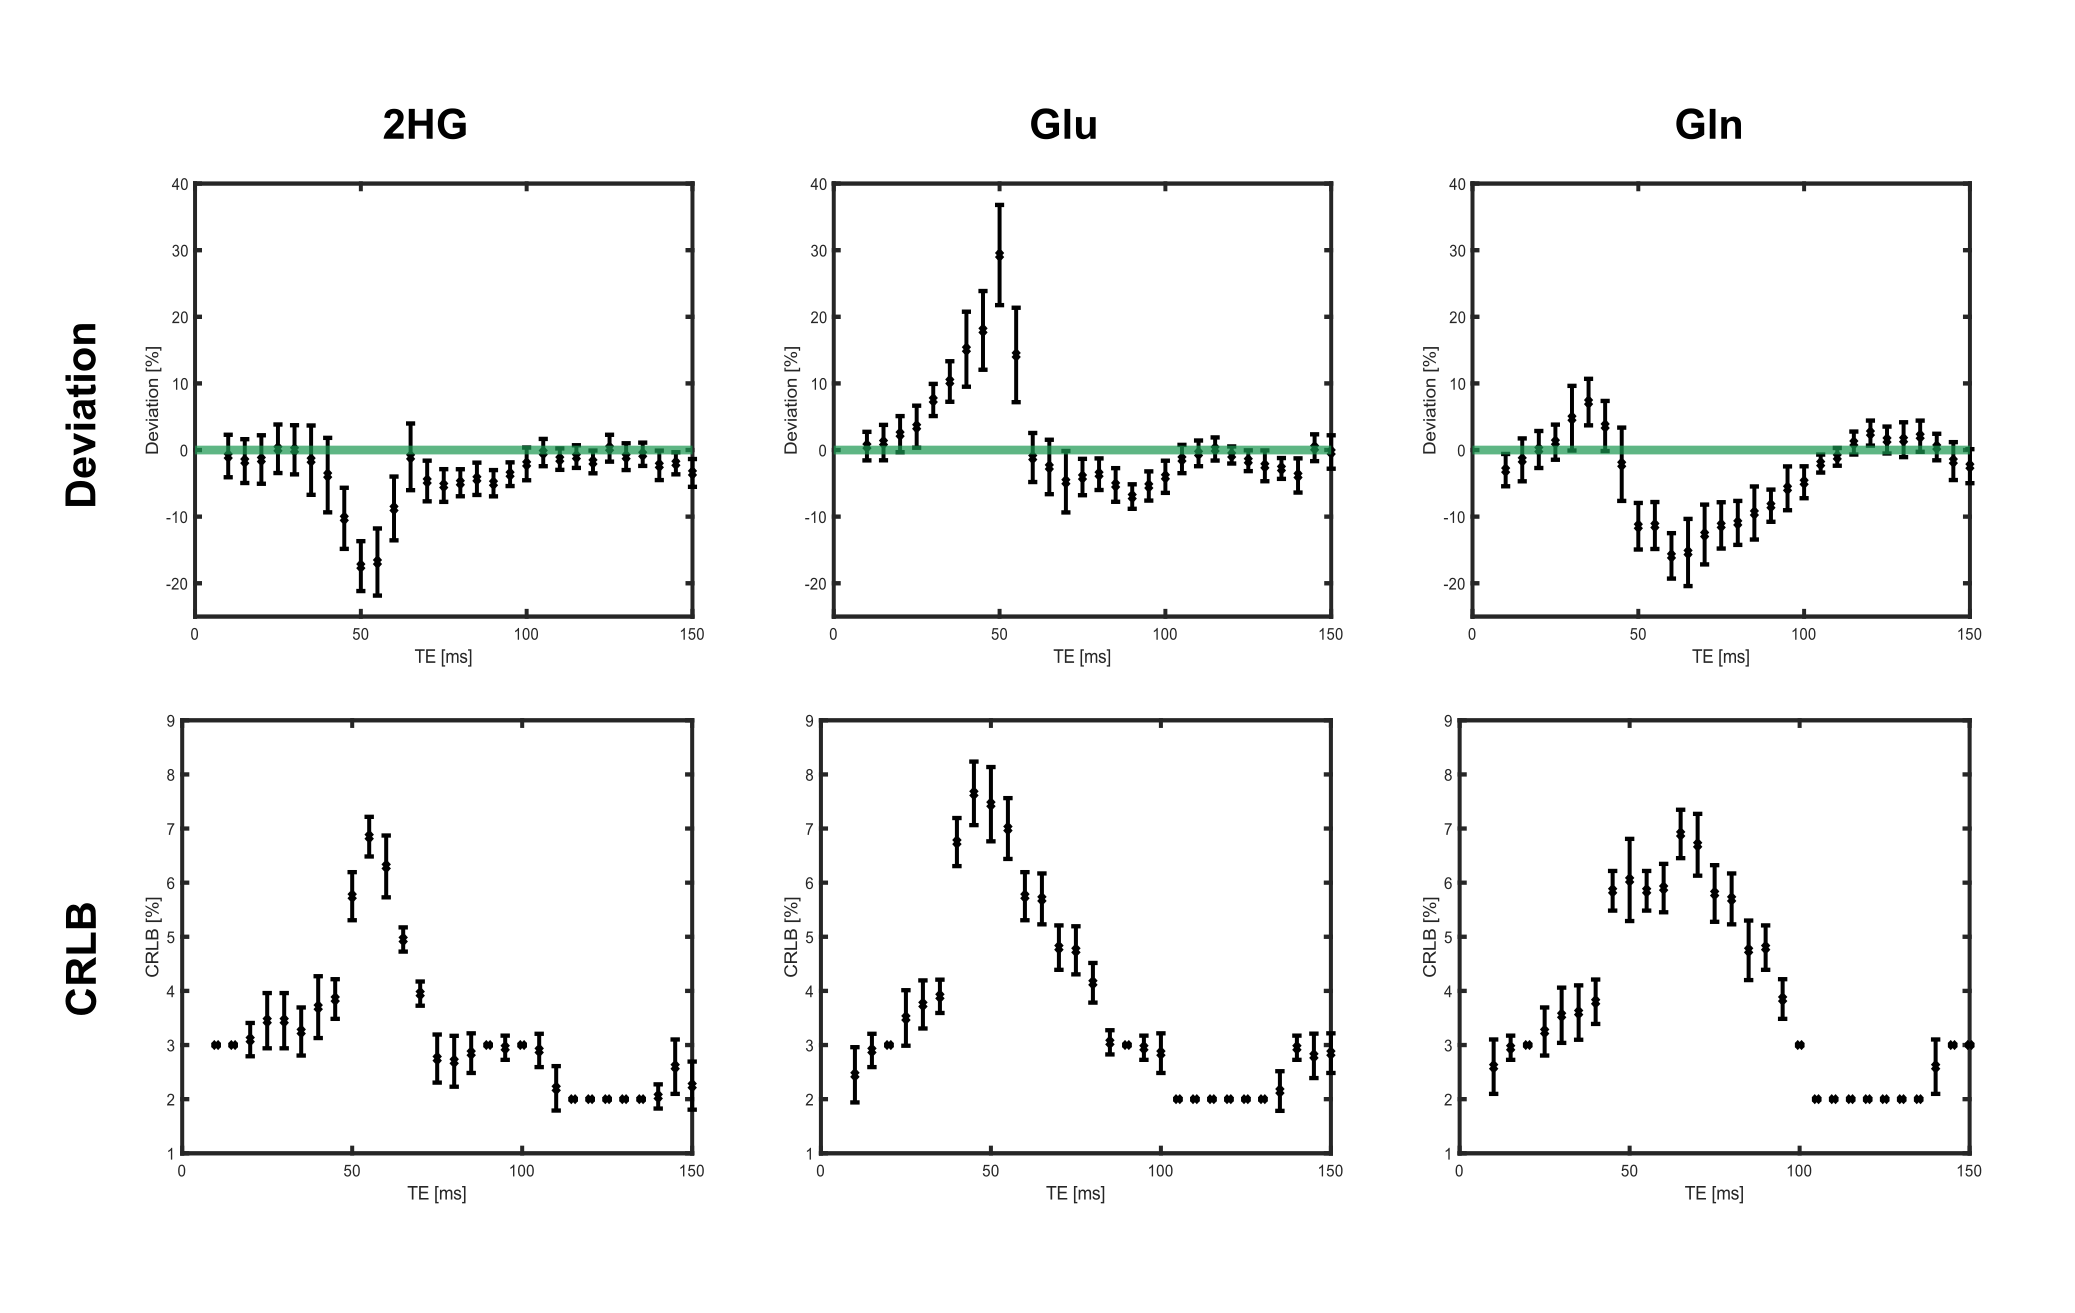
A simulation framework was implemented in Matlab R2021a (The MathWorks) on a standard computer (i7-4790 CPU @3.60GHz, 32GB RAM) using the open-source spin dynamics simulation library Spinach5, in order to (I) generate noiseless 1H spectra at B0=9.4T for a PRESS sequence with 29 different TEs ranging equidistantly from [10–150]ms, and (II) to create corresponding basis sets for the quantification in the LCModel software6. The simulations omitted relaxation effects and were conducted for typical 1H metabolites present in vivo (cf. Fig.1). The resulting spectra were line-broadened by 15 Hz and the concentration ratios of the metabolites were adjusted to mimic a specific condition observed from measurements of glioma mouse models, in particular 2HG/Cr=1, Gln/Cr=1, Glu/Cr=1 (Cr=Creatine). To investigate the influence of SNR on the quantification reliability, four different noise levels were added to the simulated 1H spectra, resulting in spectra with a SNR of 1, 5, 10, and 100 (referred to Cr). For each SNR level, 20 different noise realizations were created, resulting in 80 noisy spectra in addition to the noiseless one for each TE. All spectra were analyzed with LCModel using the custom-created 1H basis sets resulting in quantified concentration values for each metabolite in each spectrum. The relative deviation of the quantified concentration from noisy spectra to the true concentration (e.g. 1 for 2HG) was calculated. Mean values and standard deviations of these deviations were calculated across all 20 noise realizations. The same was done for the Cramér-Rao lower bounds (CRLB).Results
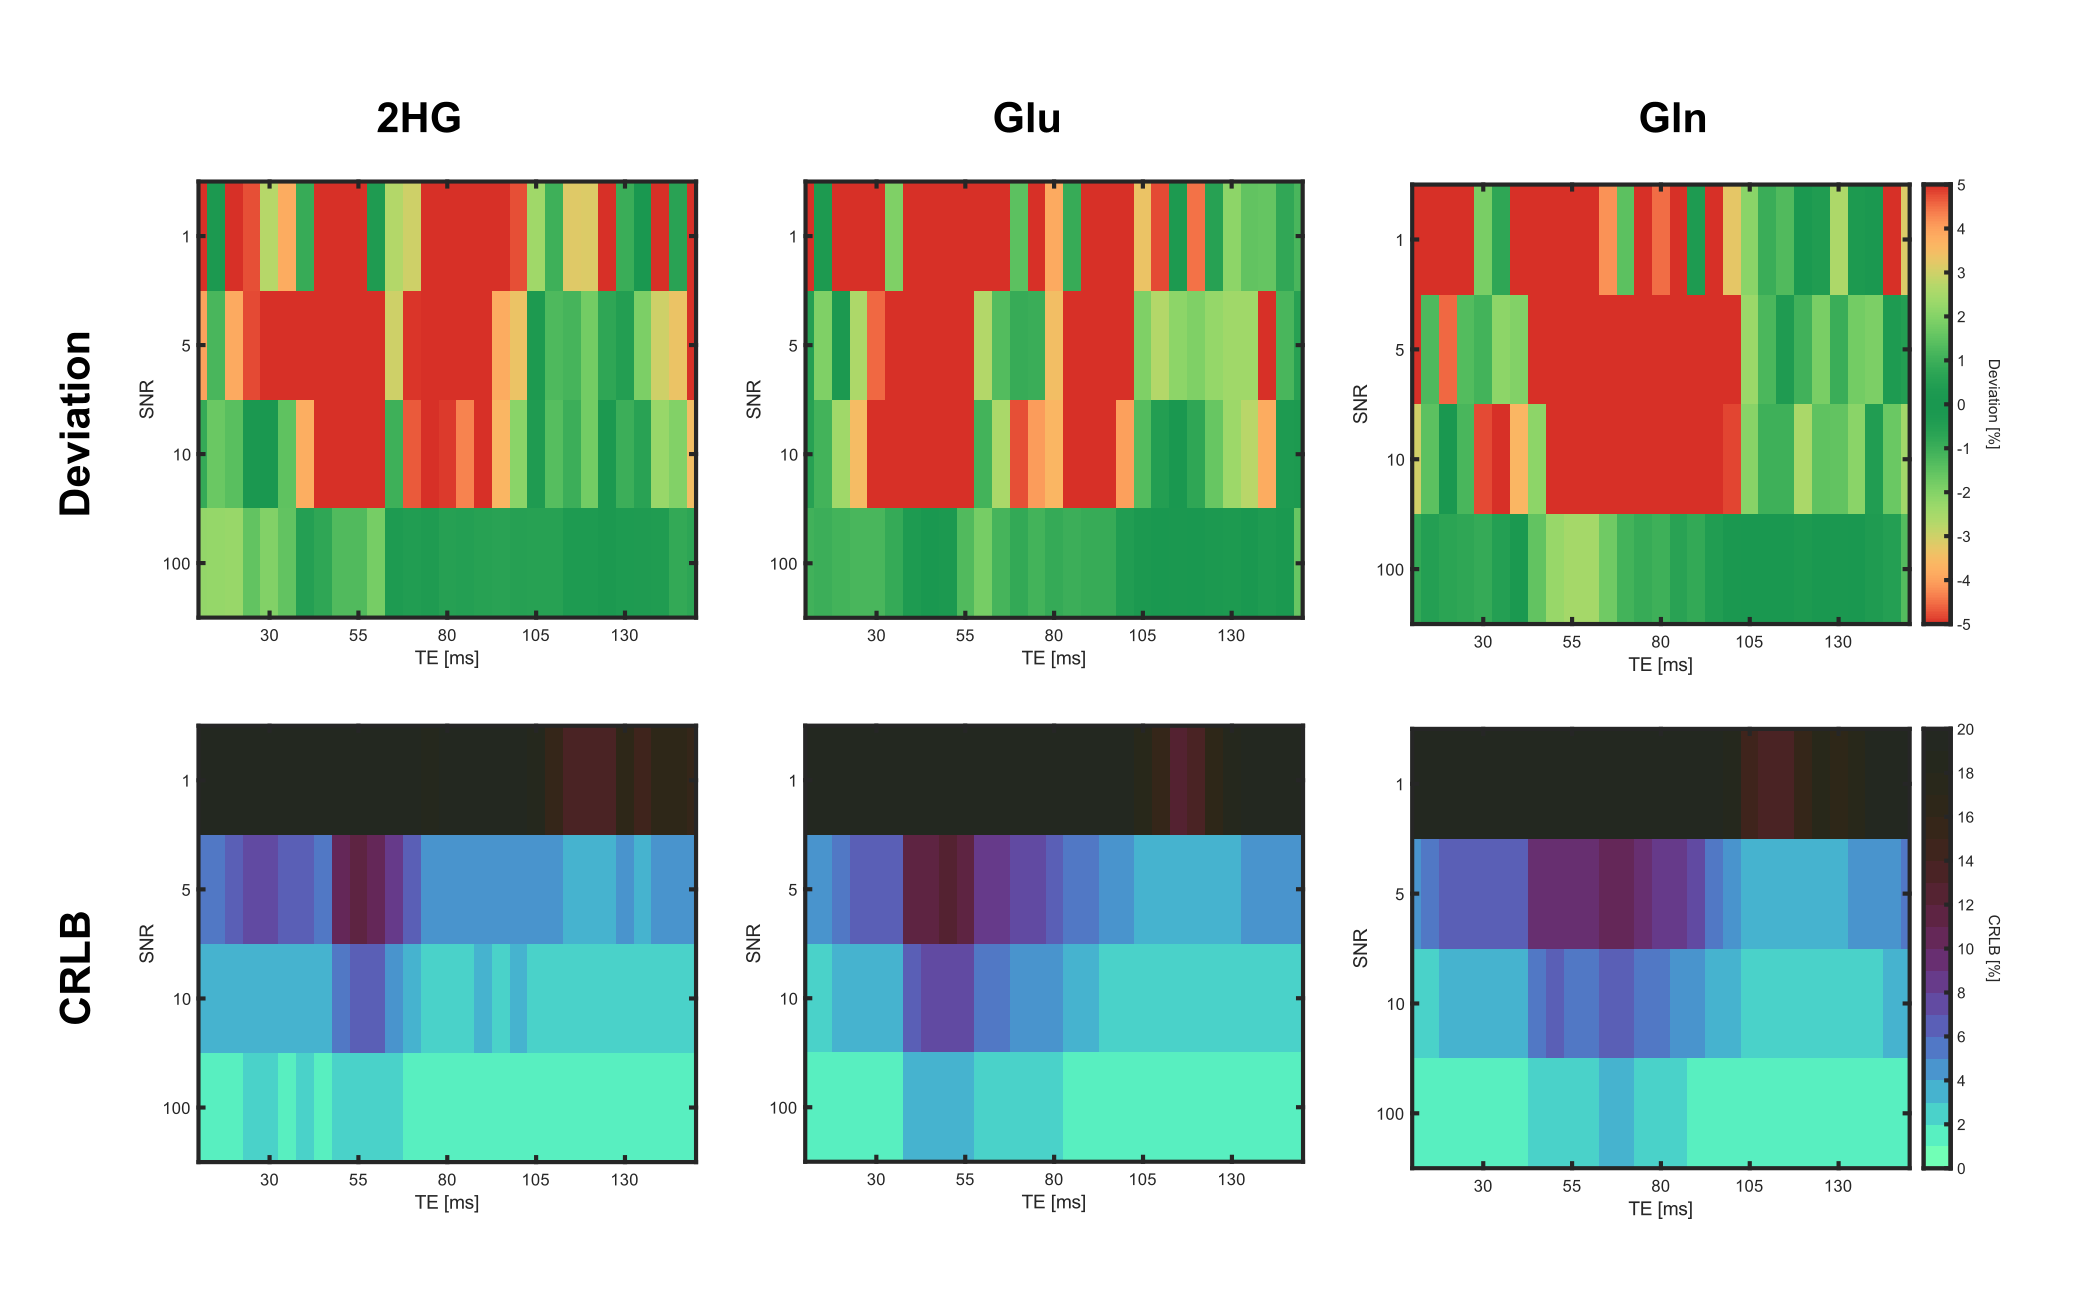
In total, a set of 2320 noisy 1H spectra were fitted in LCModel, based on the simulated noiseless spectra for each of the 29 different echo times (simulation time approximately 11 hours). Figure 1 shows representative spectra for TE=120ms without (A) and with noise (B-D), along with the corresponding fits. While the fits of the spectra with SNR≥5 (Fig.1 B,C) yield reasonable concentration estimates, the fitting quality of the spectrum with SNR=1 (Fig. 1D) could be considered as insufficient due to the larger CRLBs. Depending on the echo time, the individual metabolite concentrations are estimated with varying accuracy for a fixed SNR level (Fig. 2). For the overlapping metabolites 2HG, Gln and Glu, the smallest deviation from the true concentration with lowest variance, occurred in the TE range of [110–135]ms, where also the CRLBs were the smallest. Across all investigated SNR levels, the same trend was observed (Fig. 3). The lowest CRLBs and lowest deviations from the true concentrations are obtained for a TE around 120ms. At very high SNR, long TEs outperformed short TEs in terms of reliability.Discussion
In this study, we presented a simulation framework to analyze the quantification reliability for 2HG including effects of the entire 1H spectrum, with the specific focus on the problem of 2HG overlapping with Gln and Glu. The simulations can be performed in feasible time frames on a standard computer. The quantification reliability of 2HG was investigated in terms of CRLBs and relative deviations of the quantified concentrations for a representative set of different TEs and SNR levels. As expected, the CRLBs reflect a similar behavior as the relative deviations in all cases for the overlapping metabolites 2HG, Glu and Gln. In this example, a PRESS sequence with equally spaced TE intervals (TE1=TE2) was simulated, showing the most reliable detection at long TEs (110–135ms), which is in agreement with other studies2,3,4. These previous studies utilized different approaches for optimized 2HG detection, e.g. PRESS with unequal TE intervals or J-difference editing, which will also be incorporated in our framework. Moreover, the simulations can be easily extended for more TEs and noise realizations, as well as for different shimming conditions and T2 decays in order to better mimic in vivo conditions. In the future, this optimized framework will enable us to identify optimal sequence schemes and parameters for the application in small animal models at B0=9.4T.Conclusion
We implemented a simulation framework to assess the quantification reliability of 2HG in 1H MR spectra under realistic conditions. With this set-up, we aim to optimize the detection of 2HG in glioma mouse models at a 9.4-T small animal scanner in the future.Acknowledgements
No acknowledgement found.References
[1]
Dang L, Yen K
& Attar EC. IDH mutations in cancer and progress toward
development of targeted therapeutics. Annals
of Oncology 27 (2016): 599–608. doi:10.1093/annonc/mdw013
[2]
Choi C, Ganji SK, DeBerardinis RJ, Hatanpaa KJ, Rakheja D, Kovacs Z, et al.
2-Hydroxyglutarate detection by magnetic resonance spectroscopy in IDH-mutated
patients with gliomas. Nat Med.
(2012) 18:624–9. doi: 10.1038/nm.2682
[3]
Andronesi OC, Kim GS, Gerstner E, Batchelor T,
Tzika AA, Fantin VR, et al. Detection of 2-hydroxyglutarate in IDH-mutated
glioma patients by in vivo spectral-editing and 2D correlation magnetic
resonance spectroscopy. Sci Transl Med. (2012) 4:116ra4. doi:
10.1126/scitranslmed.3002693
[4]
Tiwari V, Mashimo T, An Z, et al. In vivo MRS measurement
of 2-hydroxyglutarate in patient-derived IDH-mutant xenograft mouse models
versus glioma patients. Magn Reson Med. 2020; 84(3): 1152- 1160. https://doi.org/10.1002/mrm.28183
[5]
Hogben HJ, Krzystyniak M, Charnock GTP, Hore PJ, Kuprov I, "Spinach - a
software library for simulation of spin dynamics in large spin systems",
Journal of Magnetic Resonance, 208 (2011) 179-194
[6]
Provencher SW. Estimation of metabolite concentrations from localized in vivo
proton NMR spectra. Magn Reson Med. 1993;30:672–679
Figures