1082
Mapping of apparent Intra- and extra-myocellular lipid content using spiral spectroscopic imaging and diffusion imaging at 3T1Université de Lyon, INSA-Lyon, Université Claude Bernard Lyon 1, UJM-Saint Etienne, CNRS, Inserm, CREATIS UMR 5220, U1206, Lyon, France, 2Siemens Healthineers, Saint-Denis, France, 3Wolfson Brain Imaging Center, University of Cambridge, Cambridge, United Kingdom
Synopsis
Exploring spatial distribution of intra- and extramyocellular lipids linked to the orientation of muscle fibers is complex. We used a magnetic resonance spectroscopic imaging (MRSI) technique with a spiral encoding of k-t space and diffusion imaging tractography at 3T to reveal possible concomitant factors. The IMCL preponderance index, exploiting the spectroscopic dimension and proposed in this study, highlights interesting and relevant patterns in some calf muscle heads.
Introduction
Proton Magnetic Resonance Spectroscopy Imaging (MRSI) is the technique of choice for the non-invasive identification and quantification of extra (EMCL) and intramyocellular lipids (IMCL)1,2. However, the observation and evaluation of their spatial distributions remain complex and challenging3,4. Furthermore, muscle fiber orientation coupled to differences in magnetic susceptibilities impacts the observation of IMCL and EMCL signals5,6. This work presents a fast and simple method based on spiral MRSI for mapping the IMCL and EMCL apparent content, compared to the fibers’ orientation obtained from diffusion tractography.Material & Method
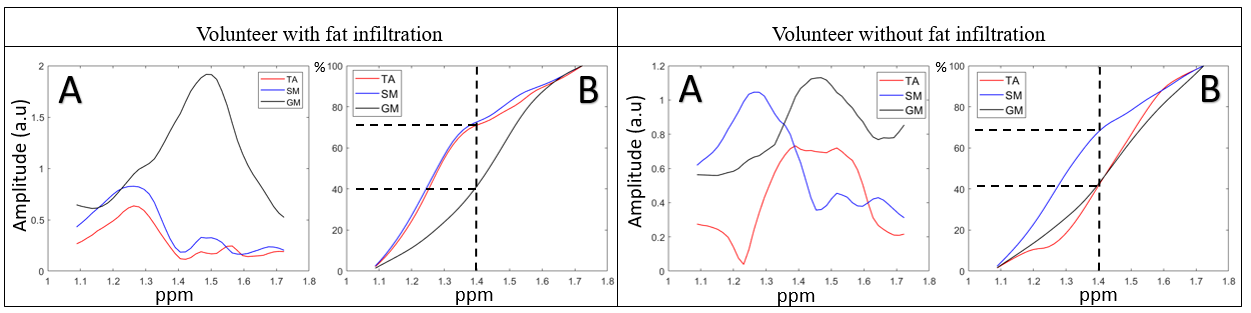
A spiral MRSI sequence was developed on a 3T clinical MRI (MAGNETOM PRISMA, Siemens Healthineers, Erlangen, Germany) implementing a spatially selective RF pulse followed by a train of spiral readout gradient for spiral filling of the k-t space. The acquisition time (Tacq) depends on the number of spatial and temporal interleaves and the repetition time. Main parameters were TR=2s, TE=2ms, FOV=200x200x25mm, spatial resolution=64x64, voxel size=3.1x3.1x25mm, temporal resolution=500ms, number of temporal points=1024, number of spatial interleaving=22, number of temporal interleaving=5, number of spiral per train=205, 4 dummy, Tacq=3min48s. Spiral MRSI and diffusion imaging were performed using a dual resonance 1H/31P (49.8 MHz) and 1H (123.5 MHz) flexible transmit/receive antenna (Rapid GMBH, Würzburg, Germany) in 12 volunteers, 8 of them were requested to realize 30 periodic ergometer-controlled plantar flexions every 4s (2min). A Fast (SE-EPI-based) diffusion-weighted and tensor Imaging sequence was subsequently acquired with the following acquisition parameters: b-value=500s/mm2, TR=4s, TE=71ms, FOV=200x200mm, 20 slices, voxel size=2.1x2.1x4mm, Tacq=6min18s. A T1 vibe Dixon acquisition was also performed to derive high-resolution water and fat images, Fat Fraction (FF) of the muscles of interest: anterior tibial (TA), deep posterior compartment (DP), medial solar (SM), and medial gastrocnemius (GM). The coil was positioned under the right calf of the volunteers. A high-order shimming optimized the homogeneity of the magnetic field.MRSI data were analyzed using home-made processing tools (Matlab). Image reconstruction involved a regridding step on a Cartesian grid larger by a factor of 2, Hamming apodization, and fast inverse 2D Fourier transform. Fat fraction from MRS (MRSI-FF) was obtained from area under the curve of water peak and lipid peak. In the spectroscopic dimension, the analysis of the spectra was centered on the characteristic peaks of IMCL and EMCL, respectively, at 1.3ppm and 1.5ppm. In order to facilitate the processing and realize an automatic phasing and frequency registration of the spectra, a Fourier transform on the absolute value of the time domain signal was performed7. Then, the evolution of the cumulative sum of the amplitudes of a fixed area, defined between 1.1ppm and 1.7ppm, was used to analyze the preponderance of IMCL and EMCL for each voxel (Figure1). Mapping the value of this curve index at 1.40 ppm enables displaying the apparent preponderance of IMCL over EMCL in the fat component. A spectrum with a predominance of IMCL will have a fast evolution, while a spectrum with a predominance of EMCL will have a slow evolution (Figure2).
Results
Volunteers without fat infiltrations FI: The average FF obtained by Dixon and MRSI on the muscles of interest were respectively 6.02±2.38 and 5.10±1.17 (Table). Similar results have been observed in previous publications8. In addition, the TA, DP, and the GM muscle fibers presented an orientation globally in the direction of the B0 field. In contrast, the SM had an orientation between the X and Z axis.Volunteers with FI : Four volunteers presented marked fat infiltrations. The mean value of FF obtained by Dixon and MRSI were respectively 14.50±7.75 and 9.49±3.02 (Table). Muscle fibers structural integrity appears modified by fat infiltration. Indeed, while DP, and GM muscle fibers orientation remained unchanged with an orientation globally in the direction of the B0 field, SM showed an orientation globally in the direction the X-axis, while the TA does not exhibit a preferred orientation.
Discussion
FI varied in the studied cases depending on the different nature and function of the muscles heads (Figure1). In subjects without FI, the GM had a lower FF and IMCL preponderance index than other muscles. Specific muscle activation of the GM prior to measurement may have influenced the reported EMCL and IMCL levels, that should be confirmed with futurs experiments performed prior the muscle activation. The FI seem to be of different nature according to the muscles; on the one hand, they appear extra-cellular in the GM and on the other hand, they appear intra-cellular in the TA. In three subjects, we also observed regions combining a high signal of IMCL preponderance index matching with areas exhibiting a fiber orientation perpendicular to the B0 field, but this behavior was not systematic.This preliminary study cannot exclude that the proposed IMCL or EMCL indexes might be influenced by factors such as the fibers’ orientation or the fiber type as described in 4.
Conclusion
The proposed exploration technique is a promising, fast, and straightforward approach to map the apparent preponderance of IMCL compared to EMCL lipids. This preliminary work highlights the potential of this high-resolution spiral spectroscopic imaging technique to provide more insights to refine our understanding on the coupling between structure, function, and the underlying pathophysiology.Acknowledgements
This work was partly supported by the LABEX PRIMES (ANR-11-LABX-0063), Siemens Healthineers and Jabrane Karkouri was supported by the European Union’s Horizon 2020 research and innovation programme under grant agreement No 801075.
References
1. M. Krššák et al., “Proton magnetic resonance spectroscopy in skeletal muscle: Experts’ consensus recommendations,” NMR Biomed., vol. 34, no. 5, May 2021, doi: 10.1002/nbm.4266.
2. C. Boesch, J. Slotboom, H. Hoppeler, and R. Kreis, “In vivo determination of intra-myocellular lipids in human muscle by means of localized1H-MR-spectroscopy,” Magn. Reson. Med., vol. 37, no. 4, pp. 484–493, Apr. 1997, doi: 10.1002/mrm.1910370403.
3. J.-H. Hwang, J. W. Pan, S. Heydari, H. P. Hetherington, and D. T. Stein, “Regional differences in intramyocellular lipids in humans observed by in vivo 1 H-MR spectroscopic imaging,” J. Appl. Physiol., vol. 90, no. 4, pp. 1267–1274, Apr. 2001, doi: 10.1152/jappl.2001.90.4.1267.
4. J. Weis, M. Bruvold, F. Ortiz-Nieto, and H. Ahlström, “High-Resolution Echo-Planar Spectroscopic Imaging of the Human Calf,” PLoS ONE, vol. 9, no. 1, p. e87533, Jan. 2014, doi: 10.1371/journal.pone.0087533.
5. P. Vermathen, R. Kreis, and C. Boesch, “Distribution of intramyocellular lipids in human calf muscles as determined by MR spectroscopic imaging,” Magn. Reson. Med., vol. 51, no. 2, pp. 253–262, Feb. 2004, doi: 10.1002/mrm.10721.
6. A. Khuu et al., “Orientation of lipid strands in the extracellular compartment of muscle: Effect on quantitation of intramyocellular lipids: Orientation of Lipid Strands,” Magn. Reson. Med., vol. 61, no. 1, pp. 16–21, Jan. 2009, doi: 10.1002/mrm.21831.
7. Y. Le Fur and P. J. Cozzone, “FID modulus: a simple and efficient technique to phase and align MR spectra,” Magn. Reson. Mater. Phys. Biol. Med., vol. 27, no. 2, pp. 131–148, Apr. 2014, doi: 10.1007/s10334-013-0381-8.
8. A. A. Alhulail et al., “Fat–water separation by fast metabolite cycling magnetic resonance spectroscopic imaging at 3 T: A method to generate separate quantitative distribution maps of musculoskeletal lipid components,” Magn. Reson. Med., vol. 84, no. 3, pp. 1126–1139, Sep. 2020, doi: 10.1002/mrm.28228.
Figures
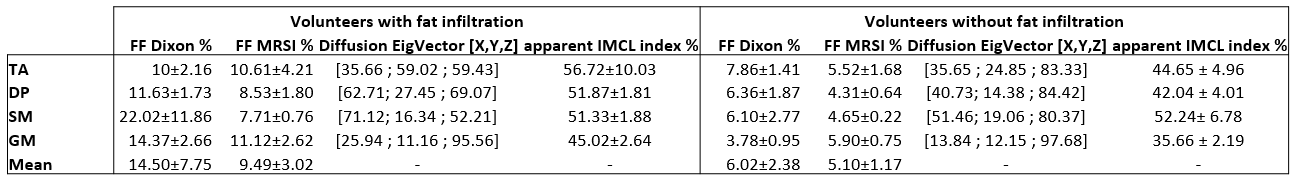
Table: Left: Results for volunteers with fat infiltration. Right: Results for volunteers without fat infiltration. Detailed results of FF obtained by Dixon and MRSI, fiber orientation translated by EigVector value and the percentage of our apparent IMCL preponderance indicator in the selected ROI (20 voxels) for each muscular head.
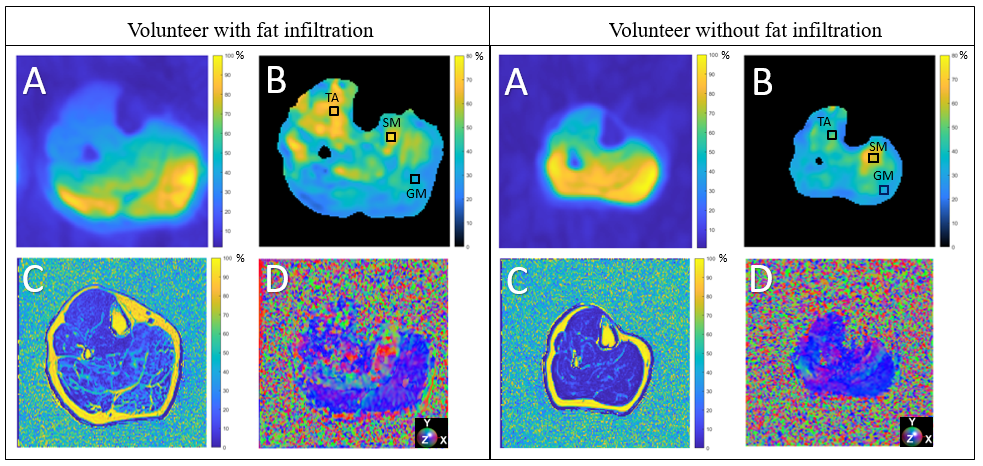
Figure 1: Left: Images on a volunteer with fat infiltration. Right: Images on a volunteer without fat infiltrations. (A) water mapping obtained by MRSI (without correction of the surface coil sensitivity), (B) apparent IMCL preponderance mapping in percentage of the fat content and ROI highlighted for TA, SM, GM muscles. (C) FF map obtained by Dixon (D) fiber orientation translated by the value of the EigVector such as X,Y,Z = R,G,B. Region of interest highlighted for TA, SM, GM muscles.