1078
Improved motion compensation for water-suppressed diffusion MR Spectroscopy evaluated using synthetic data
André Döring1, Derek K Jones1, and Roland Kreis2,3
1Cardiff University Brain Research Imaging Centre (CUBRIC), Cardiff University, Cardiff, United Kingdom, 2Magnetic Resonance Methodology, Institute of Diagnostic and Interventional Neuroradiology, University Bern, Bern, Switzerland, 3Translational Imaging Center, sitem-insel, Bern, Switzerland
1Cardiff University Brain Research Imaging Centre (CUBRIC), Cardiff University, Cardiff, United Kingdom, 2Magnetic Resonance Methodology, Institute of Diagnostic and Interventional Neuroradiology, University Bern, Bern, Switzerland, 3Translational Imaging Center, sitem-insel, Bern, Switzerland
Synopsis
We demonstrate that, even without having water as an internal reference, a combination of spectral registration and fitting can restore artificial signal loss promoted by incoherent averaging due to frequency/phase drifts and motion-induced dephasing for the cardinal brain metabolites (tCr, tCho, tNAA, Glx and Ins) by using a set of synthetically distorted diffusion MR spectra (including realistic phase, frequency and amplitude fluctuations).
Introduction
For non-water-suppressed diffusion MR spectroscopy (dMRS), the water signal had been suggested as a high signal-to-noise-ratio (SNR) internal reference to judge and compensate for motion-related signal distortions and amplitude loss1. However, a strong water signal is not always available, e.g., if conventional water-suppression is used or at high b-values where water has largely decayed, but the need for correction of motion-related amplitude fluctuation is biggest. The aim of this work is to demonstrate, on a set of synthetic diffusion MR spectra with realistic frequency, phase and motion distortions (but known ground truth (GT) values) that a combination of spectral registration, advanced fitting and motion compensation can restore artificial signal loss related to incoherent averaging and motional dephasing even without using a water reference.Methods
Preparation of Synthetic Data (Fig. 1) uses GT diffusion decays provided during the dMRS fitting challenge of the “Best practices and tools for Diffusion MR Spectroscopy” workshop2. The data-set is composed of 18 metabolites and a macromolecular background at 9 different b-values (0…50k s/mm²) simulated for a STEAM sequence (TE/TM: 45/60ms) at B0 of 7T. Realistic spectral distortions were added to the GT in 4-steps:- Amplitude Loss mimicking effects of non-linear motion realized by rescaling individual acquisitions according to a Weibull distribution keeping 5/32 shots (≈15%) above a signal-level of 98% (portion of unaffected acquisitions). Signal decay gradually amplified with b-value (at highest b-value maximum decay to below 20%).
- Phase Distortions with a constant but randomly-selected phase offset between ±30° for each b-value and modulated with a uniformly distributed random variation of phases for single acquisitions (SD increases from 15° at bmin to 400° at bmax).
- Frequency Shifts modeled by a gradually increasing constant offset (0Hz at bmin to 30Hz at bmax) plus random normally distributed offsets for single acquisitions (SD 10Hz).
- White Gaussian Noise random at each acquisition and increased in amplitude to create a set of 6 noise realizations with gradually worsening SNR.
- Pre-Frequency alignment realized by identifying and aligning NAA peak in the modulus spectrum of each acquisition, broadened by 10Hz Gauss.
- Spectral registration (FID-A) done in time-domain with FID-A6. For b=0s/mm² single scans aligned to the best shot with the lowest unlikeness metric; for b>0s/mm² alignment referenced to the average b=0s/mm² spectrum.
- Amplitude compensation (FID-A+FiTAID) in two sub-steps: (i) Single shots fitted to the initial averaged spectrum from step 2 to estimate remaining frequency and phase offsets, but also amplitude fluctuations. (ii) These offset data were imported into MatLab for fine-tuned frequency/phase alignments and to apply signal rescaling to the 15% quantile of shots with the highest amplitude to compensate for motion1. Estimated areas used as weights for weighted averaging (square of the noise)1.
Results and Discussion
Root-Mean-Square-Errors (RMSEs) of frequency and phase drifts (Fig. 3) with respect to GT show that fine-adjustment in the FID-A+FiTAID pipeline only yields marginal improvements (at low b-value and noise-level). At a specific noise threshold, depending on b-value and noise-level, it becomes evident that spectral misalignment kicks in, which increases the RMSEs. Further, we found that the pre-frequency alignment step was quite beneficial for spectral registration, which particularly improved the frequency offset correction, while phase alignment remained robust (not shown).Comparing spectra corrected with FID-A and FID-A+FiTAID (Fig. 4) reveals significant differences in peak amplitudes, where uncorrected motion attenuation yields elevated residues for FID-A. However, correction of signal loss is also limited for high noise levels and b-values, where worsening SNR prevents a reliable quantification of signal amplitudes in single shots.
If motion remains uncorrected, as in the standard dMRS FID-A processing scheme (left in Fig. 5A) the resulting diffusivities are overestimated (spurious signal decay). In contrast, motion compensation applied in FID-A+FiTAID (right in Fig. 5A) widely mitigates this effect. However, aside from motion-induced signal loss it is apparent that SNR deterioration at higher noise levels also contributes to determination of an artificially faster diffusion (except for tCho).
Fig. 5B juxtaposes both correction approaches where the Root-Mean-Square-Relative-Errors7 (RMSREs) improve for all metabolites and almost all noise levels after motion compensation. Indeed, the reliable improvement of RMSREs for NAA at all noise levels indicates that motion detection works accurately even at low SNR. The fluctuations in efficiency of FID-A+FiTAID, as visible for Glx and Ins, thus can be expected to be rather related to generally worse fitting efficiency at such high noise levels.
A limitation of this study should be noted: synthetically generated distortions do not include stronger eddy-currents and line broadening at higher b-values.
Conclusion
Using the novel motion-compensation scheme allows for more accurate estimation of diffusion at high b-values where the water reference signal may have substantially decayed and also macromolecular signals may often not be available for amplitude rescaling. It may thus promote a more accurate quantification of cellular parameters.Acknowledgements
Supported by the Swiss National Science Foundation (SNSF #188142 and #202962).References
- Döring A, Adalid V, Boesch C and Kreis R. Diffusion-weighted magnetic resonance spectroscopy boosted by simultaneously acquired water reference signals. Magn Reson Med 2018, 80:2326–38.
- Najac C, Ligneul C, Branzoli F, Palombo M and Valette J. Best practices and tools for Diffusion MR Spectroscopy - Pregame Fitting Challenge 2021, https://github.com/dwmrshub/pregame-workshop-2021.
- Simpson R, Devenyi GA, Jezzard P, Hennessy TJ and Near J. Advanced processing and simulation of MRS data using the FID appliance (FID‐A) - An open source, MATLAB‐based toolkit. Magn Reson Med 2017, 77:23–33.
- Adalid V, Döring A, Kyathanahally SP, Bolliger CS, Boesch C and Kreis R. Fitting interrelated datasets: metabolite diffusion and general lineshapes. MAGMA 2017, 30:429–48.
- Şimşek K, Döring A, Pampel A, Möller HE and Kreis R. Diffusion-weighted MRS at short TE using a Connectom system: non-Gaussian metabolite diffusion and macromolecular signals in human brain. ISMRM 2020, #364.
- Near J, Edden R, Evans CJ, Paquin R, Harris A and Jezzard P. Frequency and phase drift correction of magnetic resonance spectroscopy data by spectral registration in the time domain. Magn Reson Med 2015, 73:44–50.
- Göçken M, Özçalıcı M, Boru A and Dosdoğru AT. Integrating metaheuristics and Artificial Neural Networks for improved stock price prediction. Expert Syst Appl 2016, 44:320–31.
Figures
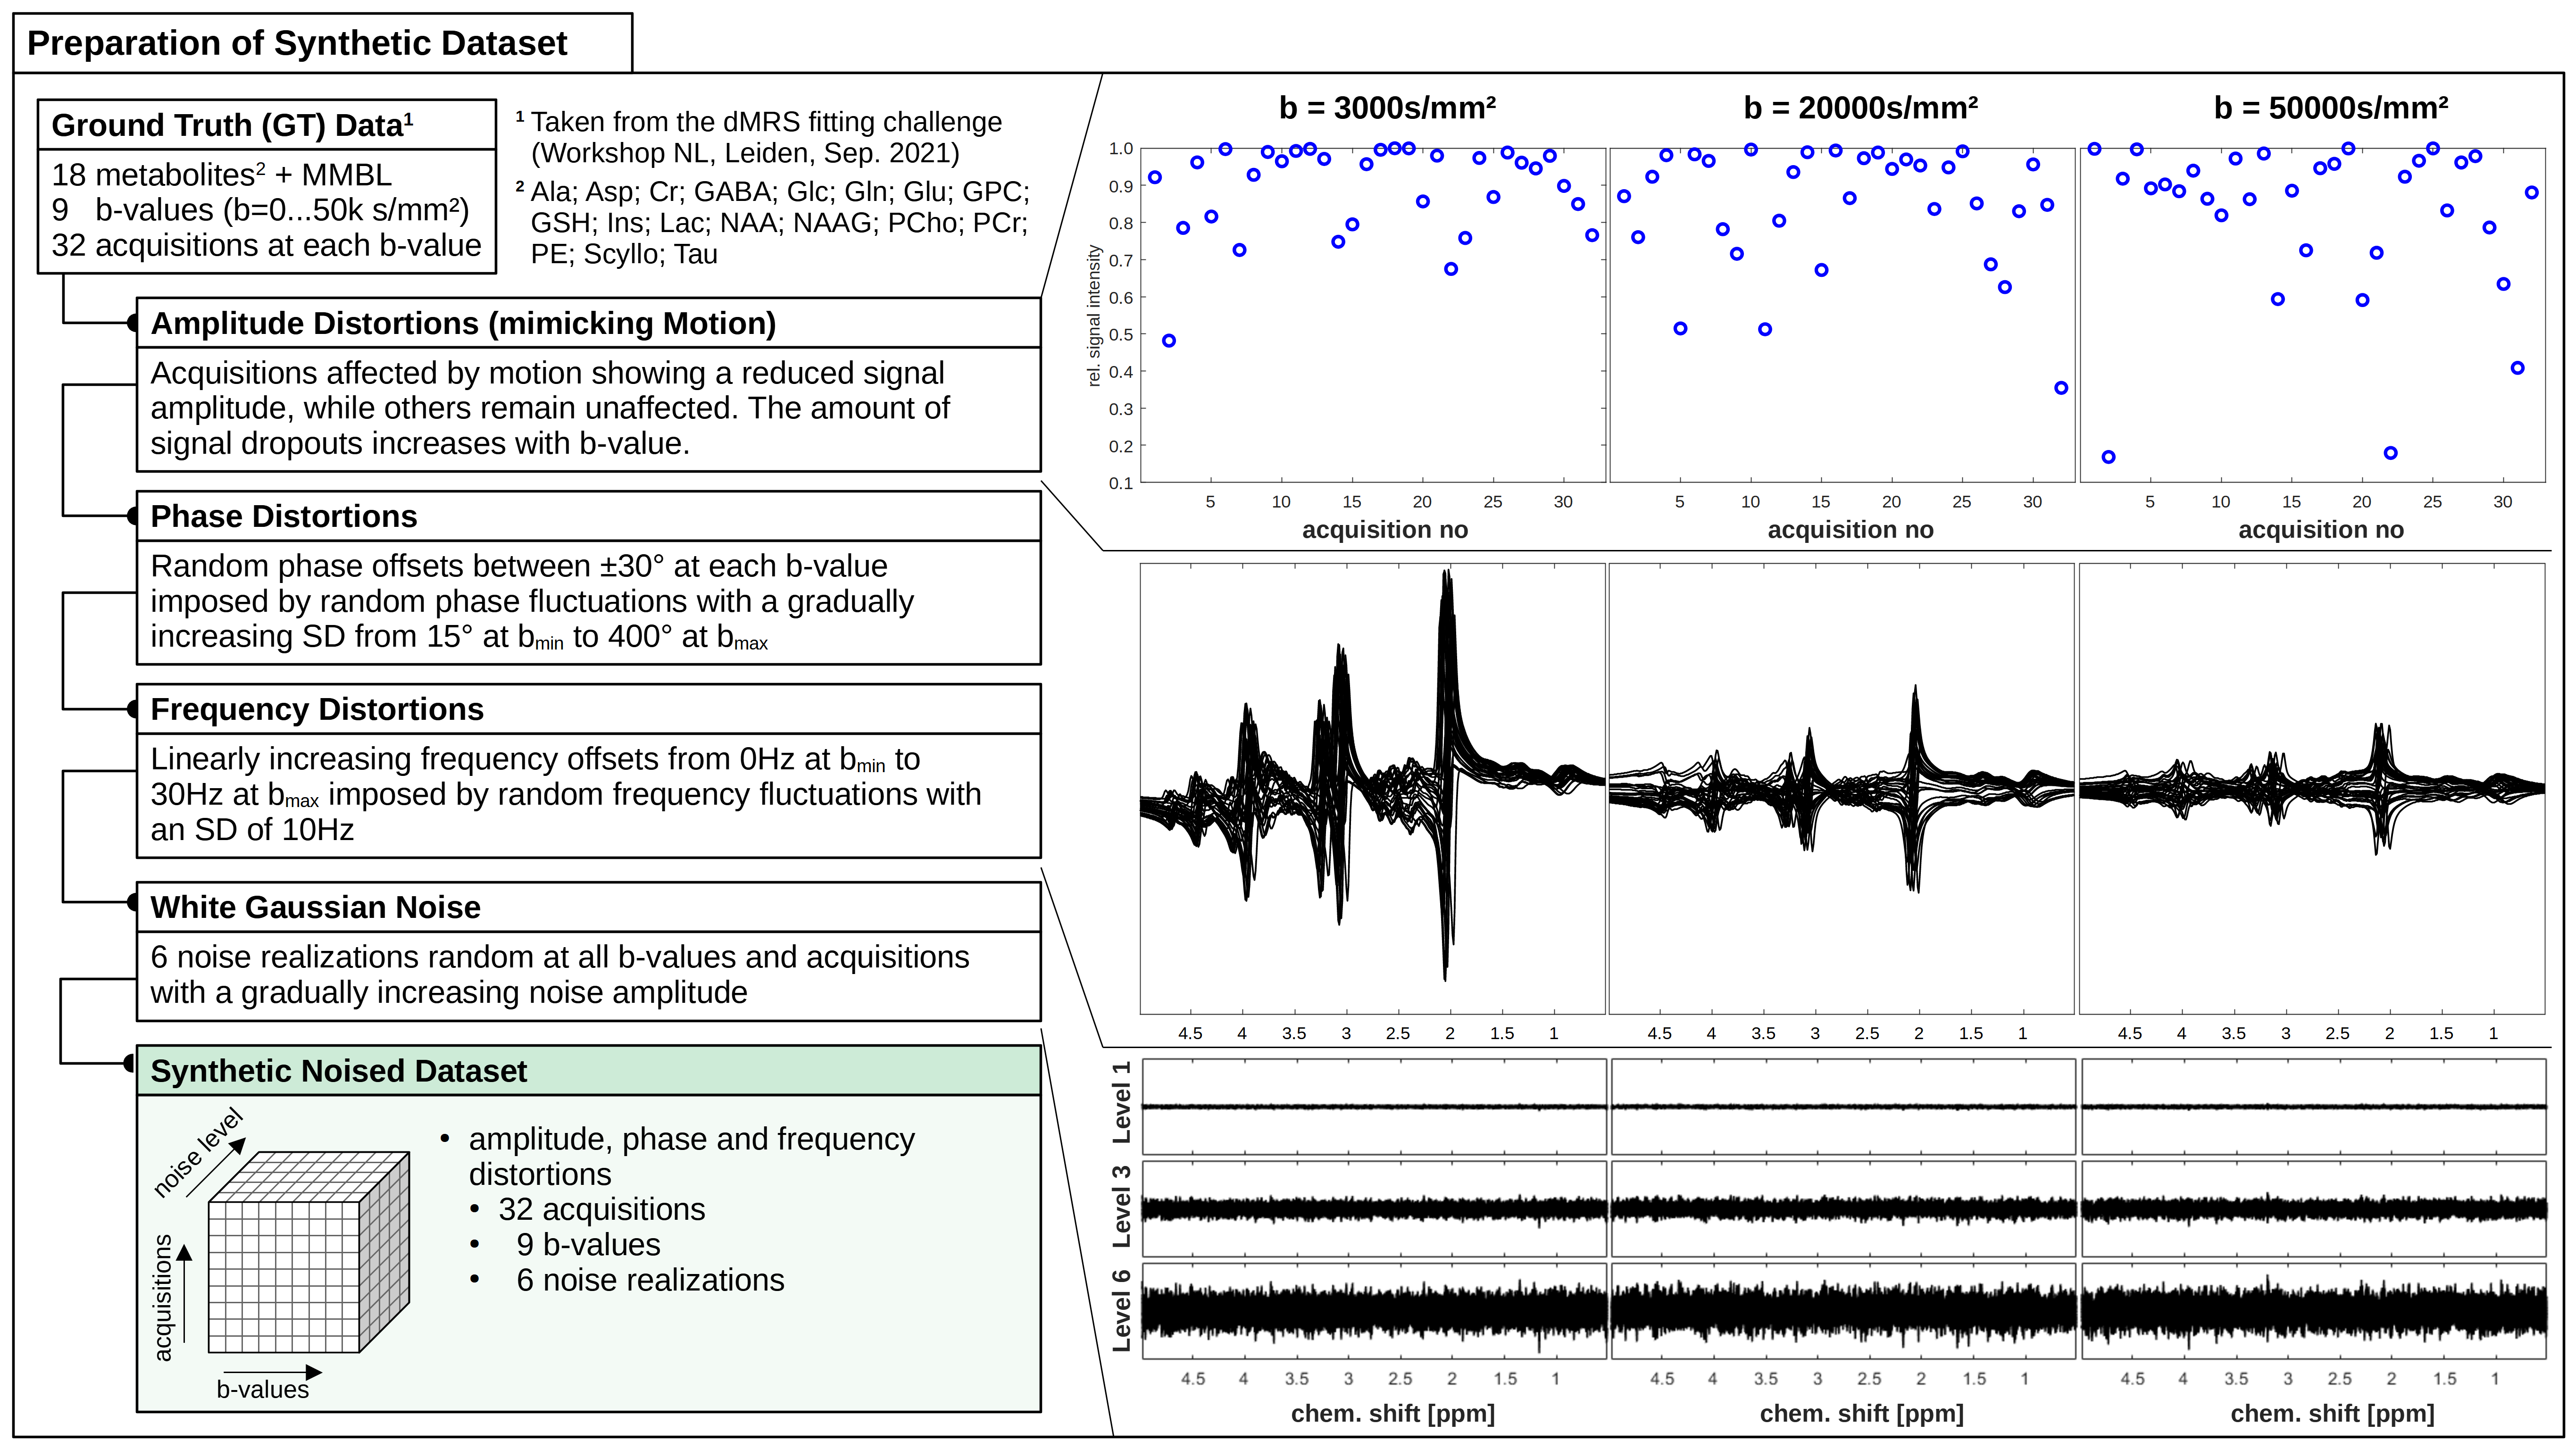
Figure 1: Left: 4 steps to add realistic distortions to GT diffusion
spectra at 9 b-values. Right: Distortions in step (i): Amplitude fluctuation
exemplarily shown at 3 b-values mimicking motion; step (ii + iii): phase and
frequency offsets agreeing with in vivo values; step (iv): White Gaussian noise
to create 6 noise realizations with gradually worsening SNR.
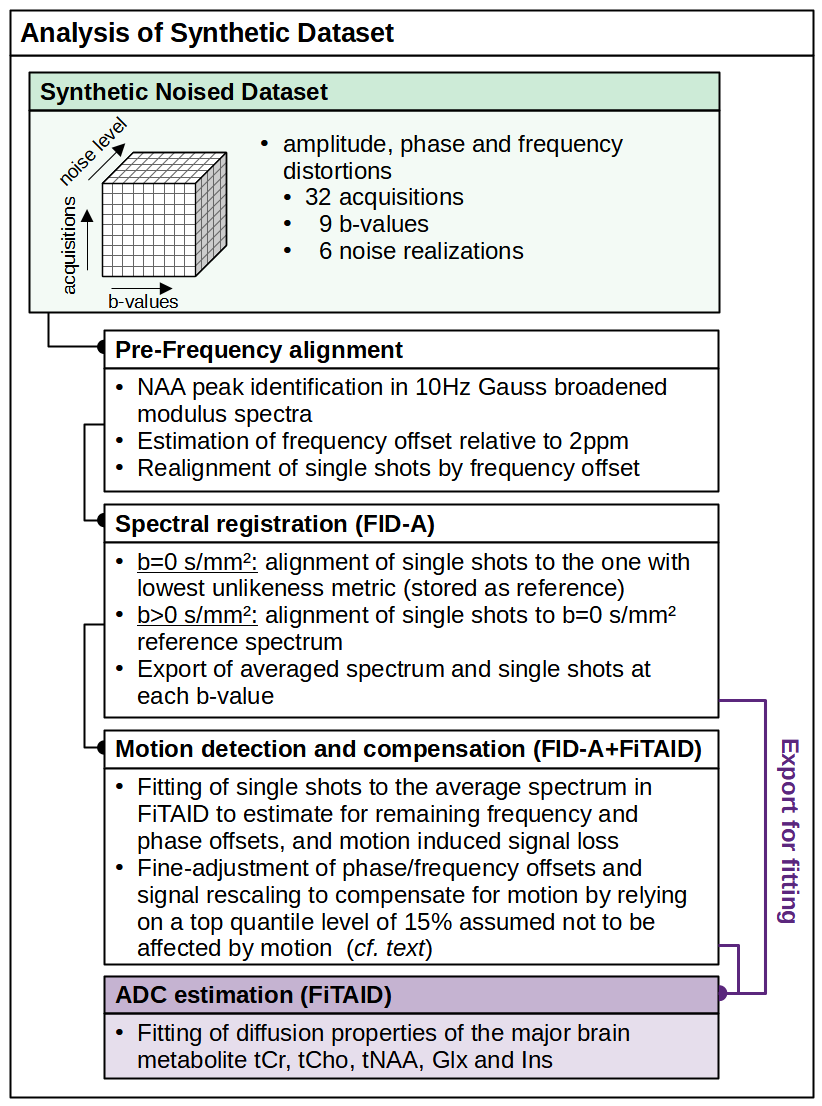
Figure 2: Data processing in 2 alternative routines: (i) FID-A uses
pre-frequency alignment and spectral registration and (ii) FID-A+FiTAID adds a
motion compensation routine. Diffusion property quantification of metabolites is
done in FiTAID relying on a bi-exponential prior (fitting project contained all
18 metabolite basis-sets and the macromolecular background).
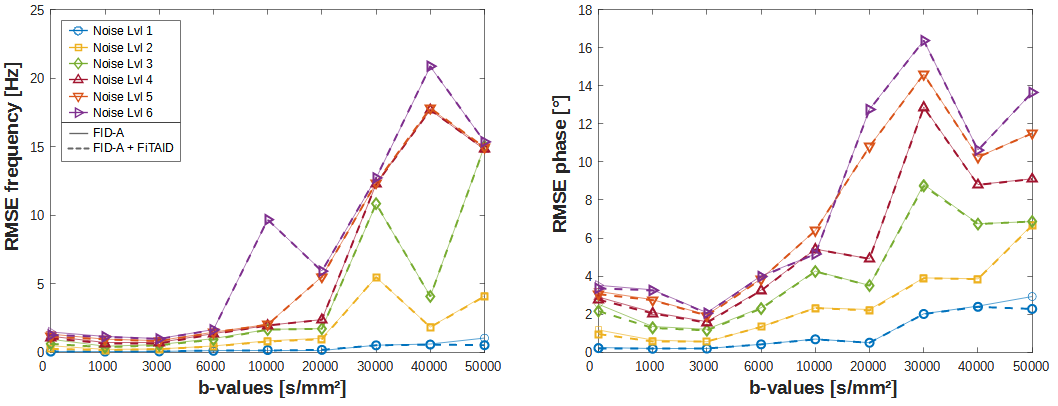
Figure 3: Root-Mean-Square-Errors (RMSEs) after FID-A (solid line) and
FID-A+FiTAID (dashed line) processing only shows nuanced differences at low
noise levels or b-values.
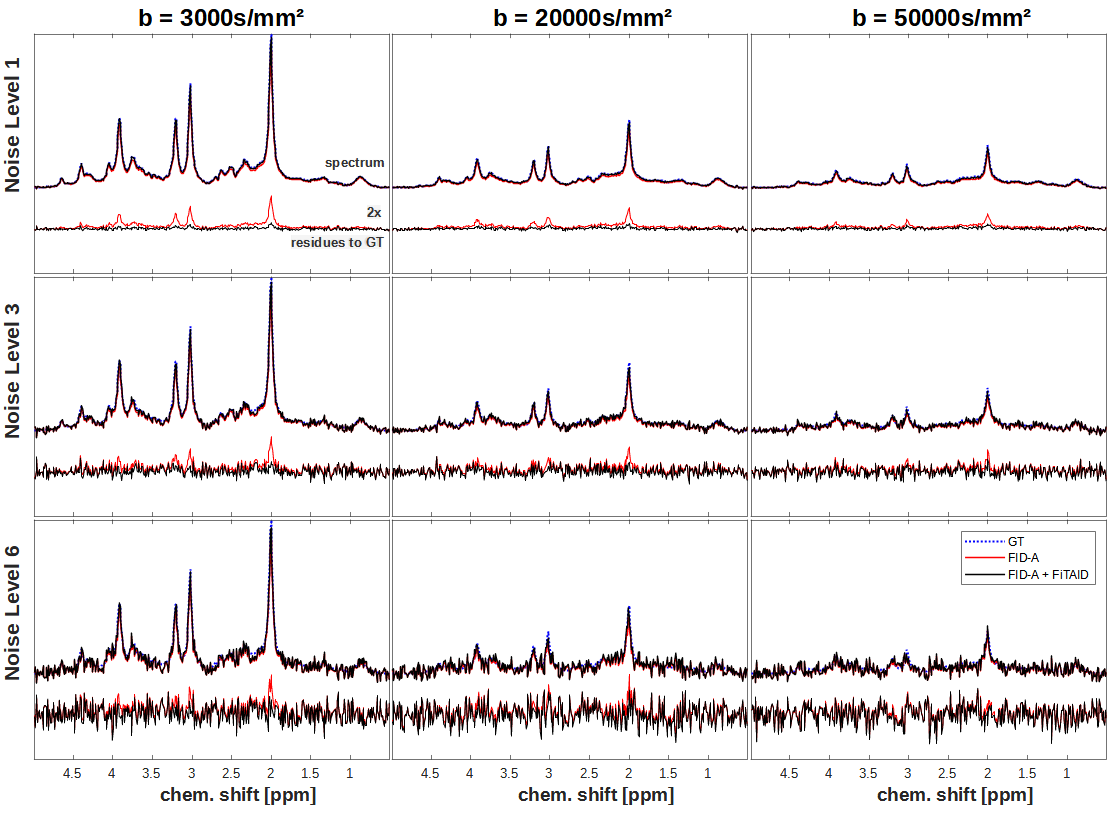
Figure 4: Spectral outcome exemplarily shown at 3 b-values comparing
FID-A and FID-A+FiTAID with residues to GT below (2x zoomed). Remaining signal
loss without motion compensation for FID-A yields higher residues.
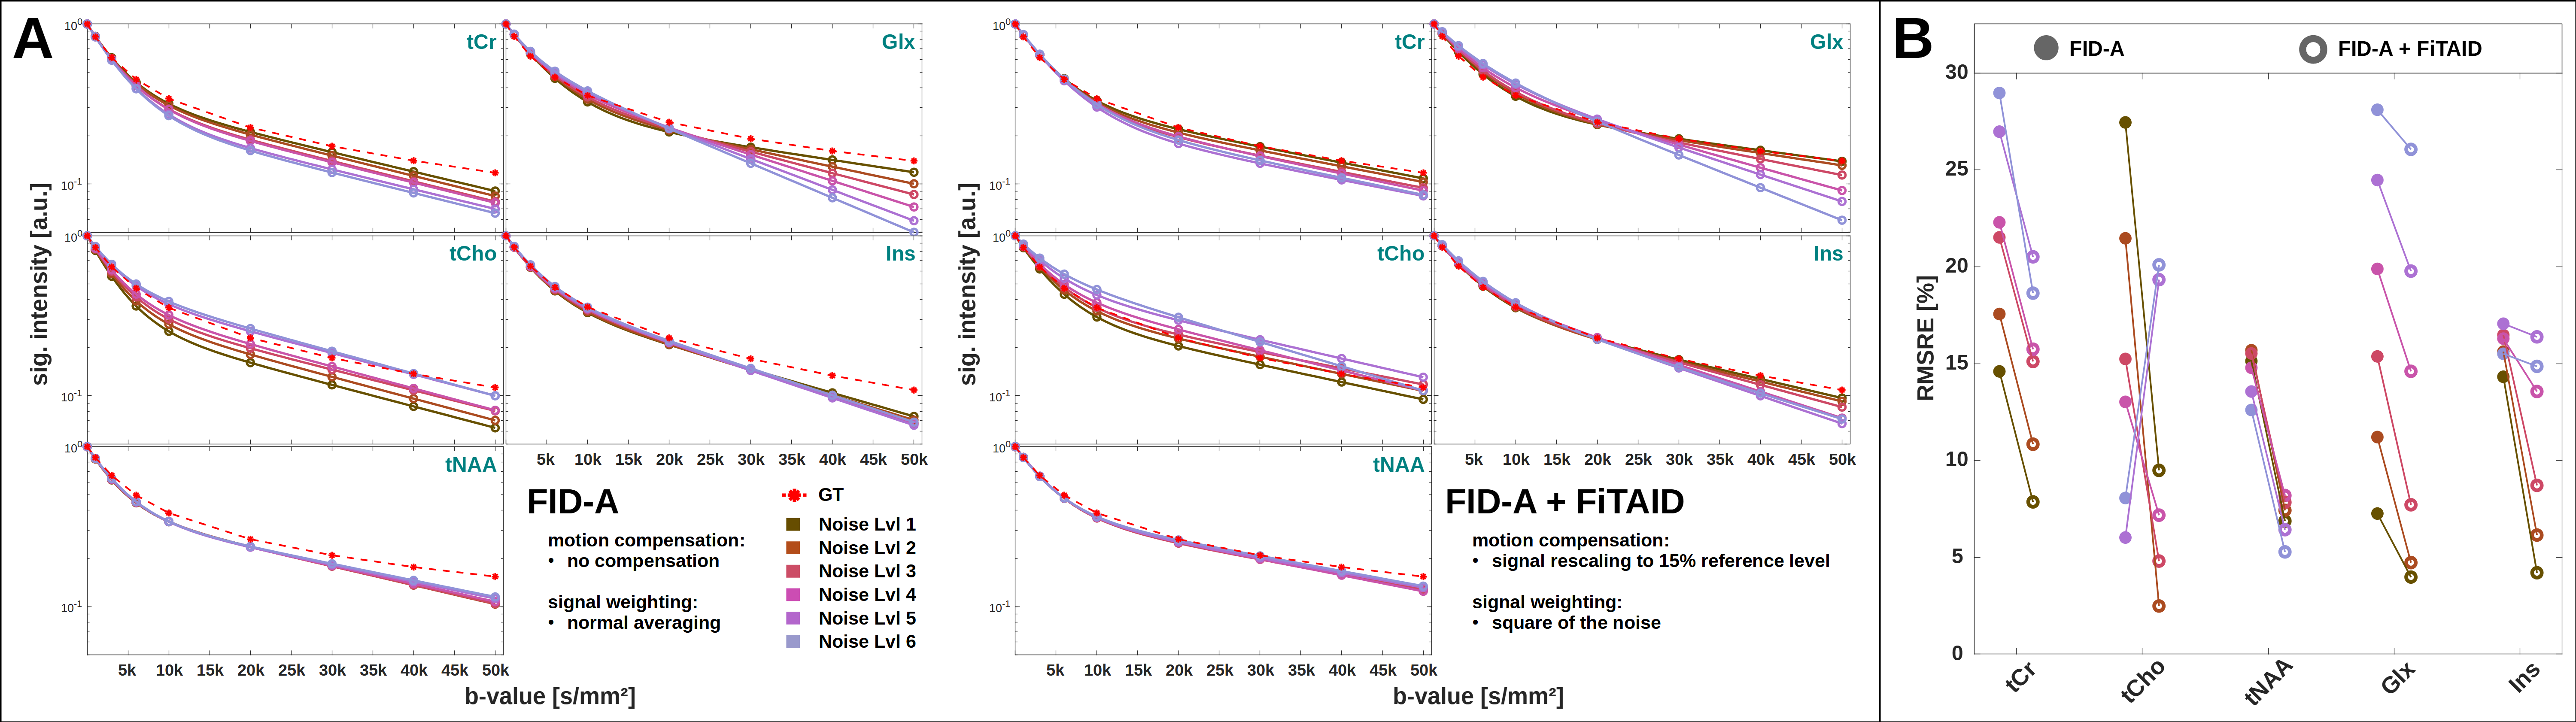
Figure 5: A) Diffusion decay after FID-A correction (no motion
compensation) and FID-A+FiTAID correction (with motion compensation) for the 5
major brain metabolites (energy: tCr, neuronal: tNAA, Glx, glial: tCho, Ins).
B) Root-Mean-Square-Relative-Error (RMSRE) showing a prominent improvement with motion compensation
applied in FID-A+FiTAID.
DOI: https://doi.org/10.58530/2022/1078