1077
The effect of the glutamate response function on detection sensitivity for functional MRS: a simulation study1Department of Radiology and Nuclear Medicine, Amsterdam University Medical Centers, Amsterdam, Netherlands, 2Sir Peter Mansfield Imaging Centre, School of Physics and Astronomy, University of Nottingham, Nottingham, United Kingdom, 3Department of Biomedical Engineering and Physics, Amsterdam University Medical Centers, Amsterdam, Netherlands, 4C.J. Gorter Center for High-Field MRI, Department of Radiology, Leiden University Medical Center, Leiden, Netherlands
Synopsis
fMRS stimulation paradigms and analysis strategies are highly heterogeneous, partially due to lack of knowledge of the underlying metabolic response function. To better understand the potential consequences of analysis methods, this simulation study evaluates the effect of different glutamate response functions (GRFs) and binning strategies. As the GRF becomes more delayed, analyzing bins from spectra directly after ‘task’ onset results in underestimation of the true change. In moving average analyses, the fitted time-courses co-varied significantly with the input glutamate time-course. Future simulation studies will expand on other variable sources, such as habituation and hemodynamic effects, and macromolecule fitting procedures.
Introduction
Functional MR Spectroscopy (fMRS) is a promising technique to assess dynamic changes in neurometabolism, such as stimulus-induced changes in the neurometabolites glutamate and GABA. Despite recent interests in the neuroscientific and clinical application of fMRS, little is known about the response function characteristics of these neurometabolites1. fMRS stimulation paradigms and analysis strategies are therefore highly heterogeneous, since it is unclear how to maximise detection sensitivity to underlying metabolic changes. For example, under the assumption that the response is slow to rise, several studies have analysed only the second half of spectra of a stimulus block2,3,4, whereas others discard only the first averages during which the metabolite concentration is presumably unstable5. A better grasp of the relation between the response function and analysis strategies would allow us to better understand the potential consequences of such strategies. Here, we use simulations to systematically evaluate the effect of multiple hypothetical glutamate response functions (GRFs) and common binning strategies on spectral fitting and the ability to discern task conditions.Methods
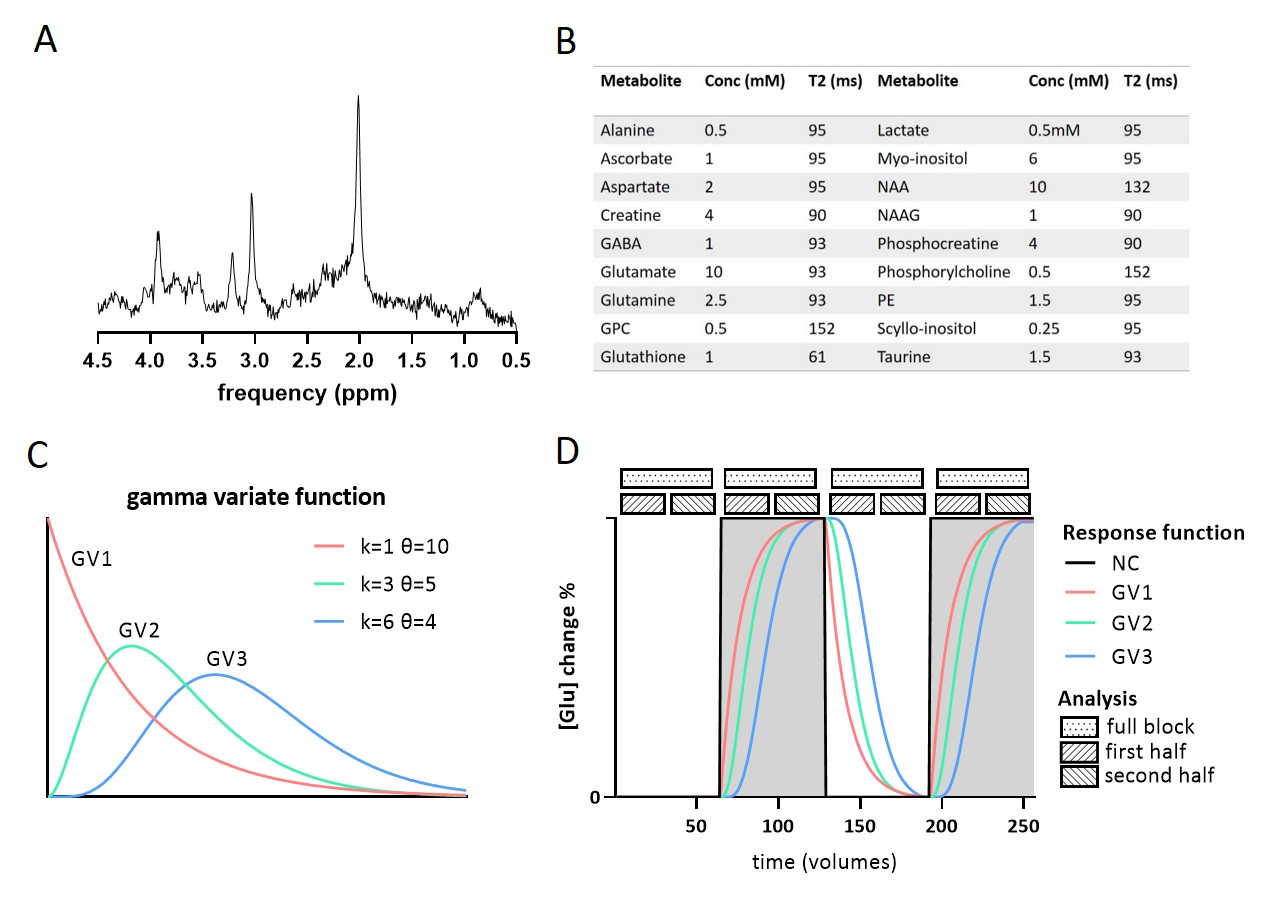
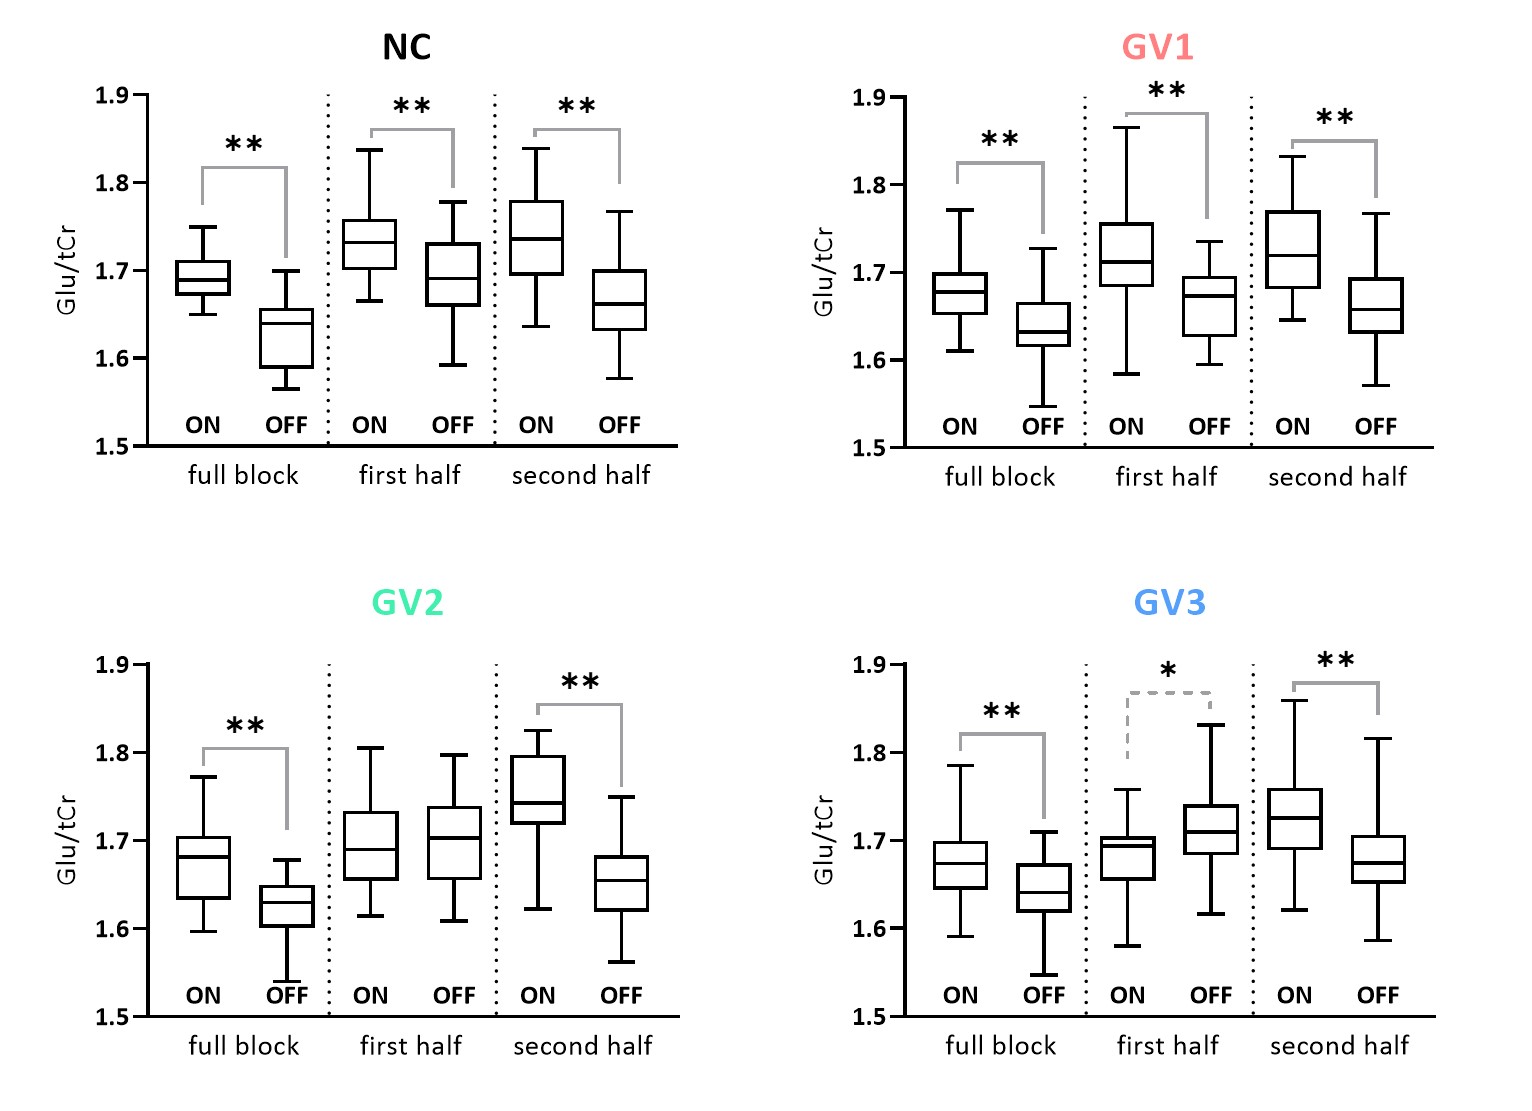
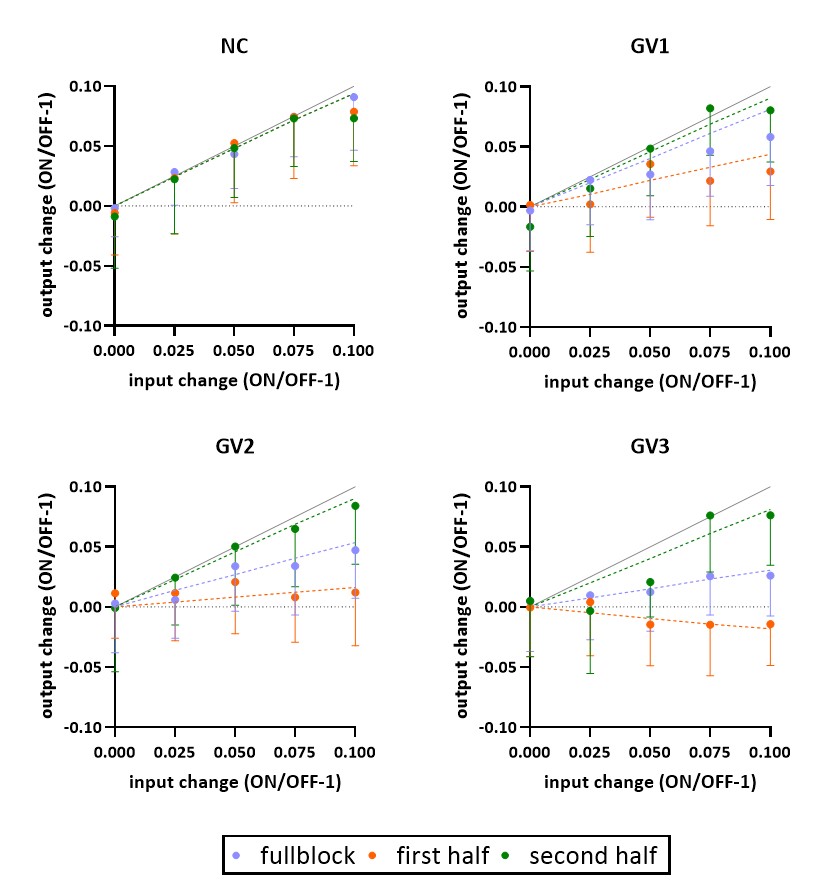
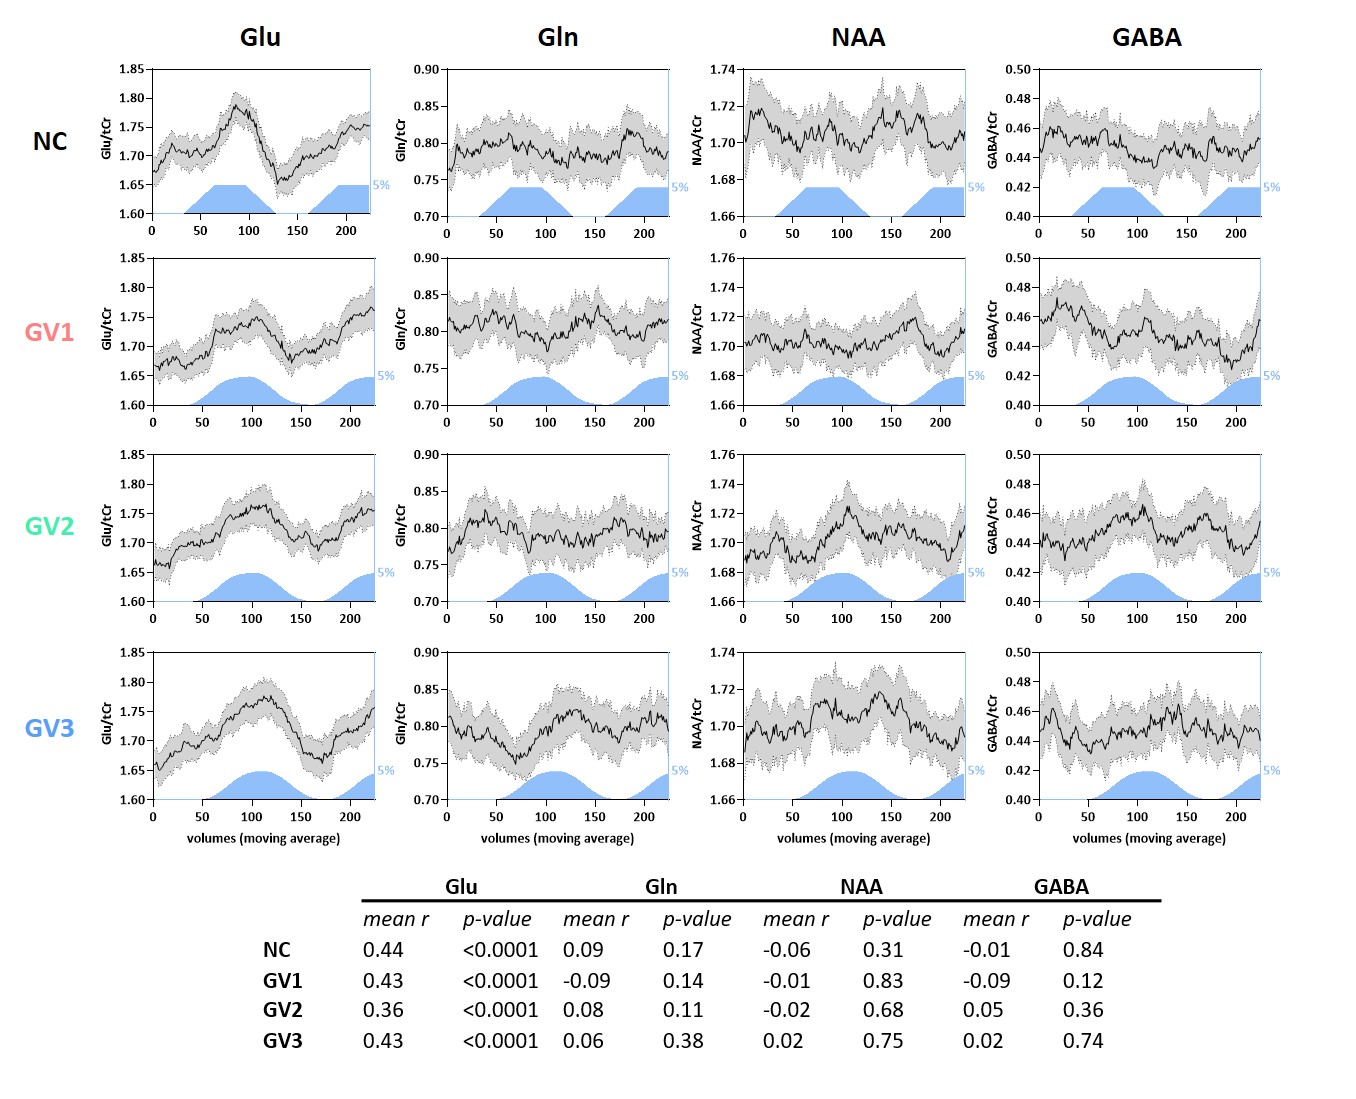
Data generation: Using FID-A6, ‘brain-like’ 1H-MRS spectra were simulated for a 7T sLASER sequence (TE=34ms; BW=4000Hz; np=2048). We included 18 metabolites7 and a measured macromolecular baseline (Figure 1).The simulated “experimental design” modulation followed a boxcar input function (OFF-ON-OFF-ON), with a block size of 64 signal averages (NSA). Glutamate concentration increased by either 0%, 2.5%, 5%, 7.5% or 10% during the ON blocks, in line with the magnitude of changes reported in literature1. To simulate the effect of multiple GRFs, the input function was convolved with 3 gamma variate (GV) functions with different shape (k) and scale (θ) parameters (GV1: k=1,θ=10; GV2: k=3,θ=5; GV3: k=6,θ=4) and compared to no convolution (NC) (Figure 1). A 300s response duration was assumed, in line with reported group averaged time courses2. Lorentzian line broadening (same for ON and OFF blocks) and random complex Gaussian noise were applied using FID-A to match typical in vivo spectral quality. To assess the stability, simulations were repeated 30 times, resulting in 30 different time-series of 256 spectra each. We compared four analysis approaches (Figure 1), by averaging the spectra of the 1) full block (NSA=2x64), 2) first half (NSA=2x32), or 3) second half (NSA=2x32) of the ON and OFF blocks respectively, or 4) by taking a moving average (window size 32).
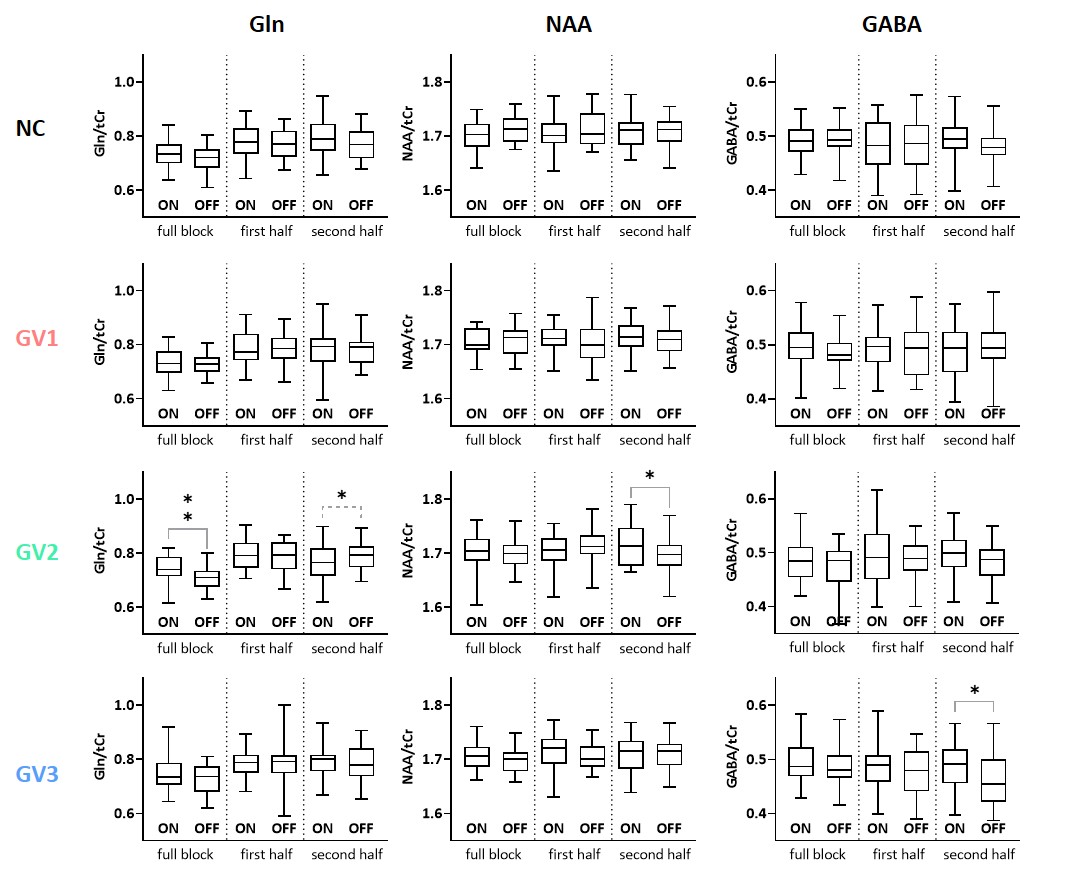
Data analysis: Following binning, all resulting spectra were fitted with LCModel8 to estimate metabolite levels (normalized to tCr). Approach 1-3: A paired t-test (ɑ=0.05) was used to test ON-OFF differences with a 5% Glu change for Glu (true positive), glutamine, NAA and GABA (false positives). Finally, the mean ON-OFF ratio was visualized for noise-included vs. noise-free simulations. Approach 4: The correlation coefficient of the output time-course and the (moving-average adjusted) ground truth time-course was calculated and a one-sample test was used to evaluate significance for the four metabolites.
Results
A simulated spectrum (NSA=32) is shown in Figure 1, with the following spectral quality (as obtained from LCModel): linewidth=10Hz; SNR=31; CRLB glutamate=3%.Whereas the ‘full block’ and ‘second half’ methods could detect a significant ON>OFF difference for all GRFs, the ‘first half’ method detected no difference for GV2, and an opposite effect (OFF>ON) for GV3 (Figure 2). Moreover, for GV2 and GV3, significant changes in other metabolites were erroneously observed (Figure 3). Noise-free simulations (Figure 4) across different input concentration changes follow the same behavior as in Figure 2, with the ‘second half’ providing the most precise estimation of Glu changes across the used GVs. In some cases, the addition of noise resulted in non-linear behavior of the concentration change estimates, within the limits of the number of iterations and the CRLB of the fit. For the moving average analysis, we found that the modulated Glu input time-course was significantly correlated with the measured Glu output time-course, but not with time-courses of other metabolites (Figure 5).
Discussion
Our findings show that if a non-convoluted GRF is incorrectly assumed, we underestimate the percentage change using block averaging. This is particularly true for the ‘first half’ method, which differed most from our simulated GRFs. LCModel was mostly able to stably fit mean Glu changes, within the limits of our simulated SNR, number of iterations and CRLBs. However, the erroneous detection of changes in metabolites other than Glu, i.e. for high concentration metabolites like NAA, indicates statistical rigour is required to prevent false positives. Notably, we simulated data with one type of GRF, and future analyses will assess the effect of habituation, as well as the possibility of Glu concentration changes below baseline. Moreover, potential BOLD effects on the linewidth during stimulation, and the effect of various macromolecule fitting procedures should be considered.Efforts in denoising fMRS time series9 as well as exploitation of dynamic fitting approaches could help maximize the detection sensitivity and robustness of future fMRS studies. In conclusion, our simulations allowed for flexible modeling of fMRS experiments, and could be used to carefully test experimental design and analysis choices.
Acknowledgements
This project has received funding from the Dutch Research Council (NWO, Veni: 016.196.153) and the LEaDing Fellows COFUND programme.References
[1] Mullins PG. Towards a theory of functional magnetic resonance spectroscopy (fMRS): A meta-analysis and discussion of using MRS to measure changes in neurotransmitters in real time. Scand J Psychol. 2018 Feb;59(1):91-103. doi: 10.1111/sjop.12411. PMID: 29356002.
[2] Bednařík P, Tkáč I, Giove F, DiNuzzo M, Deelchand DK, Emir UE, Eberly LE, Mangia S. Neurochemical and BOLD responses during neuronal activation measured in the human visual cortex at 7 Tesla. J Cereb Blood Flow Metab. 2015 Mar 31;35(4):601-10. doi: 10.1038/jcbfm.2014.233.
[3] Bednařík P, Tkáč I, Giove F, Eberly LE, Deelchand DK, Barreto FR, Mangia S. Neurochemical responses to chromatic and achromatic stimuli in the human visual cortex. J Cereb Blood Flow Metab. 2018 Feb;38(2):347-359. doi: 10.1177/0271678X17695291.
[4] Boillat Y, Xin L, van der Zwaag W, Gruetter R. Metabolite concentration changes associated with positive and negative BOLD responses in the human visual cortex: A functional MRS study at 7 Tesla. J Cereb Blood Flow Metab. 2020 Mar;40(3):488-500. doi: 10.1177/0271678X19831022.
[5] Ip IB, Emir UE, Parker AJ, Campbell J, Bridge H. Comparison of Neurochemical and BOLD Signal Contrast Response Functions in the Human Visual Cortex. J Neurosci. 2019 Oct 2;39(40):7968-7975. doi: 10.1523/JNEUROSCI.3021-18.2019.
[6] Simpson R, Devenyi GA, Jezzard P, Hennessy TJ, Near J. Advanced processing and simulation of MRS data using the FID appliance (FID-A)-An open source, MATLAB-based toolkit. Magn Reson Med. 2017 Jan;77(1):23-33. doi: 10.1002/mrm.26091.
[7] Deelchand DK, Iltis I, Henry PG. Improved quantification precision of human brain short echo-time (1) H magnetic resonance spectroscopy at high magnetic field: a simulation study. Magn Reson Med. 2014 Jul;72(1):20-5. doi: 10.1002/mrm.24892.
[8] Provencher SW. Estimation of metabolite concentrations from localized in vivo proton NMR spectra. Magn Reson Med. 1993 Dec;30(6):672-9. doi: 10.1002/mrm.1910300604.
[9] Rowland BC, Sreepada L, Lin AP. A comparison of denoising methods in dynamic MRS using pseudo-synthetic data. medRxiv doi:10.1101/2021.02.23.21252282Figures