1076
GABA-edited MEGA-PRESS at 3T: Does a measured MM background improve linear-combination modeling?
Helge Jörn Zöllner1,2, Yulu Song1,2, Steve C. N. Hui1,2, Peter B. Barker1,2, Richard A. E. Edden1,2, and Georg Oeltzschner1,2
1Russell H. Morgan Department of Radiology and Radiological Science, The Johns Hopkins University School of Medicine, Baltimore, MD, United States, 2F. M. Kirby Research Center for Functional Brain Imaging, Kennedy Krieger Institute, Baltimore, MD, United States
1Russell H. Morgan Department of Radiology and Radiological Science, The Johns Hopkins University School of Medicine, Baltimore, MD, United States, 2F. M. Kirby Research Center for Functional Brain Imaging, Kennedy Krieger Institute, Baltimore, MD, United States
Synopsis
Recent work identified a 'best practice' linear-combination modeling (LCM) strategy for GABA-edited spectra using parameterized basis functions for co-edited macromolecules. Here we introduce a measured macromolecular basis function to evaluate possible improvements in the modeling.
Introduction
The inhibitory neurotransmitter gamma-aminobutyric acid (GABA) is commonly studied with J-difference-edited MRS1. The edited 3-ppm signal contains co-edited signals from macromolecules (MM) and homocarnosine2 and is hence referred to as GABA+. Linear-combination modeling (LCM) uses metabolite basis spectra to maximize prior and is currently consensus-recommended for modeling the difference spectrum1, although the co-edited MM signals are poorly characterized. We therefore recently identified a 'best practice' strategy for MM parametrization, baseline flexibility, and fit range3. Here, we compare two strategies for modeling GABA-edited spectra: using 1) the recently identified 'best practice' MM parametrization and 2) an experimentally derived MM basis function. A large, publicly available GABA-edited MRS dataset was used to evaluate the performance of the modeling strategies with the open-source package 'Osprey'4.Methods
A series of GABA-edited MEGA-PRESS spectra were acquired with a pre-inversion module (Philips 3T Ingenia; TR/TE = 2000/68 ms; inversion times TI = {500…650} ms in 50-ms intervals; 256 transients; 27-ml cubic voxel volume in medial parietal lobe; including water reference data) to minimize metabolite contributions to the spectrum (Figure 1A). A preliminary macromolecular background spectrum was created by averaging data from 3 subjects with the optimal TI of 650 ms (participants were scanned twice with the same parameters as above to increase the signal-to-noise ratio). 61 MEGA-PRESS metabolite spectra from a recent multi-site study5 were included (Philips 3T scanners; similar parameters as above) in the model comparison.Raw data were coil-combined and eddy-current-corrected based on the water reference. Individual averages were aligned using robust spectral registration6. Residual metabolite signals were removed by an LCM approach7 including two basis functions (NAA and NAAG) to create 'cleaned' MM difference spectra, which were then fit with a cubic B-spline (knot spacing = 0.1 ppm) to generate noise-free MM basis functions.
61 Philips 3T MEGA-PRESS data from the Big GABA dataset5 were then modeled using two different strategies to account for co-edited macromolecular signals. The first strategy uses a composite basis function consisting of co-edited 0.93-ppm (MM0.93) and 3-ppm signals (MM3co),i.e. MM0.93 and MM3co basis functions added with a fixed 3:2 amplitude ratio (Figure 1B). The second uses the experimental MM (MMexp) baseline derived by averaging the spline models of the measured MM spectra (Figure 1C). Osprey’s default basis set (including 17 metabolites) was used for modeling, generated with localized 2D density-matrix simulations. Both LCM strategies were performed with a 0.55 ppm baseline knot spacing and a model range between 0.5 and 4 ppm.
GABA+ and GABA levels (expressed as ratios to total creatine from the edit-OFF spectrum) were calculated for both strategies. The maximal amplitude and the standard deviation (SD) of the model residuals were used as a measure of fit quality. The visualization and statistical analysis were performed in the R-based package SpecVis8. A paired t-test was used to infer any differences between both modeling strategies.
Results
Metabolite-nulled MM difference spectra (Figure 1C) show distinct, relatively broad signals between 1.9 and 2.7 ppm, presumably due to both direct and indirect effects of the 1.9-ppm editing pulse. While the co-edited MM signals at 0.93 and 3 ppm appear consistent, there is considerable variance between 1 and 1.9 ppm, likely originating from co-edited lipids.All 61 MEGA-PRESS spectra were successfully quantified with both strategies. Distinct modeling patterns are apparent in the mean modeling results (Figure 2). Amplitude and SD of the fit residuals appear smaller when MMexp is included in the model, specifically in the region under the NAA methyl singlet between 1.85 and 2.3 ppm, with the baseline contribution substantially lower between 2 and 3 ppm. Notably, the MM3co peak appears to be more asymmetric for MMexp leading to a higher agreement between data and model on the right side of the 3-ppm peak.
GABA+/tCr and GABA/tCr estimates agree well between both strategies (R2 = 0.8 for GABA+/tCr and R2 = 0.64 for GABA/tCr), with comparable means and coefficients of variation. The interquartile ranges (IQR) were smaller for the MMexp strategy indicating a sharper data distribution (Figure 3).
The amplitude of the fit residuals was significantly reduced for the MMexp strategy (p < .001) compared to the parameterized MM strategy, while the residual’s SD remained similar (Figure 4).
Discussion
Expert consensus suggests that a well-defined (ideally experimentally measured) MM basis function is needed for reliable quantification of unedited MRS with LCM9. We here extend this recommendation to GABA-edited MRS and present a preliminary comparison between two strategies using parametrized and measured MM signals.The measured MM background reduced model residuals, suggesting a more appropriate model, particularly around the NAA singlet signal. However, we found no differences in the GABA+/tCr estimates between the two strategies.
The co-edited lipid contamination between 1 and 2 ppm is a source of variability, and further MM spectra need to be acquired to substantiate our findings.
Conclusion
Initial results suggest that including an experimentally derived MM basis function improves modeling quality of GABA-edited MRS. However, GABA+ and GABA estimates agree well with our ‘best practice’ strategy using parameterized MM basis.Acknowledgements
This work has been supported by NIH grants P41EB015909, R01EB016089, R01EB023963, R21AG060245, R01EB028259 and R00AG062230.References
- 1.Choi IY, Andronesi OC, Barker P, et al. Spectral editing in 1H magnetic resonance spectroscopy: Experts’ consensus recommendations. NMR Biomed. 2021;n/a(n/a):e4411. doi:https://doi.org/10.1002/nbm.4411
- Henry PG, Dautry C, Hantraye P, Bloch G. Brain gaba editing without macromolecule contamination. Magn Reson Med. 2001;45(3):517-520. doi:10.1002/1522-2594(200103)45:3<517::AID-MRM1068>3.0.CO;2-63.
- Zöllner HJ, Tapper S, Hui SCN, Barker PB, Edden RAE, Oeltzschner G. Comparison of linear combination modeling strategies for edited magnetic resonance spectroscopy at 3 T. NMR Biomed. n/a(n/a):e4618. doi:10.1002/nbm.46184.
- Oeltzschner G, Zöllner HJ, Hui SCN, et al. Osprey: Open-source processing, reconstruction & estimation of magnetic resonance spectroscopy data. J Neurosci Methods. 2020;343:108827. doi:10.1016/j.jneumeth.2020.1088275.
- Mikkelsen M, Barker PB, Bhattacharyya PK, et al. Big GABA: Edited MR spectroscopy at 24 research sites. NeuroImage. 2017;159:32-45. doi:10.1016/j.neuroimage.2017.07.0216.
- Mikkelsen M, Tapper S, Near J, Mostofsky SH, Puts NAJ, Edden RAE. Correcting frequency and phase offsets in MRS data using robust spectral registration. NMR Biomed. Published online July 2020:e4368. doi:10.1002/nbm.43687.
- Hui SCN, Gong T, Zöllner HJ, et al. The Macromolecular MR Spectrum in Healthy Aging.; 2021:2021.08.27.457961. doi:10.1101/2021.08.27.4579618.
- Zöllner HJ, Považan M, Hui SCN, Tapper S, Edden RAE, Oeltzschner G. Comparison of different linear-combination modeling algorithms for short-TE proton spectra. NMR Biomed. 2021;n/a(n/a):e4482. doi:https://doi.org/10.1002/nbm.44829.
- Cudalbu C, Behar KL, Bhattacharyya PK, et al. Contribution of macromolecules to brain 1H MR spectra: Experts’ consensus recommendations. NMR Biomed. 2021;34(5):e4393. doi:10.1002/nbm.4393
Figures
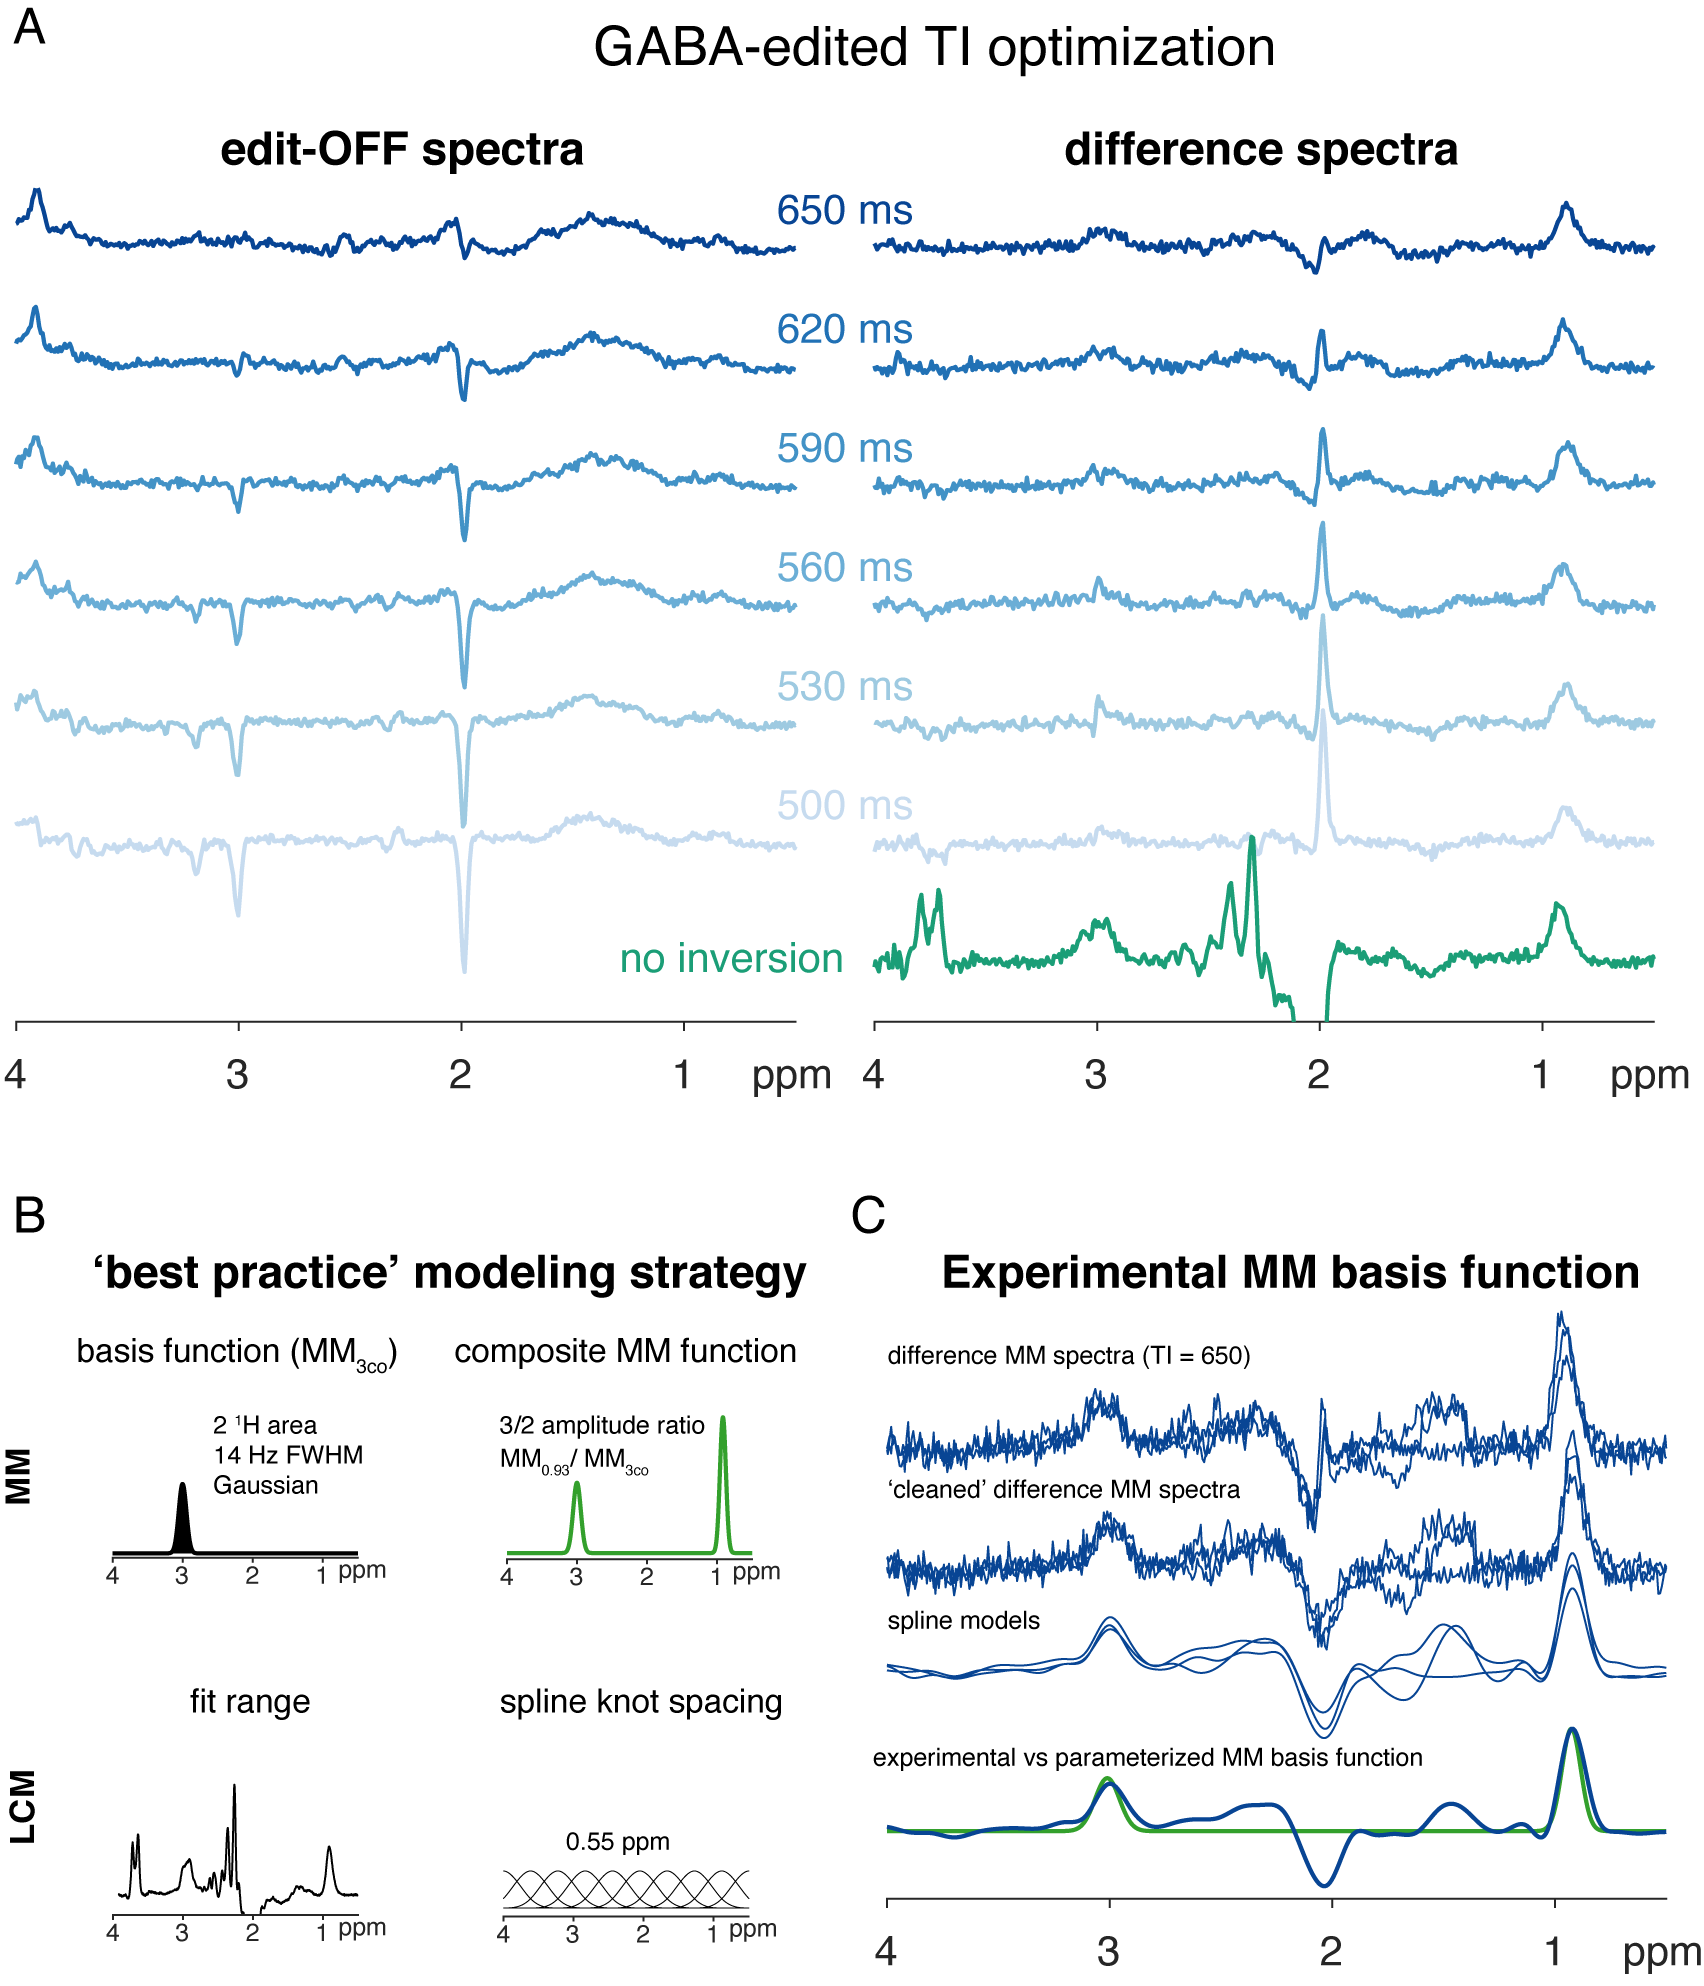
(A) TI optimization to achieve metabolite-nulled GABA-edited difference spectra (B) ‘Best practice’ approach to quantify GABA-edited MRS with LCM (C) Processing of GABA-edited MM spectra and comparison of parametrized and measured MM basis functions.
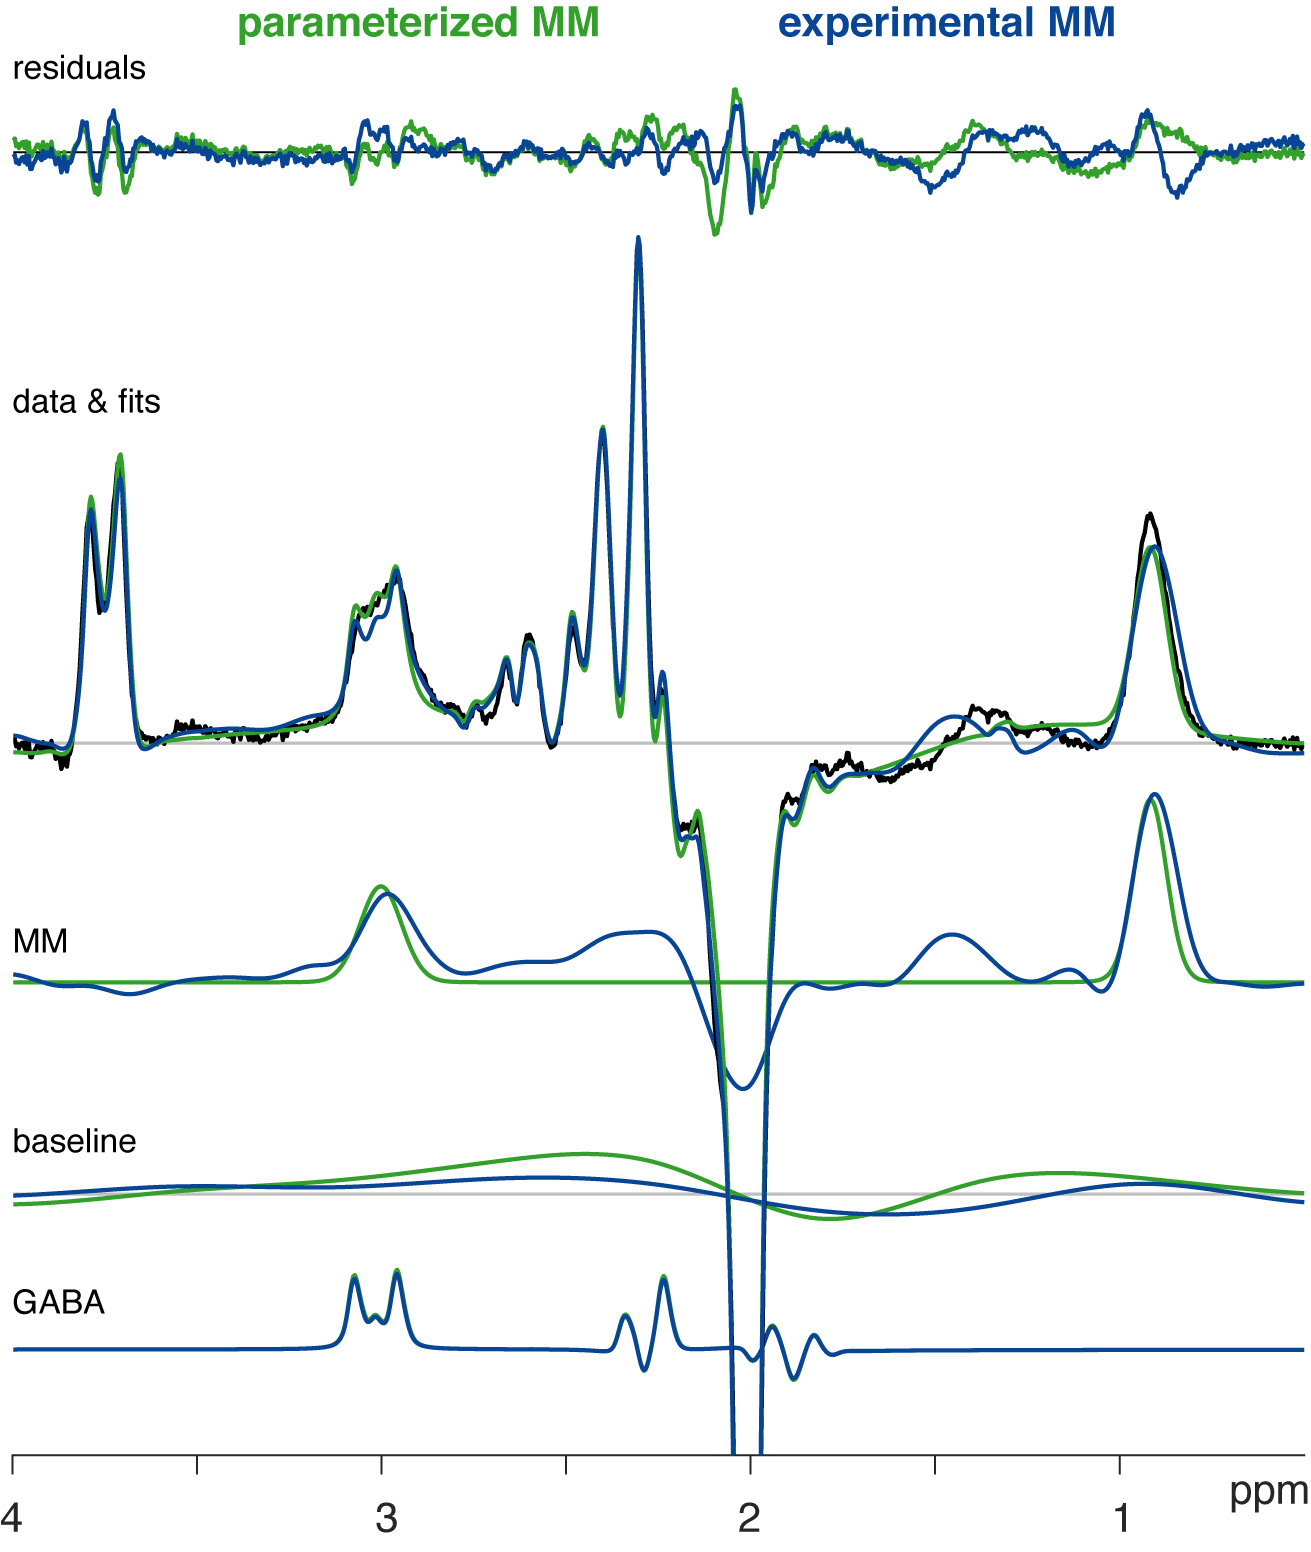
Visual overview of the mean residual, fits, and data of the different modeling strategies (color-coded). The mean estimates of MM, baseline, and GABA are also depicted. Note that the mean GABA estimates overlap highly.
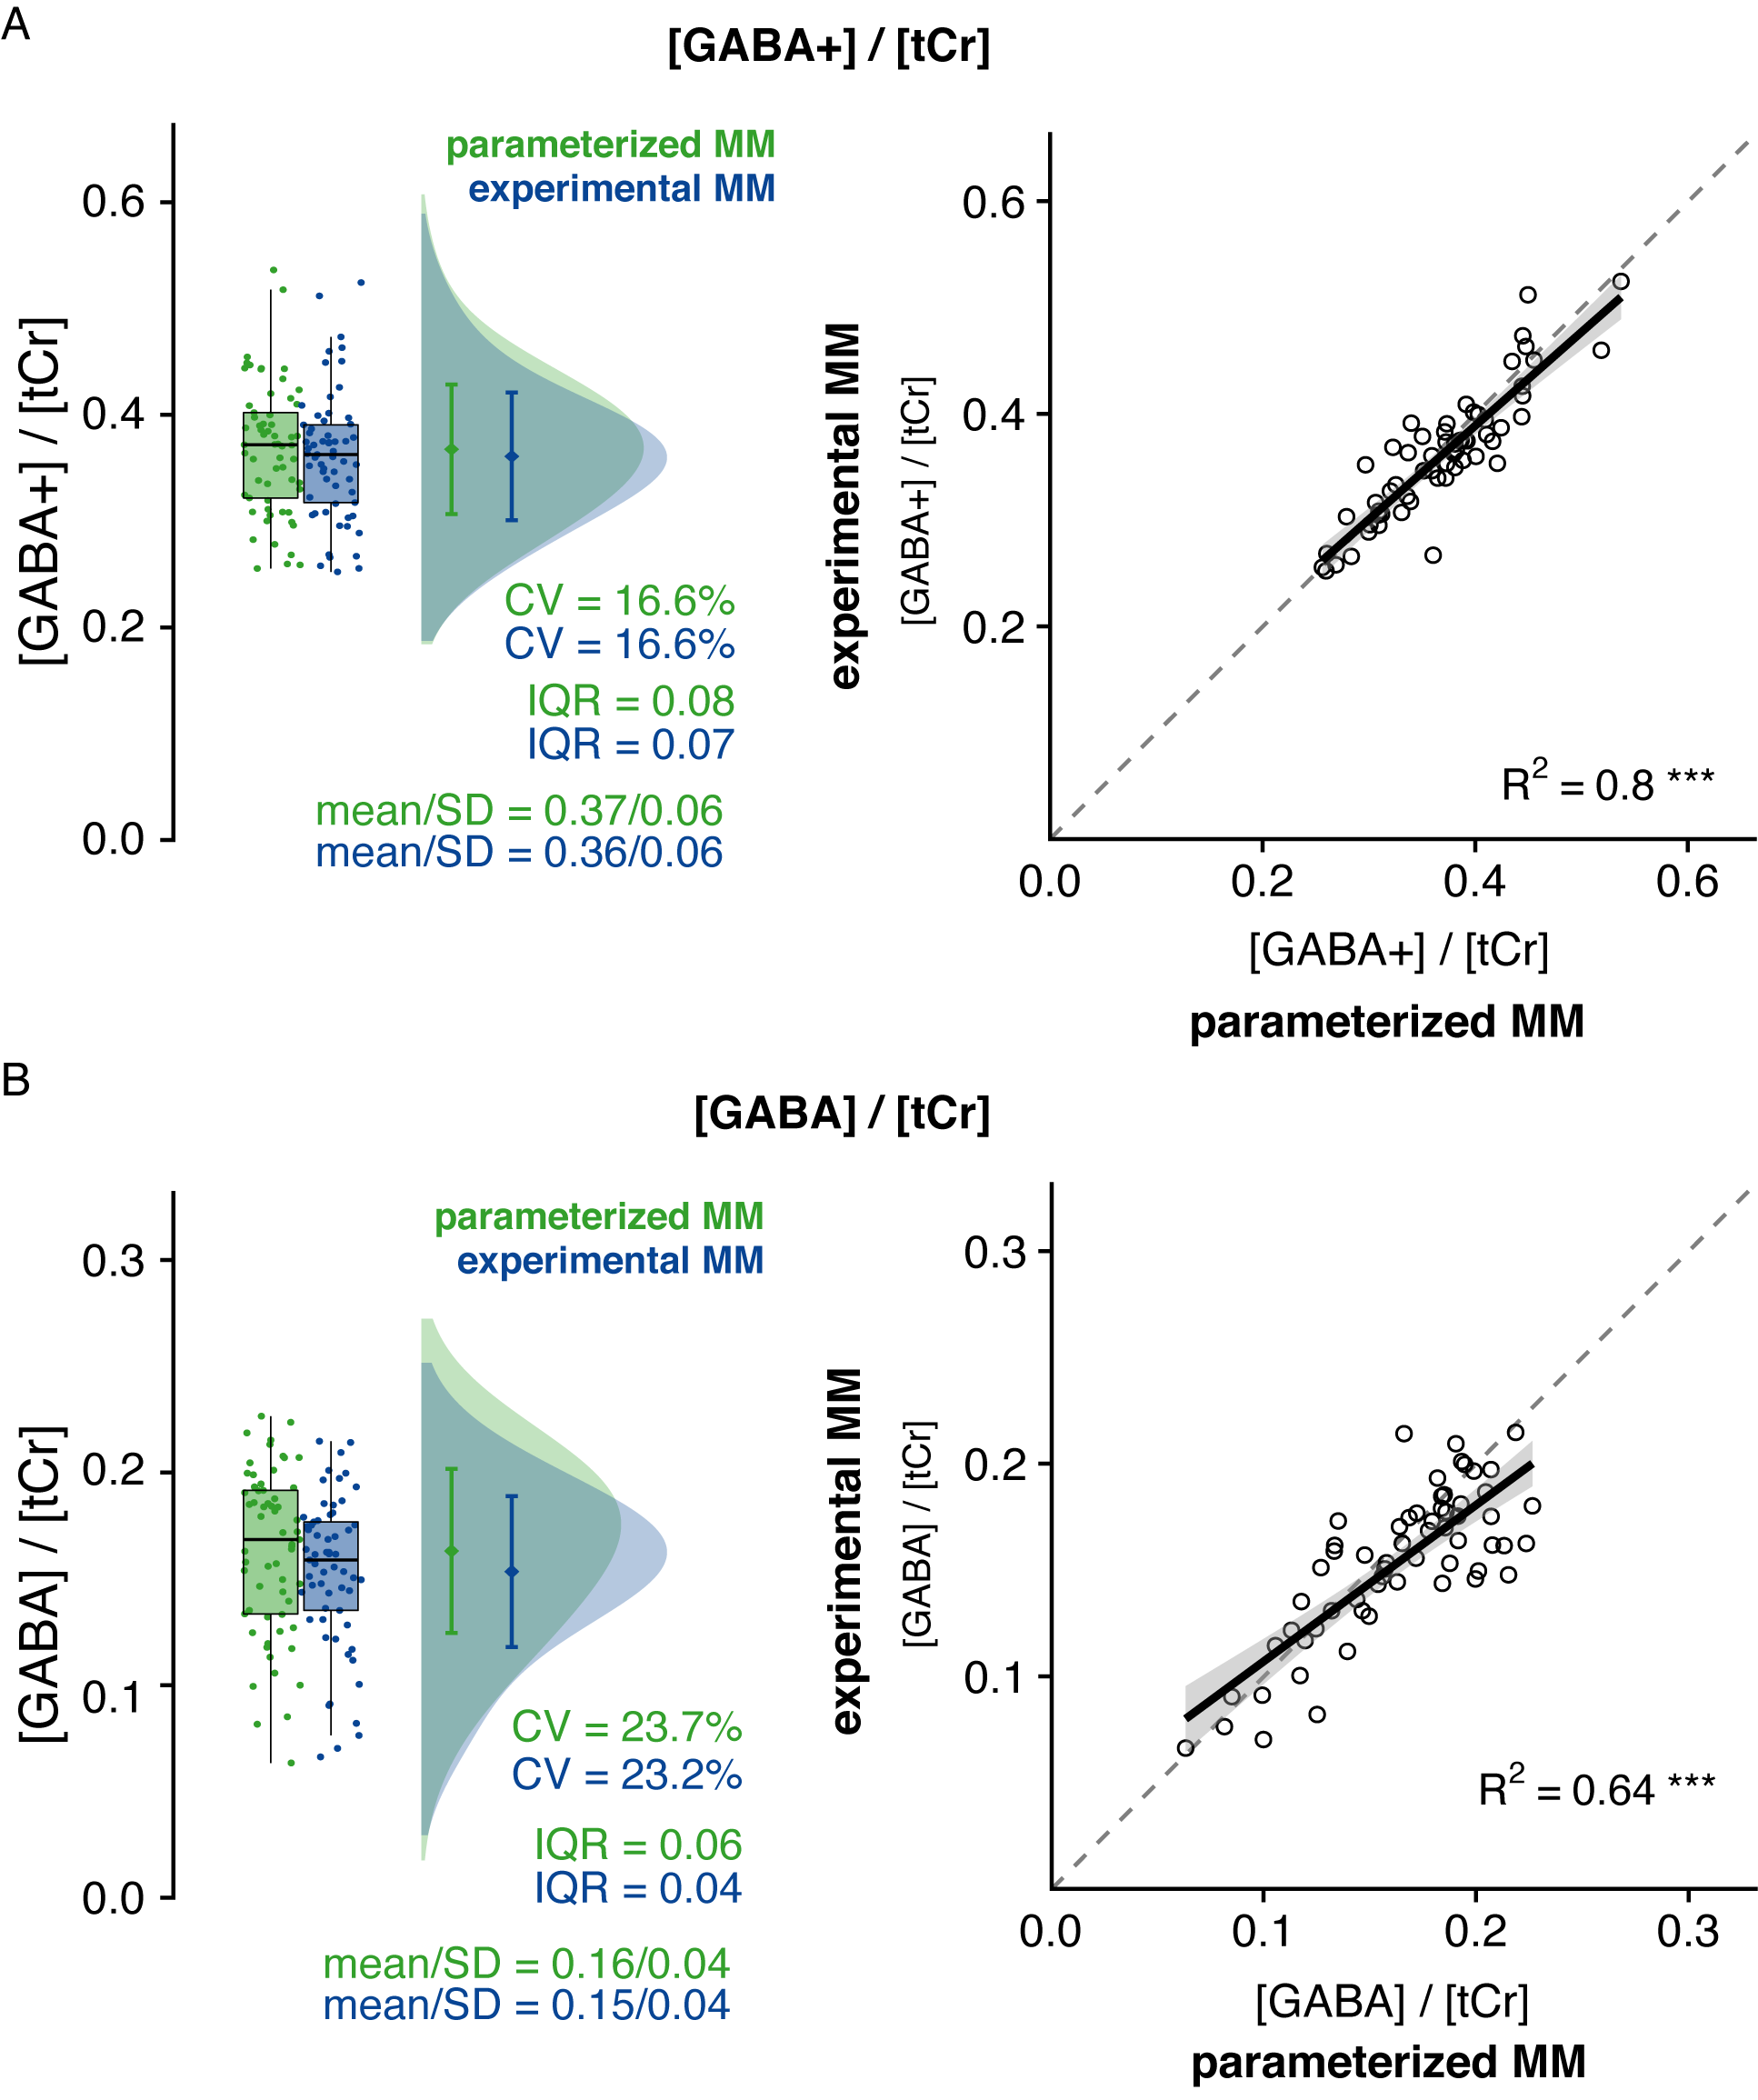
(A) Analysis of GABA+/tCr estimates. (B) Analysis of GABA/tCr estimates. Boxplots, smoothed distribution, and mean +- SD for both strategies. Correlation analysis between metabolite estimates for both strategies.
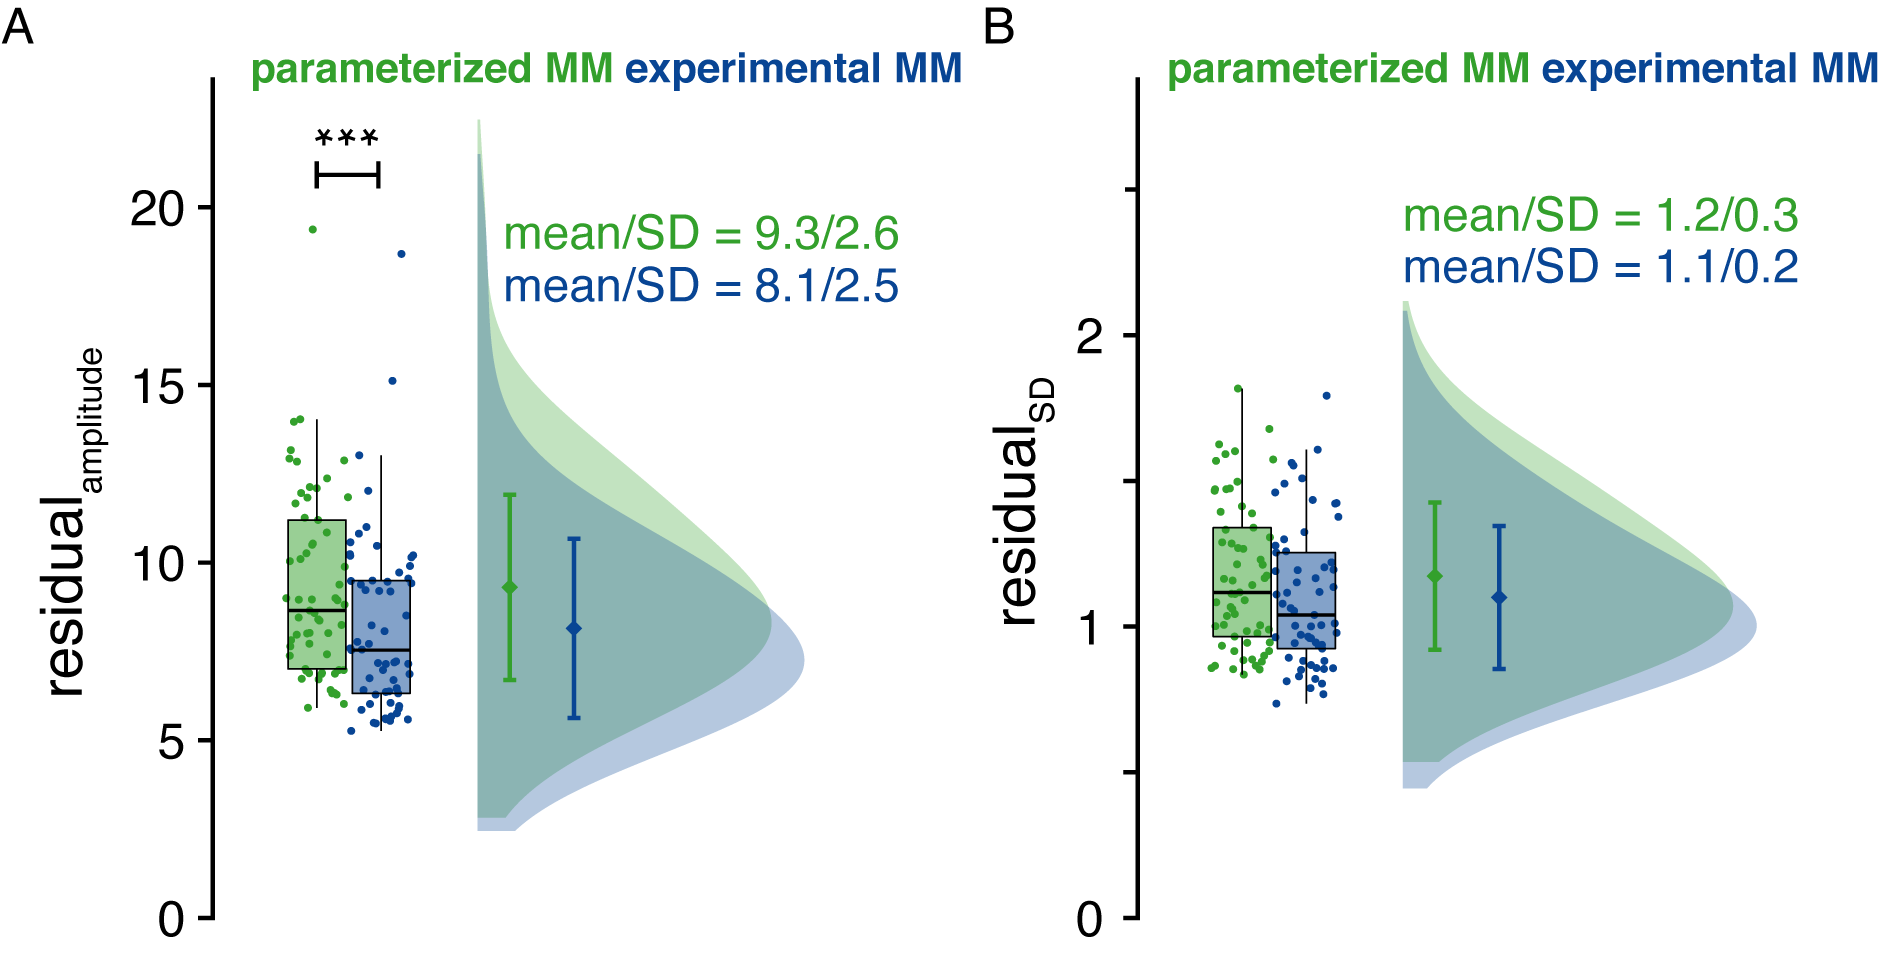
(A) Distribution of the residual amplitude. (B) Distribution of the standard deviation of each subject’s residual. Both values are normalized to the NAA amplitude.
DOI: https://doi.org/10.58530/2022/1076