1070
On the impact of heart rate and relaxation on SNR of hyperpolarized 13C pyruvate metabolic imaging of the human heart
Julia Traechtler1, Maximilian Fuetterer1, Tobias Hoh1, Mohammed Albannay1, Andreas Dounas1, and Sebastian Kozerke1
1University and ETH Zurich, Zurich, Switzerland
1University and ETH Zurich, Zurich, Switzerland
Synopsis
In hyperpolarized 13C MRI, the achievable base SNR depends on the T1 relaxation of pyruvate in blood. Heart rate dependency on the resulting SNR is examined using simulations and exemplarily shown on human data of the heart. Measured T1 and T2 values at 1.5T and 3T of hyperpolarized 13C pyruvate in blood are reported. The results indicate that for a range of pyruvate concentrations, T2 remains >6s and hence T2* is primarily determined by field inhomogeneities. T1 is reduced at lower concentrations, and therefore heart rate plays a decisive role for the achievable SNR. Exemplary in-vivo data illustrate these findings.
INTRODUCTION
Hyperpolarized 13C MRI has shown potential for imaging cardiac metabolism of the in-vivo human heart1. However, the quantification of metabolic alterations is limited by the low SNR due to the rapid relaxation of the hyperpolarized substrate in blood. Hence, the achievable SNR depends both on the T1 value and on the time-to-peak of the bolus.Furthermore, the majority of hyperpolarized MRI sequences is T2*-weighted, which is a function of T2 and field inhomogeneity $$$\gamma\Delta{}\textrm{B}_0$$$:
$$\textrm{T}_2^*=\frac{1}{\textrm{T}_2}+\frac{1}{\gamma\Delta{}\textrm{B}_0}$$
To predict these effects, reliable values of relaxation parameters are required.
While pyruvate T1 values in blood have been reported at 7T2, existing T2 values are derived from in-vivo measurements at 3T3,4 and 9.4T5. Given the expected long T1 and T2 values in blood in comparison to substrate circulation times, a controlled setup is preferred. Additionally, relaxation parameters of hyperpolarized 13C pyruvate at fields <3.0T have not been reported yet. In the present work, T1 and T2 relaxation parameters are determined using 13C MRS for different pyruvate concentrations in venous blood at 1.5T and 3T.
Heart rate dependency of the achievable SNR is examined using simulations and exemplarily shown on human in-vivo data of the heart.
METHODS
The experimental setup of T1 and T2 relaxometry is shown in Fig-1. Different concentrations of neutralized [1-13C]pyruvate polarized to >40% in a SpinLab hyperpolarizer (GE Healthcare) were dissolved in venous pig blood (12.5mM-250mM) and examined on clinical 3T and 1.5T scanners (Philips Healthcare). Identical in-house built transmit-receive 13C volume saddle coils (diameter=3cm) were used. Neat samples (250mM) were additionally measured in a 0.58T benchtop MRI (Pure Devices). All experiments related to blood samples were approved by the Cantonal Veterinary Office (Zurich, Switzerland) and all human experiments were approved by the Cantonal Ethics Committee and Swissmedic.T1 relaxation was determined using dynamic pulse-acquire spectroscopy (FA=5°,TR=10s, ten dynamics). For T2, a custom slice-selective Carr-Purcell-Meibloom-Gill (CPMG) sequence6 was implemented. To account for long T2 times, 1024 echoes with an echo-spacing of 10ms were acquired. For the benchtop system, the parameters were the following: FA=10°, TR=10s for T1, and 2000 echoes, TE=2.5ms for T2.
T1 and T2 relaxation times were fitted monoexponentially from the averaged first three FID samples of each dynamic, and the spectral maximum, respectively. For T2, even and odd echoes were fitted individually and subsequently averaged to obtain a final T2 estimate.
To investigate heart rate dependency on the achievable SNR, a two-stage bolus timing model as shown in Fig-2A was developed: stage 1 from dissolution until injection (T1=70s) and stage 2 from injection until myocardial bolus peak (variable, concentration-dependent T1). The time-to-peak of the myocardial bolus (in heart beats) was determined empirically from 25 in-vivo pig datasets as shown in Fig-2B. The times between dissolution and injection (20s/90s for animal/human application) are based on experimental experience. Relative achievable SNR was determined as a function of heart rate and T1 in blood.
Exemplary in-vivo data measured in patients with heart failure (preserved ejection fraction (EF)>=50% and mid-range EF=40-49%) are presented to illustrate the effect of heart rate on the SNR in hyperpolarized 13C metabolic imaging.
RESULTS
Fig-3 depicts the estimated T1 and T2 values for pyruvate concentrations in blood of 12.5mM, 25mM, 50mM, 100mM, 150mM and 250mM (neat) at different field strengths (3T, 1.5T and 0.58T).Fig-4A shows the expected resulting SNR at myocardial bolus peak time as a function of heart rate and T1. For realistic pyruvate-blood concentrations with corresponding T1 values according to Fig-3, the achievable SNR is illustrated in Fig-4B.
Fig-5 shows exemplary human in-vivo data for high (81bpm), medium (67bpm) and low (45-55bpm) heart rates demonstrating improved SNR for higher heart rates. Based on the bolus timing according to Fig-2, this range of heart rates (81bpm-45bpm) corresponds to a time span between 25-45s for the time-to-peak of the myocardial bolus, which has an significant impact on the resulting base SNR in case of small T1 values.
DISCUSSION
To predict data quality in hyperpolarized MRI, reliable estimates of relaxation parameters T1 and T2 under in-vivo conditions as well as for different pyruvate concentrations in blood are required.In addition to the bolus concentration, the achievable SNR depends on the time-to-peak in the organ of interest, and therefore on the heart rate.
Even for low pyruvate concentrations in blood, the estimated T2 relaxation times (>5.9s) remain relatively long and therefore, T2* is primarily determined by field inhomogeneities including tissue susceptibility and shim settings.
While our current data demonstrate trends, further measurements are warranted to substantiate average and variation of T1 and T2 values in-vivo at different field strengths.
Using experimental data and simulations, we have demonstrated that the achievable base SNR in hyperpolarized MRI is strongly dependent on the heart rate of the subject. The underlying model relies on bolus timings determined from in-vivo data measured in pigs, which had relatively high heart rates (85$$$\pm$$$9bpm), while clinical patients mostly present with lower heart rates (64$$$\pm$$$9bpm). Given the significant impact of heart rates on data quality, heart rate management of patients using stressors is considered an important aspect in future study designs of experimental and human trials.
Acknowledgements
The authors would like to acknowledge Miriam Weisskopf for animal handling and care.References
- Cunningham CH, Lau JYC, Chen AP, Geraghty BJ, Perks WJ, Roifman I, et al. Hyperpolarized 13C Metabolic MRI of the Human Heart: Initial Experience. Circ Res. 2016;119:1177–82. doi:10.1161/CIRCRESAHA.116.309769.
- Michel K, Harlan C, Mitcham T, Merritt M, Bouchard R, Bankson J. Effects of Blood Oxygen Content on Longitudinal Relaxation of Hyperpolarized 13C Agents at 7 Tesla. In: Proc. Intl. Soc. Mag. Reson. Med. 2021. p. 3800.
- Ma J, Harrison CE, Ratnakar J, Reed GD, Schulte RF, Zaha VG, Malloy CR, Park JM. In Vivo T2* of Hyperpolarized 13C-Metabolites in Human Brain, Heart, Kidney, and Spleen: An Imaging Approach. In: Proc. Intl. Soc. Mag. Reson. Med. 2021. p. 3585.
- Yen YF, Le Roux P, Mayer D, King R, Spielman D, Tropp J, Butts Pauly K, Pfefferbaum A, Vasanawala S, Hurd R. T2 relaxation times of 13C metabolites in a rat hepatocellular carcinoma model measured in vivo using 13C‐MRS of hyperpolarized [1‐13C] pyruvate. NMR in Biomedicine: An International Journal Devoted to the Development and Application of Magnetic Resonance In vivo. 2010 May;23(4):414-23.
- Joe E, Lee H, Lee J, Yang S, Choi YS, Wang E, Song HT, Kim DH. An indirect method for in vivo T2 mapping of [1‐13C] pyruvate using hyperpolarized 13C CSI. NMR in Biomedicine. 2017 May;30(5):e3690.
- Meiboom S, Gill D. Modified spin‐echo method for measuring nuclear relaxation times. Review of scientific instruments. 1958 Aug;29(8):688-91.
Figures
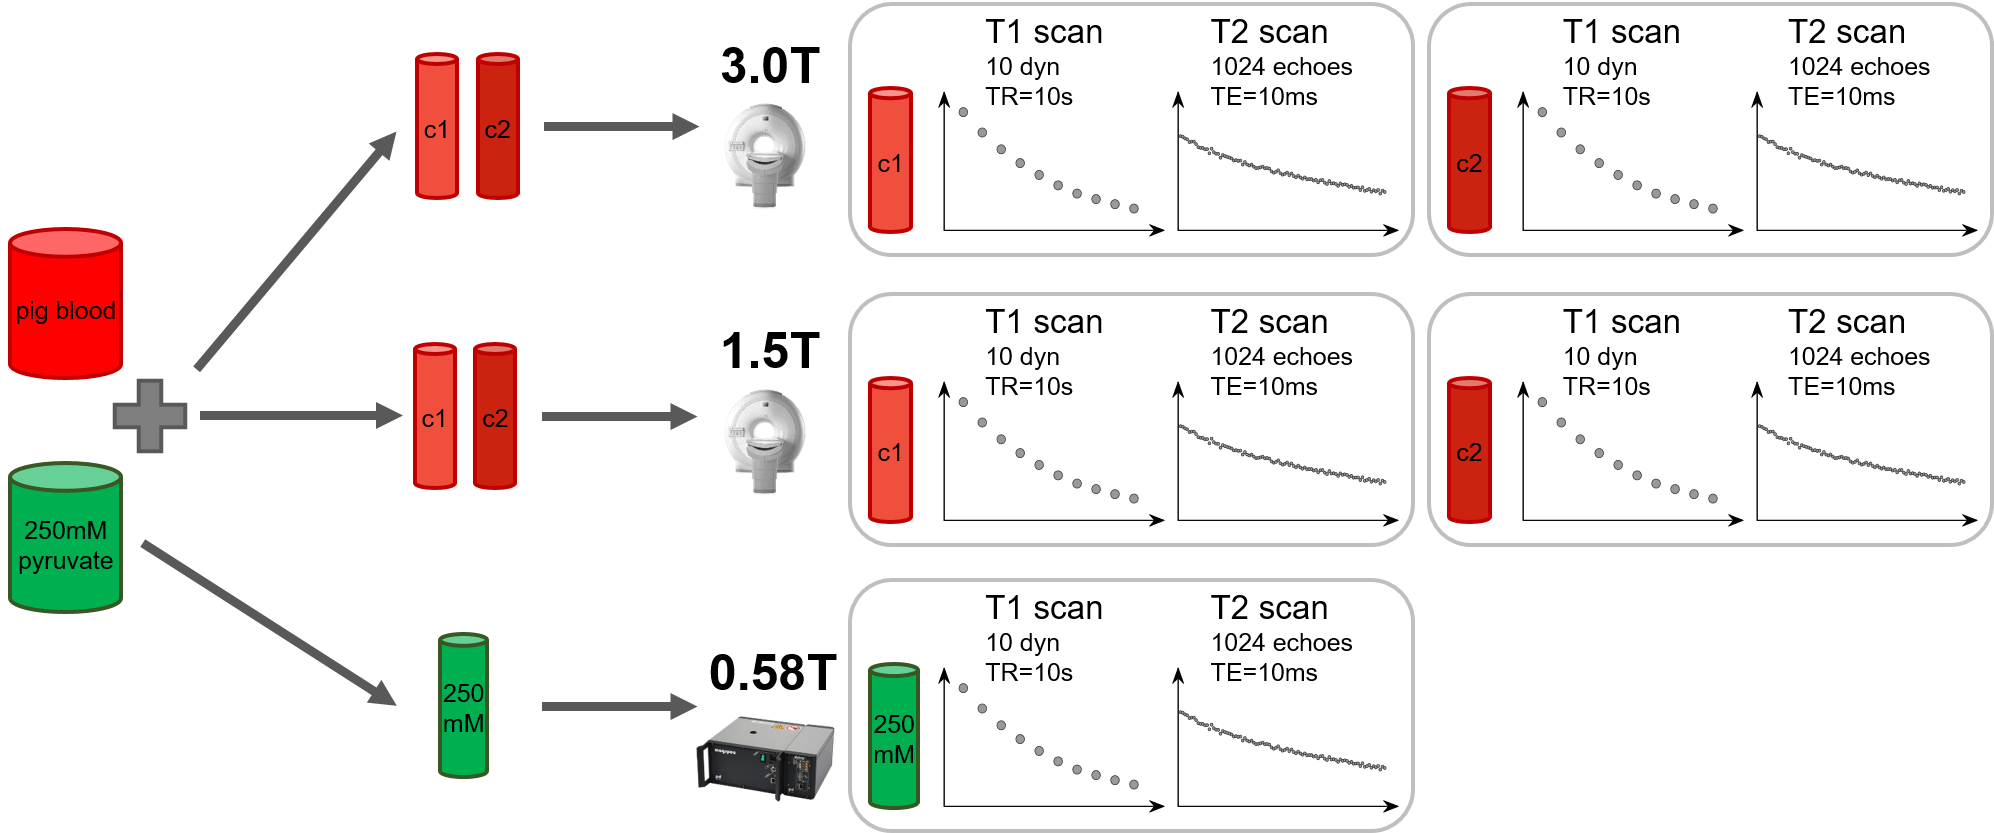
Fig-1 Experimental setup for T1 and T2 measurement of hyperpolarized pyruvate in blood at different field strengths. For each measurement, T1 and T2 of two different concentrations (c1 and c2) of hyperpolarized pyruvate in blood were measured simultaneously at different field strengths. Relaxation parameters of the higher concentration c2 were measured subsequent to the lower concentration c1. Multiple repetitions yielded in total six different concentrations, each measured twice (N=2).
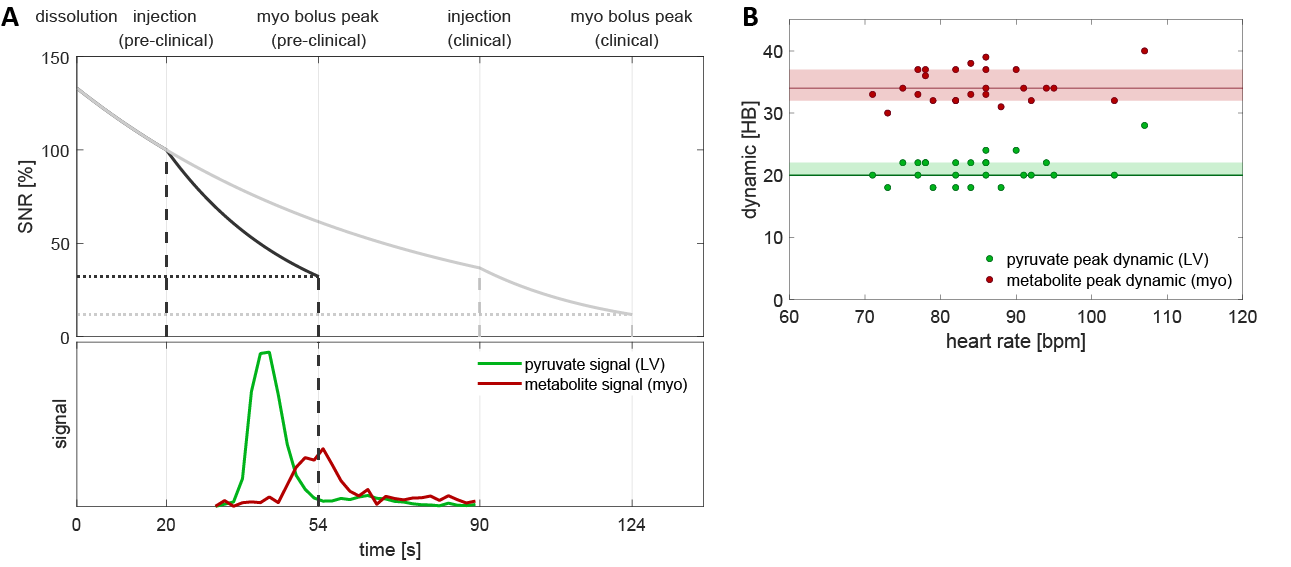
Fig-2 (A) Illustration of bolus timing and SNR reduction as a result of T1 decay with varying time constants. (B) Empirically determined distribution of bolus peak dynamics in the left ventricle and myocardium derived from 25 in-vivo pig datasets.
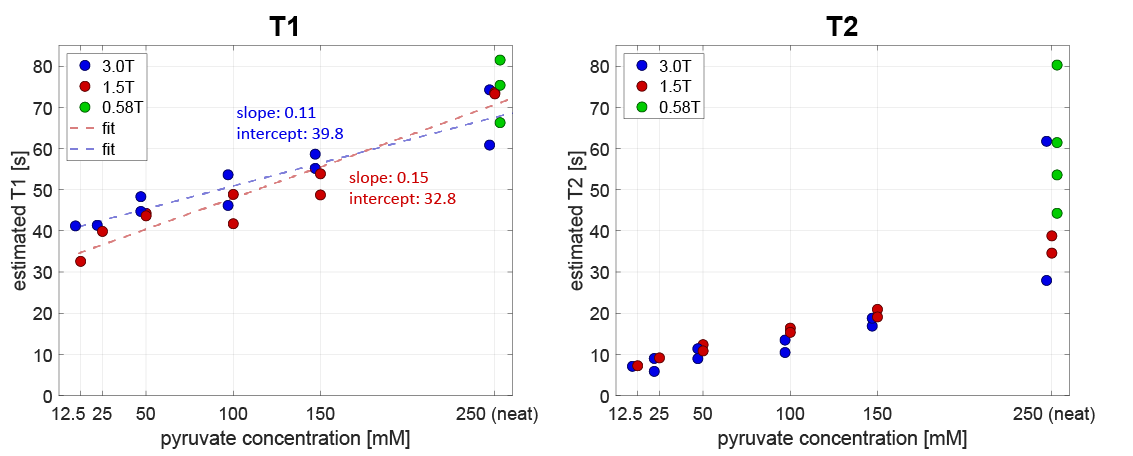
Fig-3 Measured T1 and T2 values of pyruvate in blood for different concentrations at different field strengths (N=2 per concentration per field). As expected, both T1 and T2 increase for increasing pyruvate concentrations, covering relaxation parameter ranges between 33-82s (T1) and 5.9-80.3s (T2). While T1 values seem to increase linearly for all concentrations, T2 shows a stronger increase for neat pyruvate vs. pyruvate in blood. The results indicate that T1 is slightly higher for higher field strengths, whereas T2 relaxation seems to be slightly smaller for higher fields.
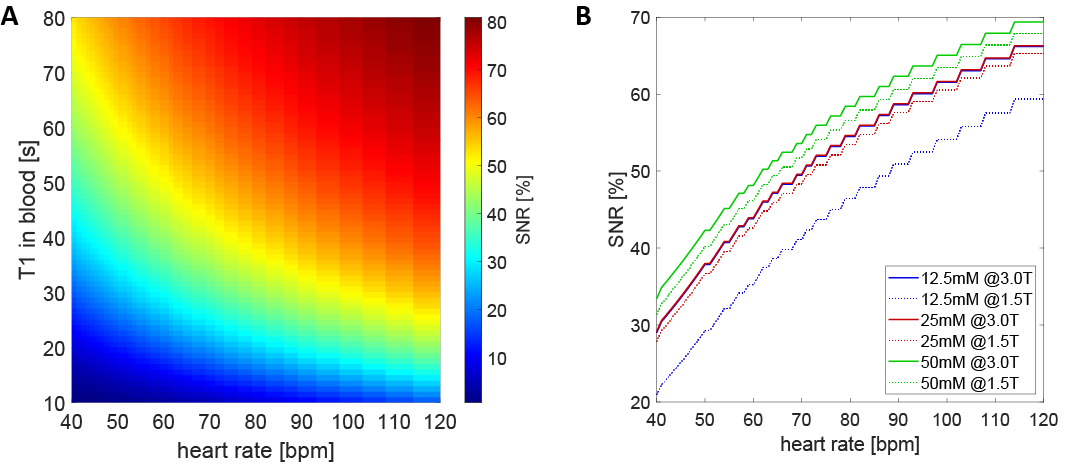
Fig-4 Achievable relative SNR as a function of heart rate and T1 in blood (A) and as a function of heart rate for realistic pyruvate concentrations (B) which correspond to T1 values as depicted in Fig-3. A relative SNR of 100% is assumed at time of injection.
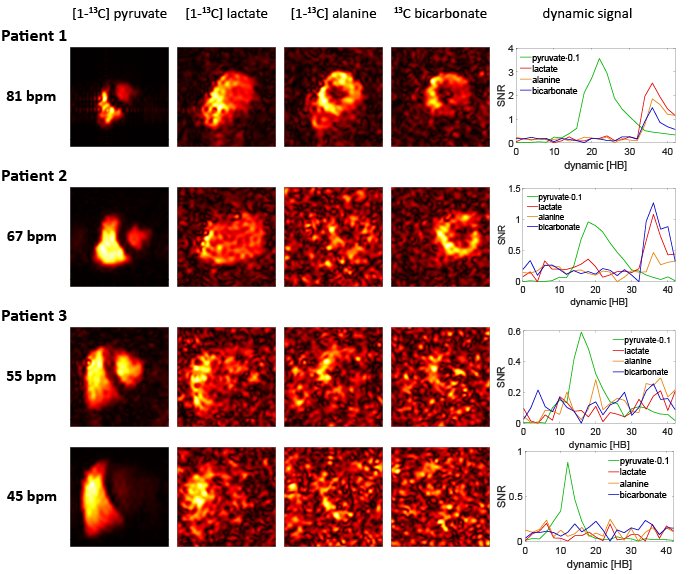
Fig-5 Exemplary human in-vivo data for high (81bpm), medium (67bpm) and low (45-55bpm) heart rates. For the high heart rate (81bpm) case, the peak SNRs for pyruvate/lactate/alanine/bicarbonate are 35.6/2.5/1.9/1.5, whereas for the low heart rate (55bpm) example, the values account to 5.9/0.2/0.3/0.3. Heart rate dependency on the SNR is also seen between two measurements (injections) in the same patient (Patient 3) with varying heart rates between the measurements (45bpm vs. 55bpm).
DOI: https://doi.org/10.58530/2022/1070