1065
Modelling the kinetics of cerebral lactate production after hyperpolarized [2H7, U-13C6]-D-glucose bolus1Laboratory for Functional and Metabolic Imaging (LIFMET), EPFL, Lausanne, Switzerland, 2Geneva School of Health Sciences, University of Applied Sciences and Arts Western Switzerland (HES-SO), Geneva, Switzerland
Synopsis
The present work describes a quantitative analysis of lactate 13C-labeling pattern following the metabolism of hyperpolarized [2H7,U-13C6]-D-glucose. This lactate production results from 12 biochemical steps including glucose transport, 10 enzymatic steps of glycolysis, and LDH mediated pyruvate-to-lactate conversion. The 3-compartment model description was found a good compromise to interpret the hyperpolarized metabolic curves. This demonstrates the potential of hyperpolarized [2H7, U-13C6]-D-glucose as a new biochemical probe for brain energy metabolism.
Introduction:
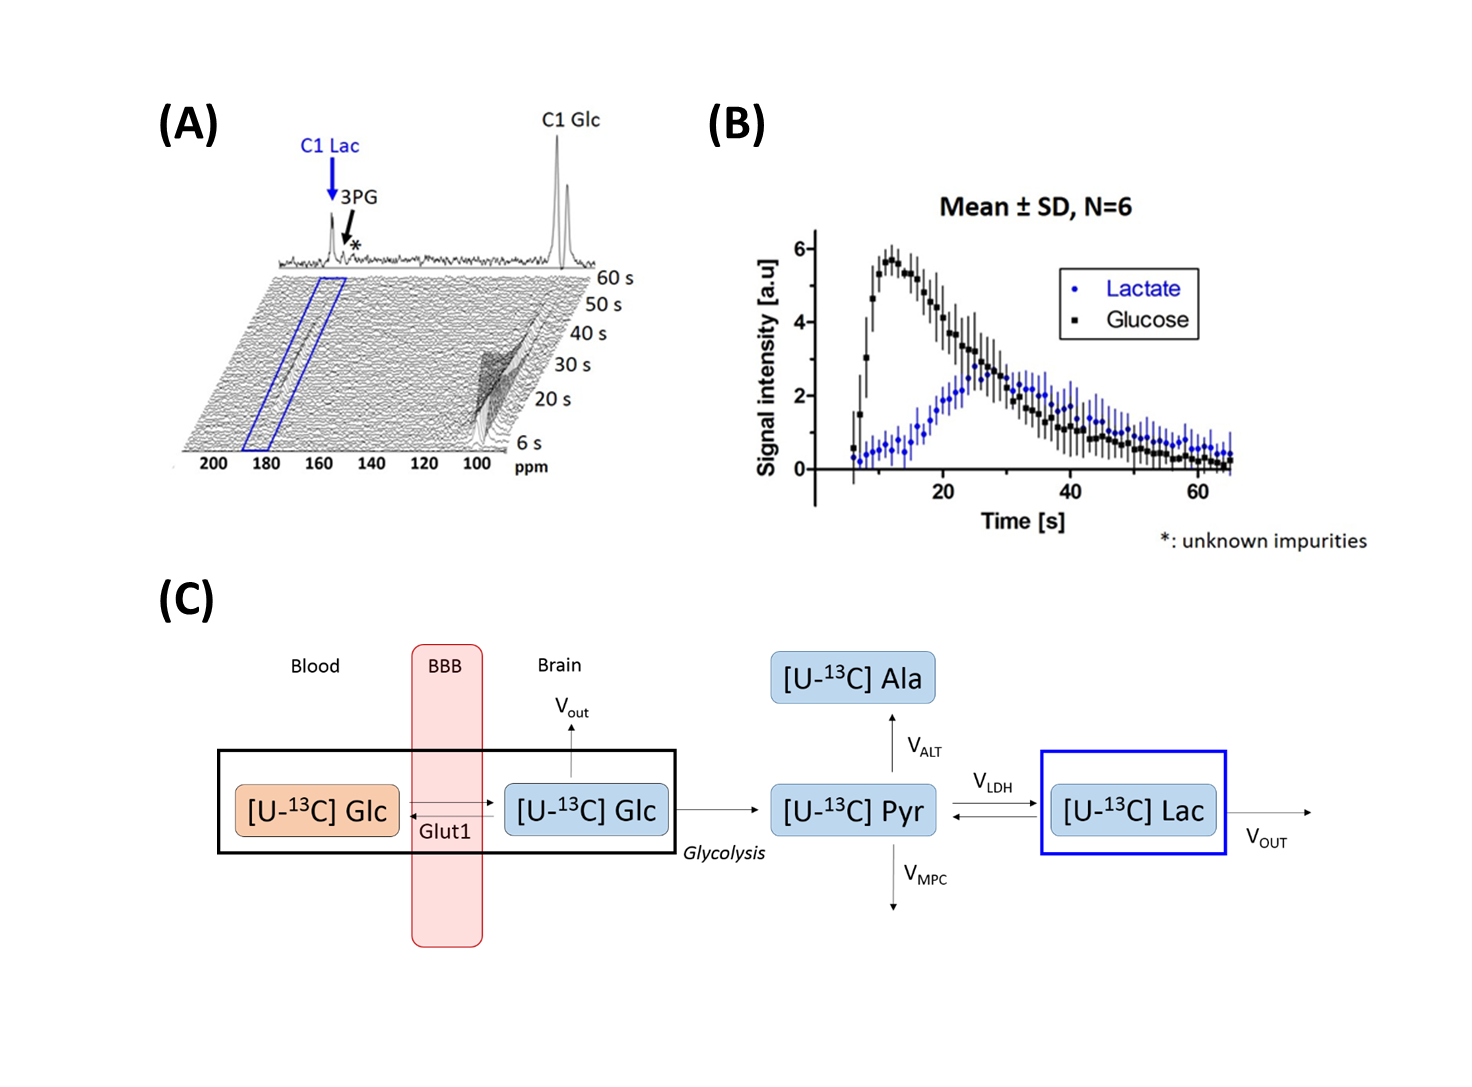
Recent studies have demonstrated the possibility to monitor lactate production shortly after injection of hyperpolarized [2H7,13C6]-D-glucose in naïve brain1,2 and brain tumors3. The lactate production from hyperpolarized 13C-glucose results from 12 biochemical steps including glucose transport, 10 enzymatic steps of glycolysis, and LDH mediated pyruvate-to-lactate conversion. In the present work, we describe kinetic models reflecting the dynamic 13C-labeling pattern following the metabolism of [2H7,U-13C6]-D-glucose. Since we detected the dynamics of glucose and lactate solely, we chose to restrict ourselves to a 3- or 4-compartment model, to avoid the risk of overfitting (Fig.1). Quantifying the kinetics of cerebral lactate production following hyperpolarized [2H7,U-13C6]-D-glucose bolus is an important step to extend the potential of hyperpolarized glucose as a complement to FDG-PET and thermally polarized X-nuclei MRS approaches5–8.Methods:
Hyperpolarization: A frozen mixture of 2M [1,2,3,4,5,6,6′-2H7,U-13C6]D-glucose, 25mM OX63 radical doped with 1mM of gadolinium in water/glycerol4 was hyperpolarized in a custom-designed 7T/1K DNP polarizer9, resulting in a liquid-state polarization of 29±3%.Animal Preparation: 12 hour-food deprived C57BL6/J male mice (17±2 weeks) were anesthetized using 1.5-2% isoflurane in 60% O2. The anesthetized animals were cannulated to place a femoral vein catheter to deliver the glucose bolus. Post-surgery, a subcutaneous bolus of medetomidine 0.3mg/kg was administered. Ten minutes later, isoflurane anesthesia was dropped to 0.25–0.5%, and a continuous subcutaneous infusion of medetomidine (0.6 mg/kg/h) started, as described elsewhere10.
Acquisition: Mice were placed into a 9.4T/31cm horizontal bore MRI scanner (Varian/Magnex) with a home-built 1H quadrature/13C single-loop coil above the head. At 1h post-medetomidine, 540 μL of 44±10mM HP [2H7,U-13C6]-D-glucose was injected and 13C MR spectra were acquired every 1s with nominal 25° flip-angle for the C1 lactate resonance (183.5 ppm) and 1.5° flip angle for the glucose C1 resonances (92.9 ppm and 96.8 ppm).
Kinetic modeling: Spectra were integrated with VNMRJ software to obtain the time course of glucose and lactate signals. From a simplified scheme of [2H7,U-13C6]glucose cerebral metabolism (Fig.1), kinetic models (Fig.2) were derived as follows:
- Steps were modeled as first-order reactions.
- Single apparent rate constants included glucose transport through the blood-brain barrier, cell transport, and either glucose-to-pyruvate (3-compartment model) or glucose-to-intermediate pool (4-compartment model) were assumed.
- Pyruvate-to-lactate exchange is much faster than the entry into the TCA cycle and the conversion to alanine11, thus, given the short total acquisition time, neither VMPC nor VALT of pyruvate were included in either kinetic model. ·
- The rate constant kGlc-Pyr was forced to be lower than kPyr-Lac (3-compartment model) and kGlc-IP or kIP-Pyr to be lower than kPyr-Lac (4-compartment model)11.
- Lactate and pyruvate resonances are within the RF pulse bandwidth thus the same flip angle was assumed for both metabolites.
- Signal decay is a combination of the effects of T1-relaxation, repeated RF excitations, and biochemical conversions.
Results:
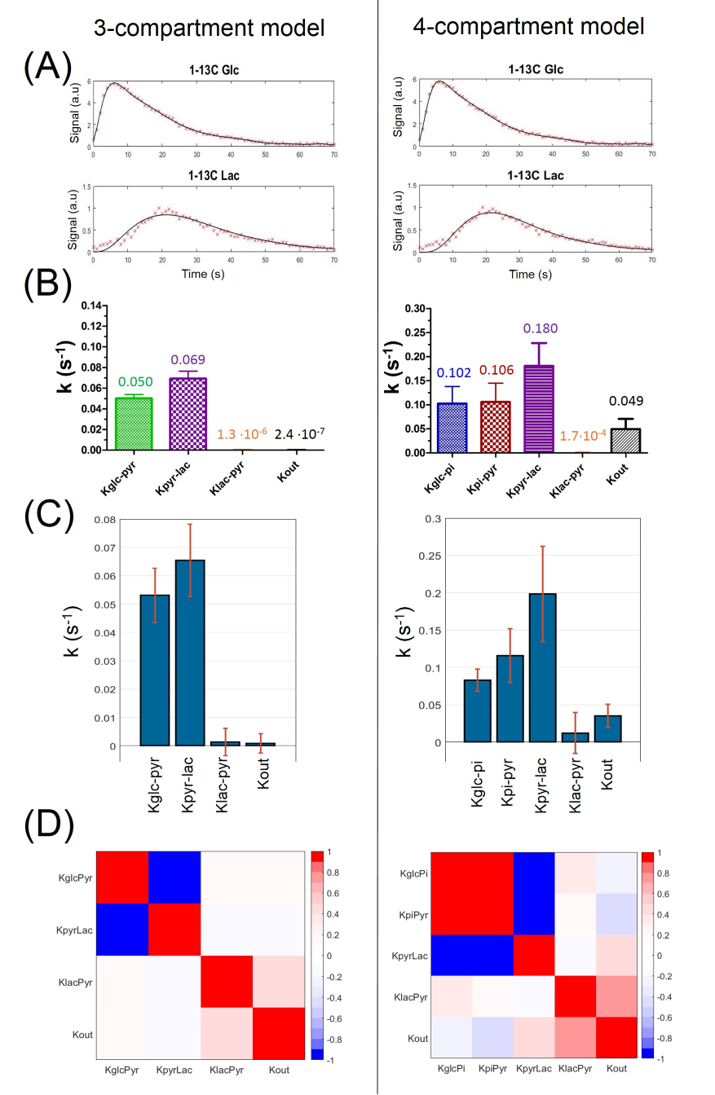
Both models could fit the experimental data (Fig.3A). A better fit was achieved with the 4-compartment model (15% SSE reduction), as visible in the build-up of the lactate curve.In the 3-compartment model, both the variation of the initial conditions and the Monte-Carlo simulations resulted in kinetic rates within the same range. In the 4-compartment model, this variance was slightly higher (Fig.3B&C).
Analyzing correlations between the kinetic rate constants: off-diagonal covariance was increased in the 4-compartment model. In the 3-compartment model, only kGlc-Pyr and kPyr-Lac are anti-correlated (Fig.3D).
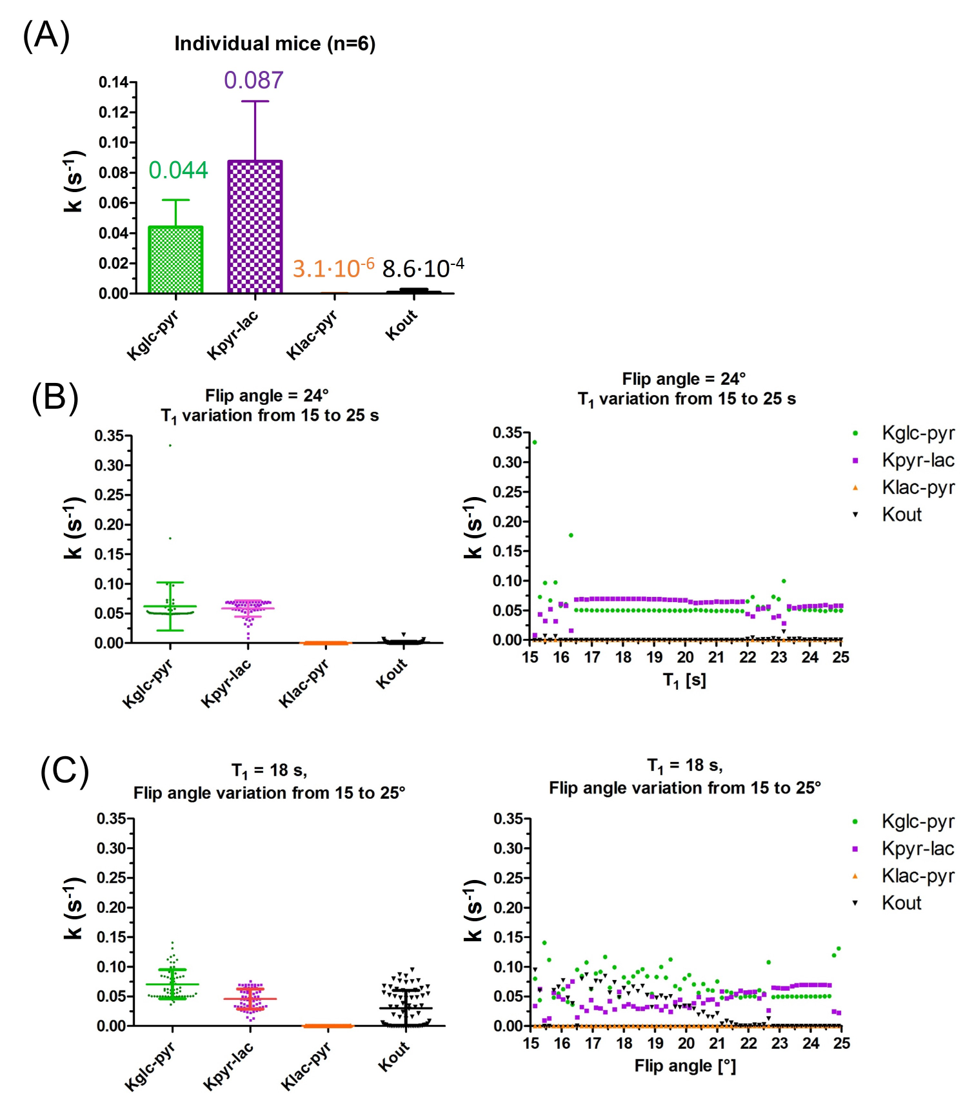
Testing the robustness of the 3-compartment model: results computed for individual mice were similar to those obtained from the average time courses confirming the reproducibility of the data (Fig.4A). Flip angle variations had a greater influence on the kinetic rates than the spin-lattice relaxation (Fig.4B&C).
Discussion:
Quantitative information on the kinetics of cerebral hyperpolarized-13C-glucose metabolism was obtained for the first time.The increased variance in kinetic rates and their higher covariance indicate that the 4-compartment model is probably too complex. Indeed, the two added kinetic rates (kGlc-IP and kIP-Pyr) were fully correlated and thus hardly biochemically interpretable. This is explained by the delay between glucose and lactate signals which is necessarily created by kGlc-IP or kIP-Pyr steps. Therefore, the rest of our analysis focused on the 3-compartment model.
The 3-compartment model appeared to be more robust: variation of initial conditions and Monte-Carlo simulations gave kinetic rate constants in the same range. Similar values were estimated on average time courses and individual animal analyses.
The estimated kPyr-Lac in the 3-compartment model is in the same range as values reported on isoflurane-anesthetized13 and awake rats14. Note that the differences may be related to the hyperpolarized-sensor uptake, the anesthesia, and the different animal species.
Conclusion:
Kinetics of cerebral lactate production following hyperpolarized [2H7,U-13C6]-D-glucose injection was quantified, enabling hyperpolarized [2H7,U-13C6]-D-glucose studies to provide biochemical insight on cerebral metabolism and complement existing bioimaging tools.Acknowledgements
We thank Dr. Elise Vinckenbosch for the fruitful discussion on metabolic modeling, and Drs Mario Lepore, Analina Haussin, and Stefanita Mitrea for providing veterinary assistance for this study.References
1. Mishkovsky M, Anderson B, Karlsson M, et al. Measuring glucose cerebral metabolism in the healthy mouse using hyperpolarized 13C magnetic resonance. Sci Rep. 2017;7:11719. doi:10.1038/s41598-017-12086-z
2. Flatt E, Lanz B, Pilloud Y, et al. Measuring Glycolytic Activity with Hyperpolarized [2H7, U-13C6] D-Glucose in the Naive Mouse Brain under Different Anesthetic Conditions. Metabolites. 2021;11(7):413. doi:10.3390/metabo11070413
3. Mishkovsky M, Gusyatiner O, Lanz B, et al. Hyperpolarized 13C-glucose magnetic resonance highlights reduced aerobic glycolysis in vivo in infiltrative glioblastoma. Sci Rep. 2021;11:5771. doi:10.1038/s41598-021-85339-7
4. Capozzi A, Patel S, Wenckebach WT, Karlsson M, Lerche MH, Ardenkjær-Larsen JH. Gadolinium Effect at High-Magnetic-Field DNP: 70% 13C Polarization of [U-13C] Glucose Using Trityl. J Phys Chem Lett. 2019;10(12):3420-3425. doi:10.1021/acs.jpclett.9b01306
5. Gruetter R, Novotny EJ, Boulware SD, et al. Direct measurement of brain glucose concentrations in humans by 13C NMR spectroscopy. Proc Natl Acad Sci U S A. 1992;89(3):1109-1112.
6. Lu M, Zhu XH, Zhang Y, Mateescu G, Chen W. Quantitative assessment of brain glucose metabolic rates using in vivo deuterium magnetic resonance spectroscopy. J Cereb Blood Flow Metab. 2017;37(11):3518-3530. doi:10.1177/0271678X17706444
7. Feyter HMD, Behar KL, Corbin ZA, et al. Deuterium metabolic imaging (DMI) for MRI-based 3D mapping of metabolism in vivo. Science Advances. 2018;4(8):eaat7314. doi:10.1126/sciadv.aat7314
8. Lai M, Lanz B, Poitry-Yamate C, et al. In vivo 13C MRS in the mouse brain at 14.1 Tesla and metabolic flux quantification under infusion of [1,6-13C2]glucose. J Cereb Blood Flow Metab. 2018;38(10):1701-1714. doi:10.1177/0271678X17734101
9. Cheng T, Capozzi A, Takado Y, Balzan R, Comment A. Over 35% liquid-state 13 C polarization obtained via dissolution dynamic nuclear polarization at 7 T and 1 K using ubiquitous nitroxyl radicals. Physical Chemistry Chemical Physics. 2013;15(48):20819-20822. doi:10.1039/C3CP53022A
10. Multi-slice passband bSSFP for human and rodent fMRI at ultra-high field - ScienceDirect. Accessed November 9, 2021. https://www.sciencedirect.com/science/article/pii/S1090780719301004?via%3Dihub
11. Quek LE, Liu M, Joshi S, Turner N. Fast exchange fluxes around the pyruvate node: a leaky cell model to explain the gain and loss of unlabelled and labelled metabolites in a tracer experiment. Cancer Metab. 2016;4. doi:10.1186/s40170-016-0153-9
12. Marquardt DW. An Algorithm for Least-Squares Estimation of Nonlinear Parameters. Journal of the Society for Industrial and Applied Mathematics. 1963;11(2):431-441.
13. Marjańska M, Shestov AA, Deelchand DK, Kittelson E, Henry PG. Brain metabolism under different anesthetic conditions using hyperpolarized [1-13C]pyruvate and [2-13C]pyruvate. NMR in Biomedicine. 2018;31(12):e4012. doi:10.1002/nbm.4012
14. Hyppönen V, Stenroos P, Nivajärvi R, et al. Metabolism of hyperpolarised [1–13C]pyruvate in awake and anaesthetised rat brains. NMR in Biomedicine. n/a(n/a):e4635. doi:10.1002/nbm.4635
Figures