1064
Direct detection of 2HG and glutamate production using hyperpolarized [1-13C-5-12C]-a-ketoglutarate in cell and in vivo glioma models1University of California, San Francisco, San Francisco, CA, United States, 2NHLBI, Bethesda, MD, United States
Synopsis
Mutant IDH leads to 2HG production, which drives glioma development. 13C MRS monitoring of hyperpolarized [1-13C]α-ketoglutarate (αKG) metabolism to 2HG and glutamate provides a non-invasive assessment of the IDH mutation and normal metabolism, respectively. However, monitoring 2HG production in vivo is challenging because its resonance is within 0.1 ppm of the natural abundance [5-13C]αKG signal of the [1-13C]αKG substrate. Here, we utilized [1-13C-5-12C]αKG, which eliminated the [5-13C]αKG peak. This new approach, combined with an optimized sequence, made it possible to readily monitor the production of both 2HG and glutamate in a patient-derived glioma animal model and in normal brain.
Introduction
The isocitrate dehydrogenase (IDH) mutation leads to the production of the oncometabolite 2-hydrogyglutarate (2HG), which in turn drives the development of glioma tumors. 13C magnetic resonance spectroscopy (MRS) of hyperpolarized [1-13C]α-ketoglutarate (αKG) metabolism, has been used to detect the production of 2HG in genetically-engineered glioma cell and animal tumor models, as well as the production of glutamate in normal brain (1-3). However, in the in vivo setting and at lower field strength it can be challenging to detect the 2HG signal at 183.9 ppm because of its proximity to the natural abundance [5-13C]αKG peak at 184 ppm (1). In this study, we used the recently synthesized [1-13C-5-12C]αKG (4), which led to the elimination of the [5-13C]αKG peak at 184 ppm. Combined with our recently optimized pulse sequence, this new compound allowed us to monitor the metabolism of [1-13C-5-12C]αKG to 2HG and to glutamate in a patient-derived glioma model and normal rat brain.Methods
[1-13C-5-12C]αKG was prepared as previously described for [1-13C]αKG (1) and polarized using a Hypersense (Oxford, UK) polarizer. For initial cell studies, previously investigated normal human astrocytes (NHA) genetically engineered to express mutant IDH1 were cultured and prepared as previously described. (2) 500 μl [1-13C-5-12C]αKG was injected into cell lysates (~2.5 x 10⁸ cells and n = 3) in a 5 mm NMR tube and dynamic sets of hyperpolarized 13C spectra acquired using a 500 MHz spectrometer (INOVA, Agilent) using the following parameters: FA = 13°, TR = 3s, NEX = 100. Data were processed and analyzed using MNOVA (Mestrelab Research). For animal studies, all work was performed under IACUC approval. Both healthy and tumor-bearing male nude rats were investigated. For tumor-bearing animals (n = 3) BT257 patient-derived mutant IDH1 astrocytoma cells (~3 × 10⁵ cells) were implanted. When tumors reached ~ 0.22 cm3 in size, 2.5ml of the hyperpolarized [1-13C,5-12C]αKG was injected through a tail-vein catheter over approximately 12 sec. 1-D dynamic slab spectroscopy data was then acquired from the rat brain using a pre-clinical scanner (Biospec 3 T, Bruker) and using our recently optimized spectral-spatial excitation and variable flip angle scheme (10 mm slab thickness, flip angle 1 = 38.01° ~ 90° at 184 ppm, flip angle 2 = 3.04° ~ 7.20° at 172 ppm, NT = 8, and temporal resolution = 6 sec) that allows for simultaneous detection of both 2HG and glutamate production (5). In vivo data was processed and analyzed using our in-house quantification pipeline which involves spectral-temporal denoising using singular value decomposition to enhance spectral quality combined with LCModel-based automatic 13C spectral fitting and variable flip angle correction. (5)Results
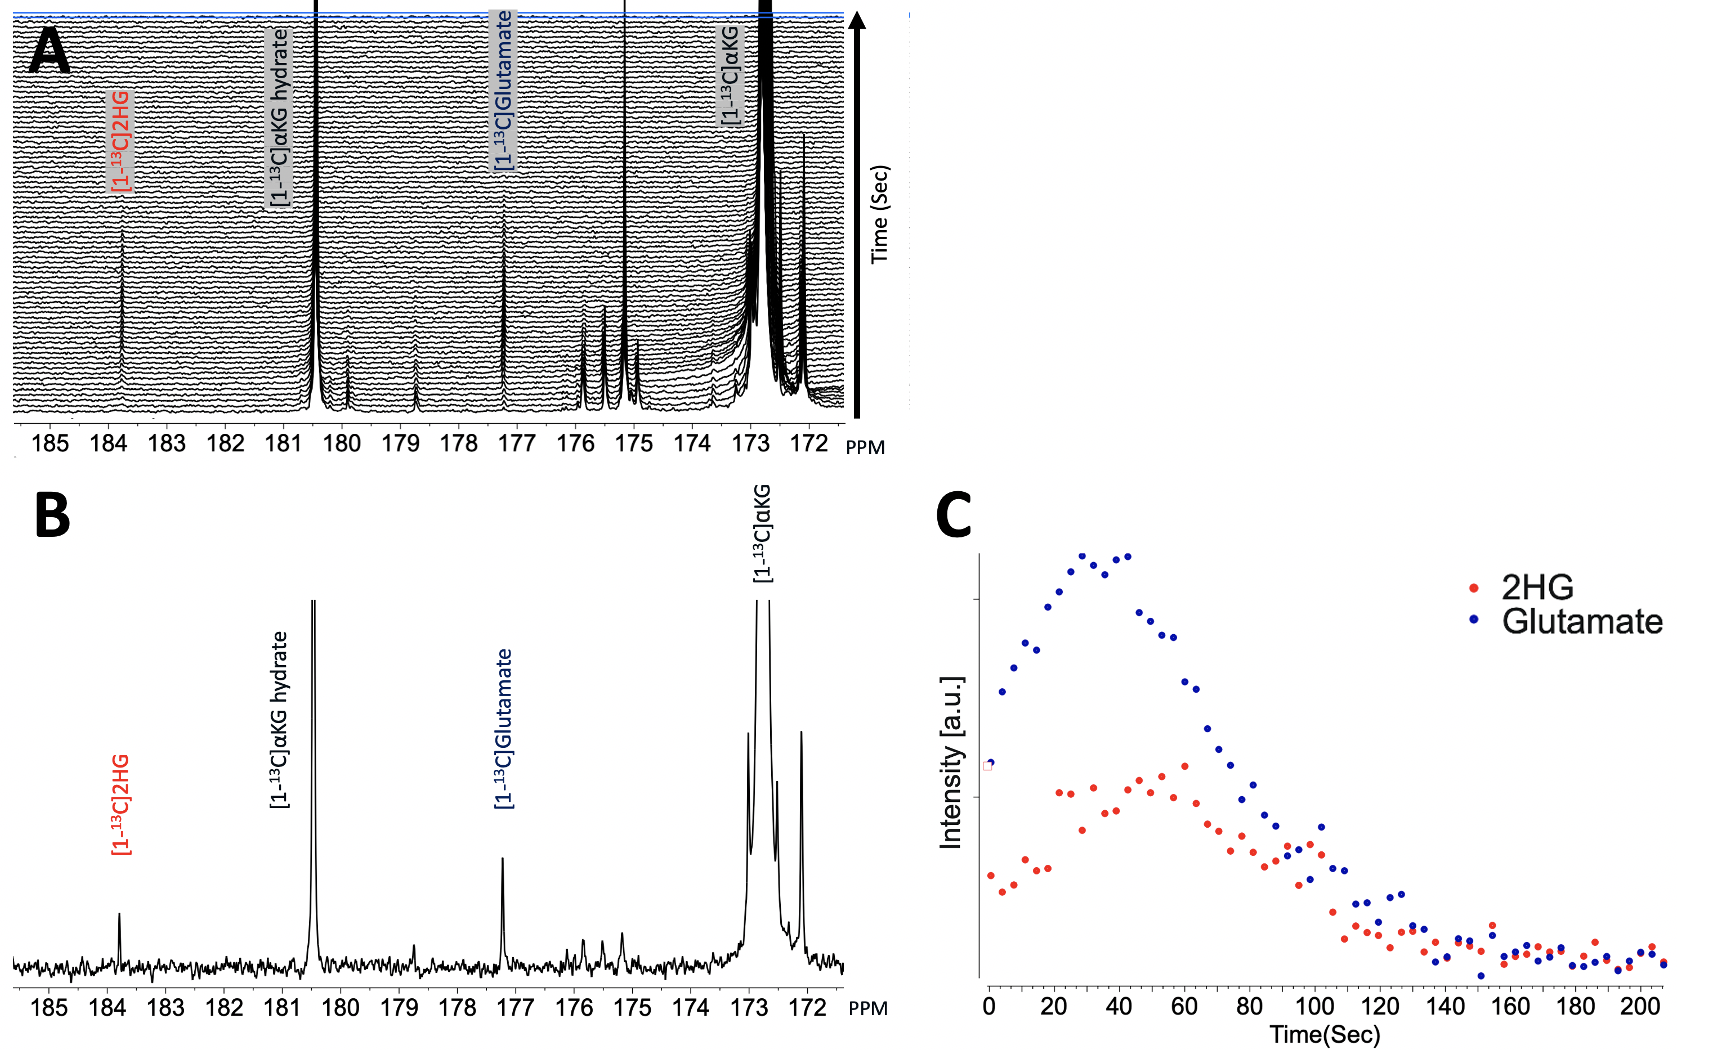
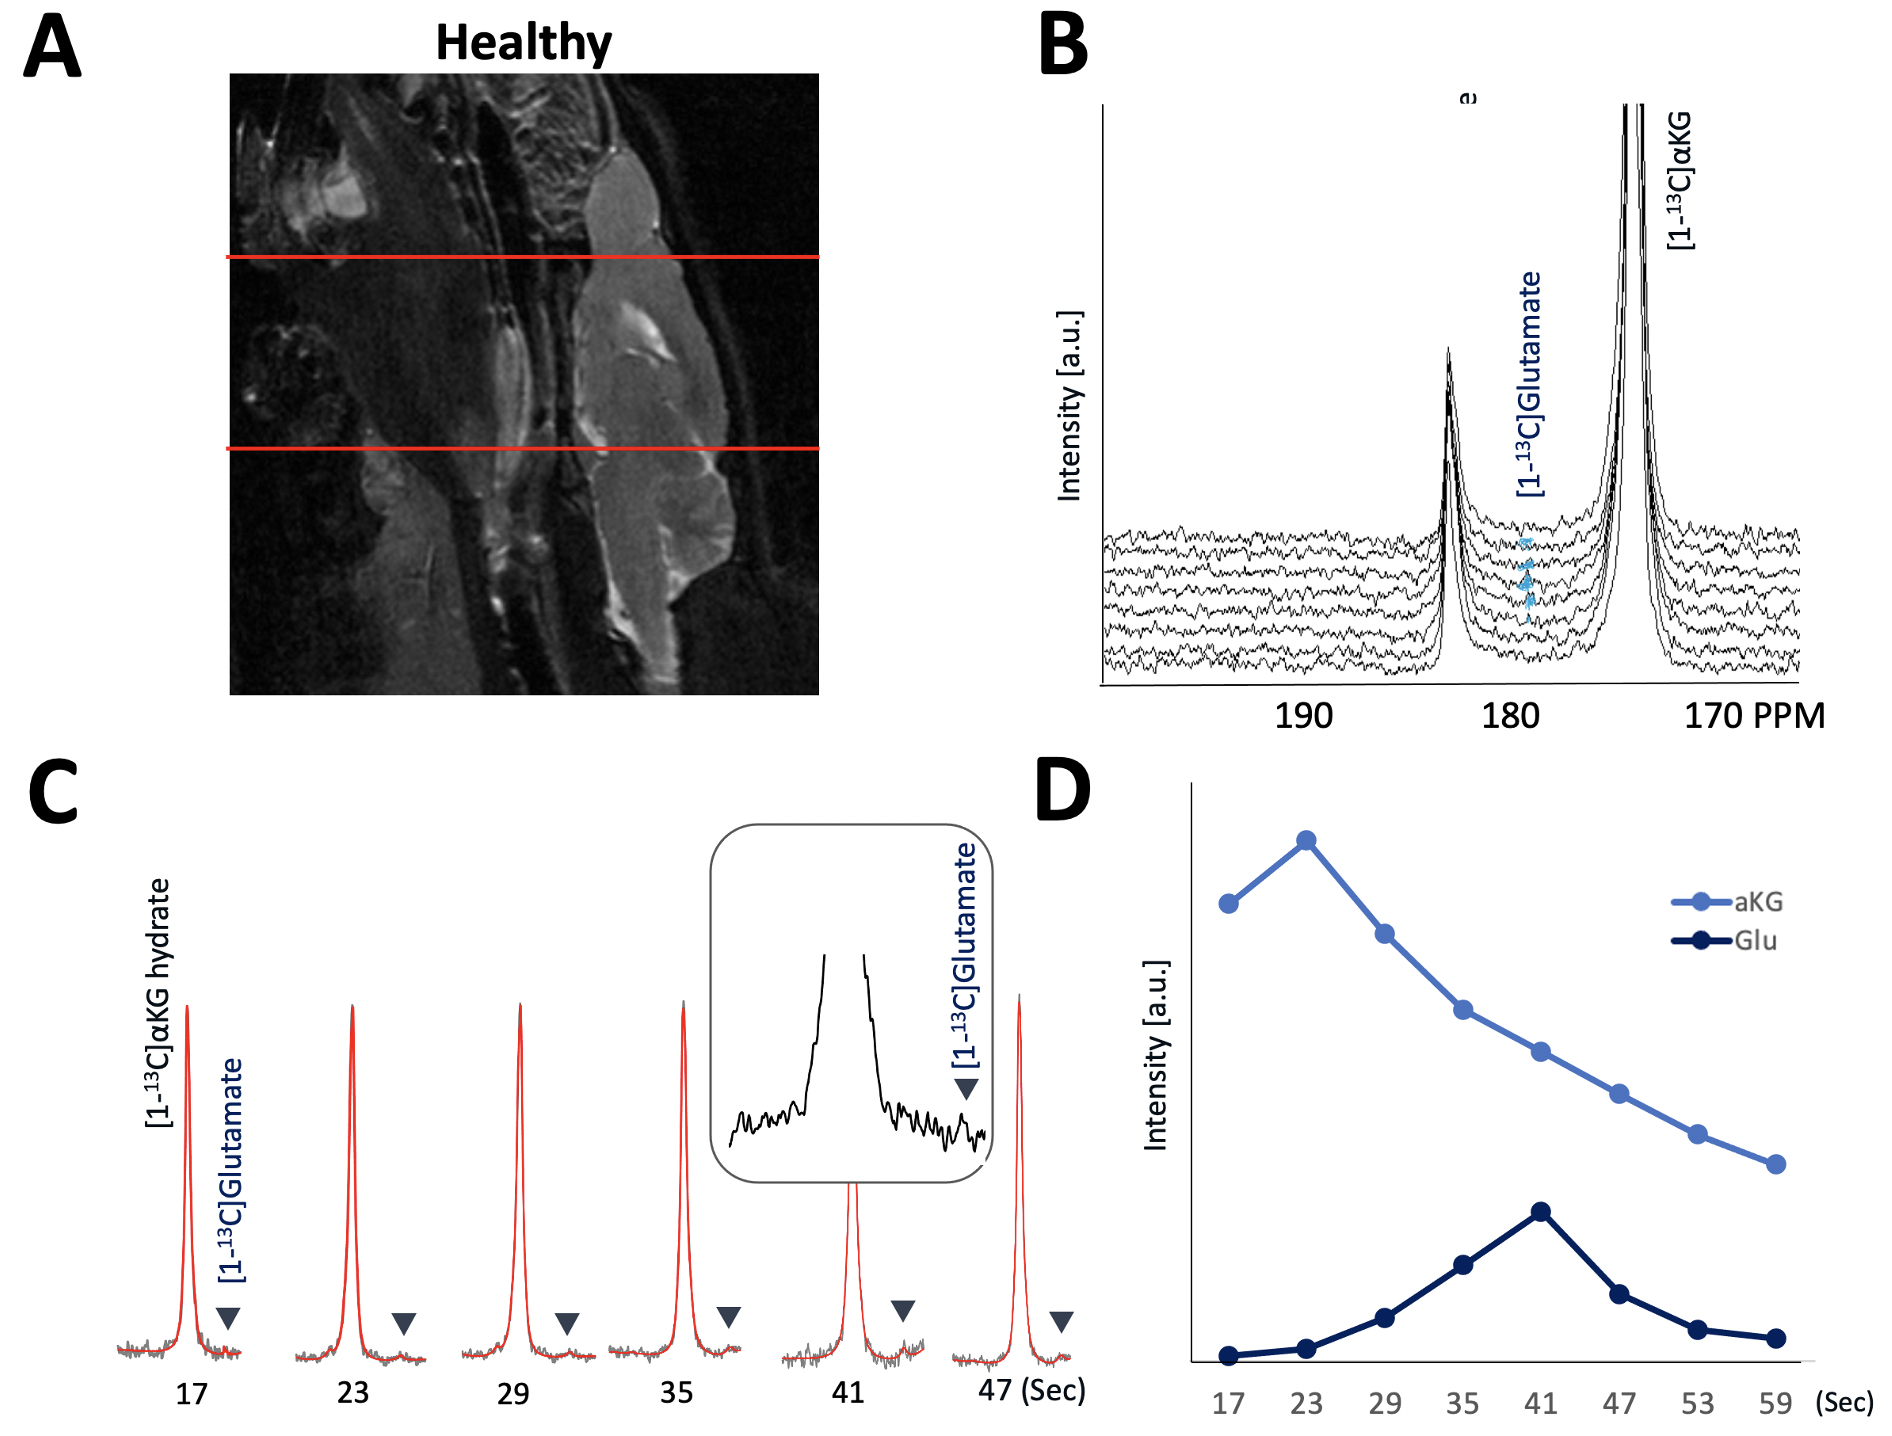
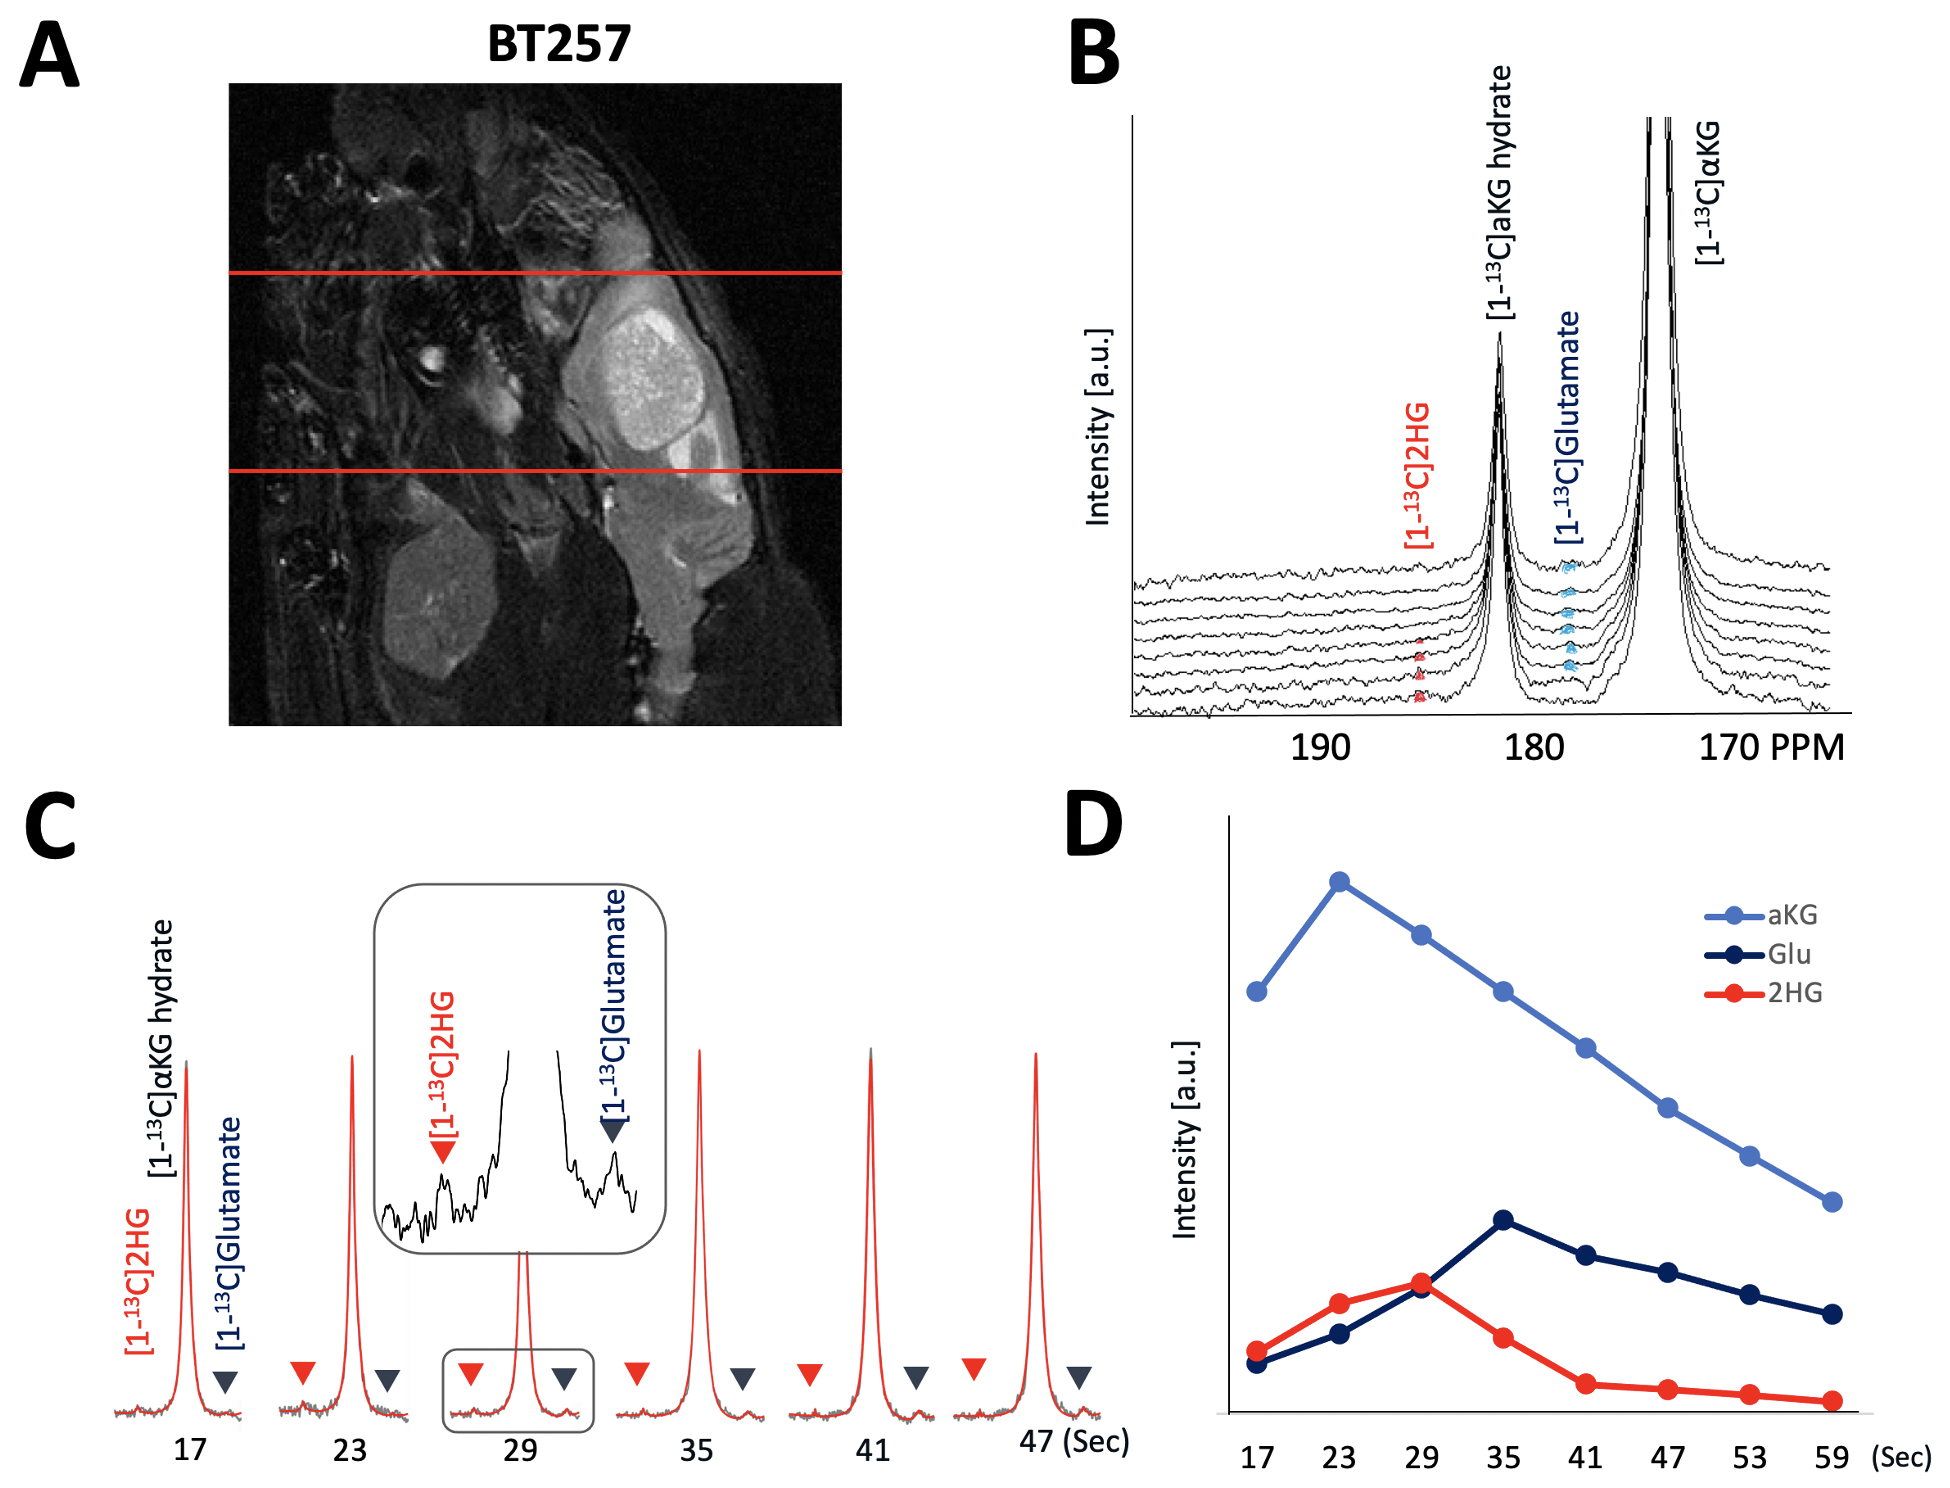
As illustrated in Figure 1, injection of the hyperpolarized [1-13C-5-12C]αKG into cell lysates showed clearly detectable dynamic conversion of hyperpolarized [1-13C-5-12C]αKG to 2HG and glutamate. Importantly, and in contrast to previous results in those cells (1,2), only the 2HG peak was detected at 183.9 ppm, without the presence of the natural abundance [5-13C]αKG at 184 ppm. The SNRs of [1-13C-5-12C]αKG, [1-13C]2HG, and [1-13C]glutamate were ~8000, ~6.5, and ~26.7, respectively, at 24 sec when 2HG levels were maximum. 2HG and glutamate kinetics are illustrated in Figure 1C. Figure 2 illustrates our findings in the normal brain. They show clear production of glutamate, consistent with previous observations in the normal-appearing brain of tumor-bearing rats. This data also confirms that [1-13C-5-12C]αKG readily crosses the blood-brain barrier. Figure 3 illustrates our findings in the BT257 patient-derived astrocytoma-bearing rats. Following injection of hyperpolarized [1-13C-5-12C]αKG, we were able to clearly detect the dynamic production of both 2HG and glutamate. The SNRs of [1-13C-5-12C]αKG, [1-13C]2HG, and [1-13C]glutamate in the in vivo data were ~730, ~2.3, and ~3.5, respectively when products were maximum (29 sec for [1-13C-5-12C]αKG and [1-13C]2HG, and 35 sec for glutamate, post [1-13C-5-12C]αKG injection).Discussion
In this study, we demonstrate the utility of hyperpolarized [1-13C-5-12C]αKG as a substrate to clearly assess 2HG production without the confounding presence of the natural abundance peak which cannot be distinguished from 2HG in vivo. Importantly, the detection of 2HG provides a clear indicator of the IDH mutation within the tumor. At the same time, and using the same sequence, we were also able to detect glutamate production, reflecting a key metabolic pathway in the normal brain. Importantly, and in contrast to previous work that used a genetically engineered GBM-based model, this in vivo study was performed using normal tumor-free animals and animals with a patient-derived mutant IDH1 astrocytoma model, indicating that αKG crosses the BBB and is therefore likely useful for investigating both abnormal αKG metabolism and normal glutamate production. Finally, our studies were performed at 3 T, demonstrating that we are able to detect the fate of αKG at a clinical field strength. Collectively this study indicates that hyperpolarized [1-13C-5-12C]αKG could be readily translated to the clinic to monitor both IDH status and normal glutamate production.Acknowledgements
This work was supported by NIH R01CA172845, NIH R01CA197254, UCSF LOGLIO collective, NICO project, and NIH P41EB013598 Hyperpolarized MRI Technology Resource Center Grant.References
1. Chaumeil MM, Larson PE, Yoshihara HA, Danforth OM, Vigneron DB, Nelson SJ, Pieper RO, Phillips JJ, Ronen SM. Non-invasive in vivo assessment of IDH1 mutational status in glioma. Nature communications 2013;4(1):1-12.
2. Molloy AR, Najac C, Viswanath P, Lakhani A, Subramani E, Batsios G, Radoul M, Gillespie AM, Pieper RO, Ronen SM. MR-detectable metabolic biomarkers of response to mutant IDH inhibition in low-grade glioma. Theranostics 2020;10(19):8757-8770.
3. Chaumeil MM, Larson PE, Woods SM, Cai L, Eriksson P, Robinson AE, Lupo JM, Vigneron DB, Nelson SJ, Pieper RO. Hyperpolarized [1-13C] glutamate: a metabolic imaging biomarker of IDH1 mutational status in glioma. Cancer research 2014;74(16):4247-4257.
4. Miura N, Mushti C, Sail D, AbuSalim JE, Yamamoto K, Brender JR, Seki T, AbuSalim DI, Matsumoto S, Camphausen KA. Synthesis of [1‐13C‐5‐12C]‐alpha‐ketoglutarate enables noninvasive detection of 2‐hydroxyglutarate. NMR in Biomedicine 2021;34(11):e4588.
5. Hong D, Batsios G, Viswanath P, Gillespie AM, Vaidya M, Larson PEZ, Ronen SM. Acquisition and quantification pipeline for in vivo hyperpolarized 13C magnetic resonance spectroscopy. Magnetic resonance in medicine 2021. In Press. DOI: 10.1002/mrm.29081
Figures