1059
Signal prediction in echo dimension of multi-echo gradient echo using multi-layer seq2seq model1Department of Electrical and Electronic Engineering, Yonsei University, Seoul, Korea, Republic of
Synopsis
The mGRE(multi-echo gradient echo) sequence has previously been used for MWF(Myelin water fraction) imaging. Such mGRE observes signal decay by obtaining multiple echo signals, but scan time increases as more echoes are obtained. To solve this trade-off, we developed a deep learning model based on a LSTM model that can reduce scan time by predicting the later echoes using only the early echoes. Looking at the in vivo results and various performance test, our network has lower RMSE and higher PSNR than NLLS(Non-linear least squares), a conventional fitting algorithm.
INTRODUCTION
Multi-echo gradient echo (mGRE) is used in many fields including Myelin water fraction (MWF) because of its technical advantages such as intensity to B1 inhomogeneity and lower specific absorption rate1-3. Obtaining more echoes increases the accuracy of the MWF fitting1, but it would inevitably increase the scan time. Typical echoes collect up to approximately 30ms echo time at 3T. There is no conventional approach of acquiring the subsequent signals in echo direction using obtained early signals, therefore we propose a new signal prediction method using deep learning.METHODS
[Preprocessing]The training data were divided into magnitude and phase for each channel respectively and normalized as shown in Figure. 1. The magnitude signal was normalized with the magnitude of first echo and min-max normalization was applied to the unwrapped phase signal.
[Multi-layer seq2seq network]
The basic seq2seq model consists of LSTM as shown in Fig. 1 and it is divided into Encoder and Decoder4. We built a multi-layer seq2seq model by stacking several basic seq2seq model. Our new Multi-layer seq2seq model used the output of the previous seq2seq model as the input of the next seq2seq model. And whenever a new output is added as an input, the first value of the existing input is not used. Therefore, it predicts the (N+1)th signal using signals up to the Nth echo. It is trained by comparing the outputs of each layer with the label.
As shown in Fig. 1, the reason that the length of the input is kept short and the length of the layer is increased is to compensate for the disadvantage that the existing seq2seq model is difficult to remember all information as the length of the input becomes longer. In conclusion, the multi-layer helps to understand the local information of the mGRE signal as each layer acts like a moving window.
[In-vivo Data acquisition]
We acquired mGRE data from 20 healthy subjects, with following image parameters : 3T MRI, TR = 60ms, spatial resolution = 2mm×2mm×2mm, first TE = 1.6ms, echo spacing = 1.1ms, last TE = 31.8ms. The 1st echo (1.6ms) to the 8th echo (8.9ms) were used as input, and the remaining 22 echoes were used as labels. Of the 20 subjects, 18 were used as the training dataset and 2 were used in the testing dataset.
[Evaluation]
To evaluate the performance of the proposed network, we compared the PSNR and RMSE of the network with NLLS, a common fitting algorithm.1-2. In addition, correlations were compared through MWF to compare whether the mGRE signal generated by the proposed method conveys accurate information.
RESULTS
Figure.2 shows the magnitude and phase prediction results of TE=(9.96, 17.24, 24.52, 31.8)ms in two methods and network has lower difference than NLLS.In addition, two methods for 9~30 echo of 20 slices were quantitatively analyzed. NLLS had an overall higher RMSE than the proposed method, especially in subsequent echoes as shown in Figure.3.A. In Fig.3.B, The PSNR of the Network always had higher values than NLLS. The two methods were compared according to the increase in the number of echoes to be predicted in Fig.3.C. As the number of echoes to be predicted increased, the difference and variance of NLLS increased compared to the network.
The predicted mGRE data was compared with the real mGRE using MWF to confirm that the network generated accurate signals in Figure. 43. In particular, the correlation between the two methods is shown in Fig.4.B with an RMSE of 1.15% and a small bias of 0.7%.
Figure. 5 shows an in-vivo example where the network output could be advantageous compared to conventional method. The original mGRE suffers from artifacts such as B0 inhomogeneity and loses the signal information at late echoes (yellow box of Fig.5.)5-6. However, the result of network can predict more similar structure as MPRAGE without data loss as shown in Fig.5.A. In addition, the Fig.5.B shows that the proposed method can generalize to unseen structure as shown in the patient lesion.
DISCUSSION AND CONCLUSION
In this study, we propose a new mGRE signal prediction method in echo dimension based on multi-layer seq2seq model. The proposed method showed more accurate prediction results than NLLS, which is the existing mGRE data fitting algorithm in various experiments. Also, MWF can be successfully obtained through the predicted mGRE. In conclusion, this work can contribute to reduce the scan time of mGRE sequence since there is no necessity to collect subsequent echoes.Acknowledgements
No acknowledgement found.References
1. Nam Y, Lee J, Hwang D, Kim D-H. Improved estimation of myelin water fraction using complex model fitting. NeuroImage 2015;116:214-221.
2. Lee H, Nam Y, Lee H-J, Hsu J-J, Henry RG, Kim D-H. Improved three-dimensional multi-echo gradient echo based myelin water fraction mapping with phase related artifact correction. NeuroImage 2018;169:1-10.
3. Jung S, Lee H, Ryu K, Song JE, Park M, Moon WJ, Kim DH. Artificial neural network for multi‐echo gradient echo–based myelin water fraction estimation. Magnetic Resonance in Medicine 2021;85(1):380-389.
4. Sutskever I, Vinyals O, Le QV. Sequence to sequence learning with neural networks. 2014. p 3104-3112.
5. Port JD, Pomper MG. Quantification and minimization of magnetic susceptibility artifacts on GRE images. Journal of computer assisted tomography 2000;24(6):958-964.
6. Czervionke L, Daniels D, Wehrli F, Mark L, Hendrix L, Strandt J, Williams A, Haughton V. Magnetic susceptibility artifacts in gradient-recalled echo MR imaging. American journal of neuroradiology 1988;9(6):1149-1155.
Figures
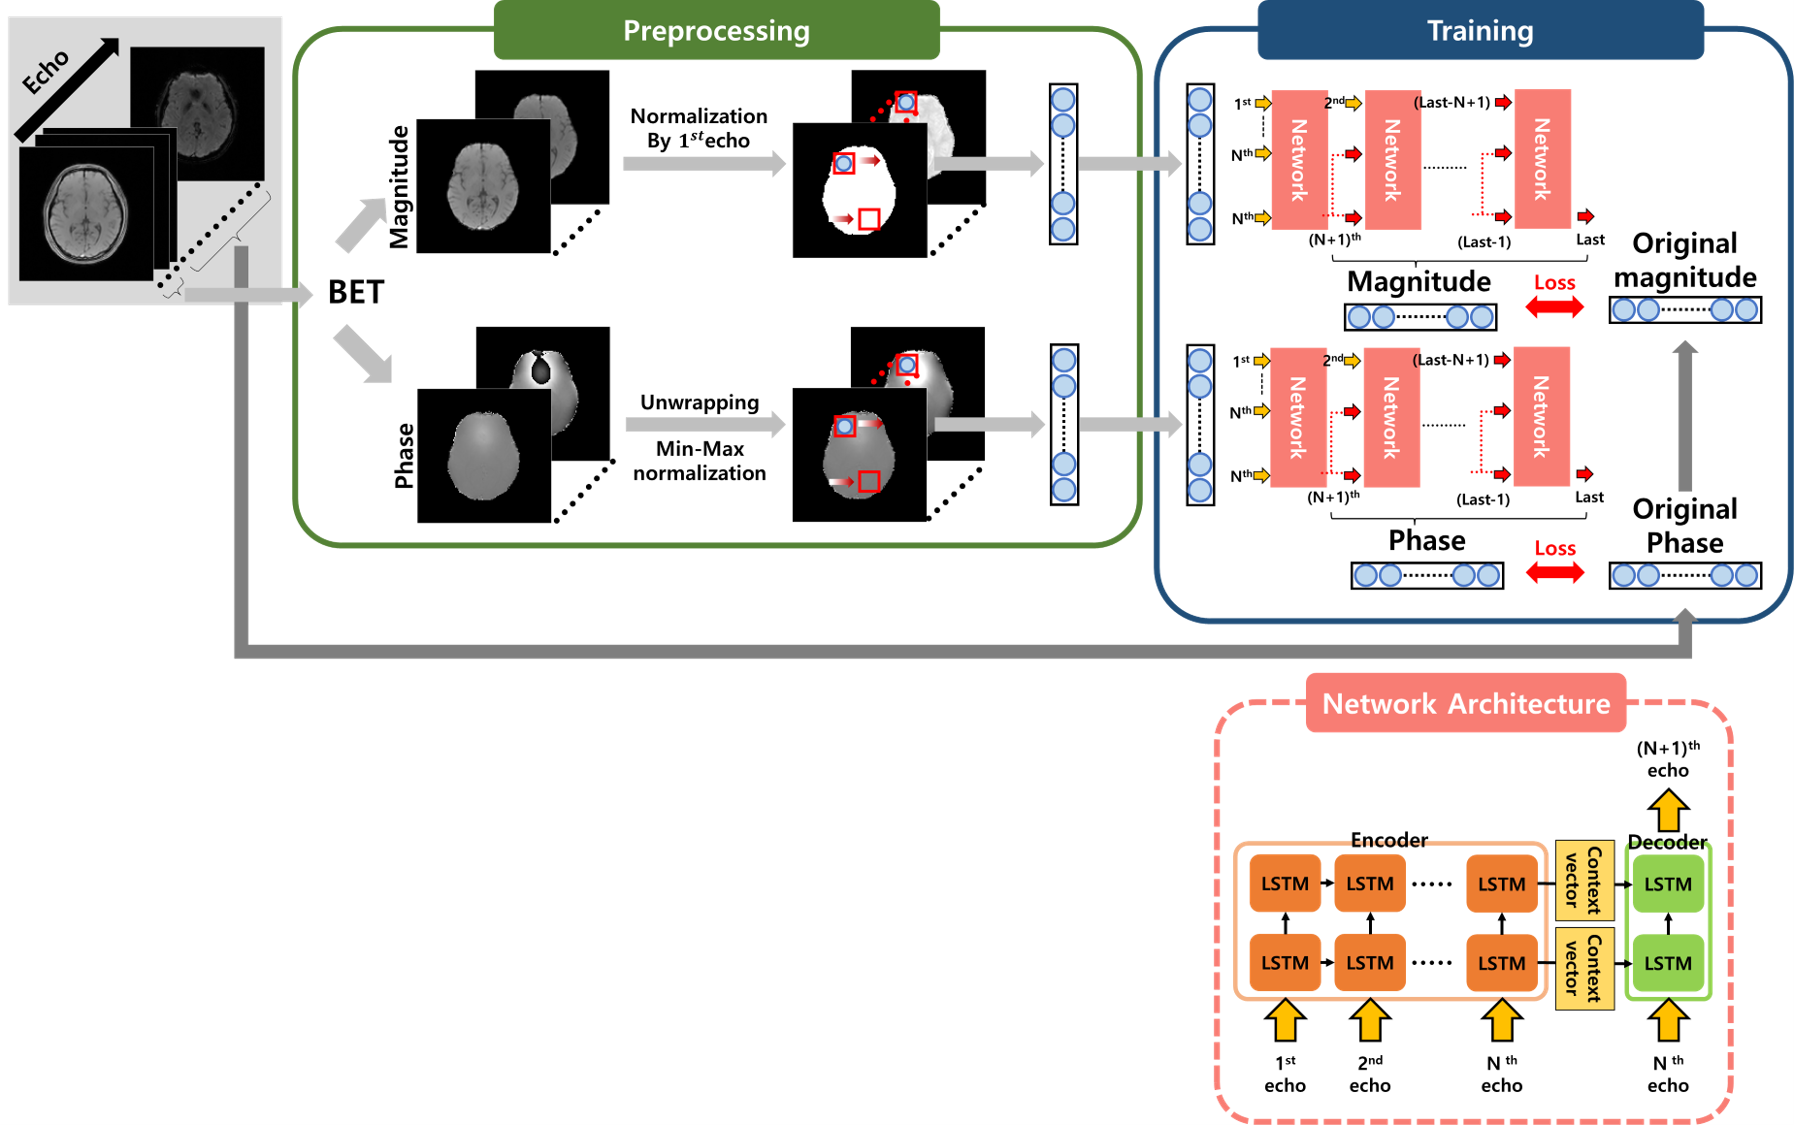
Figure 1. Data preprocessing and proposed network structure and training process
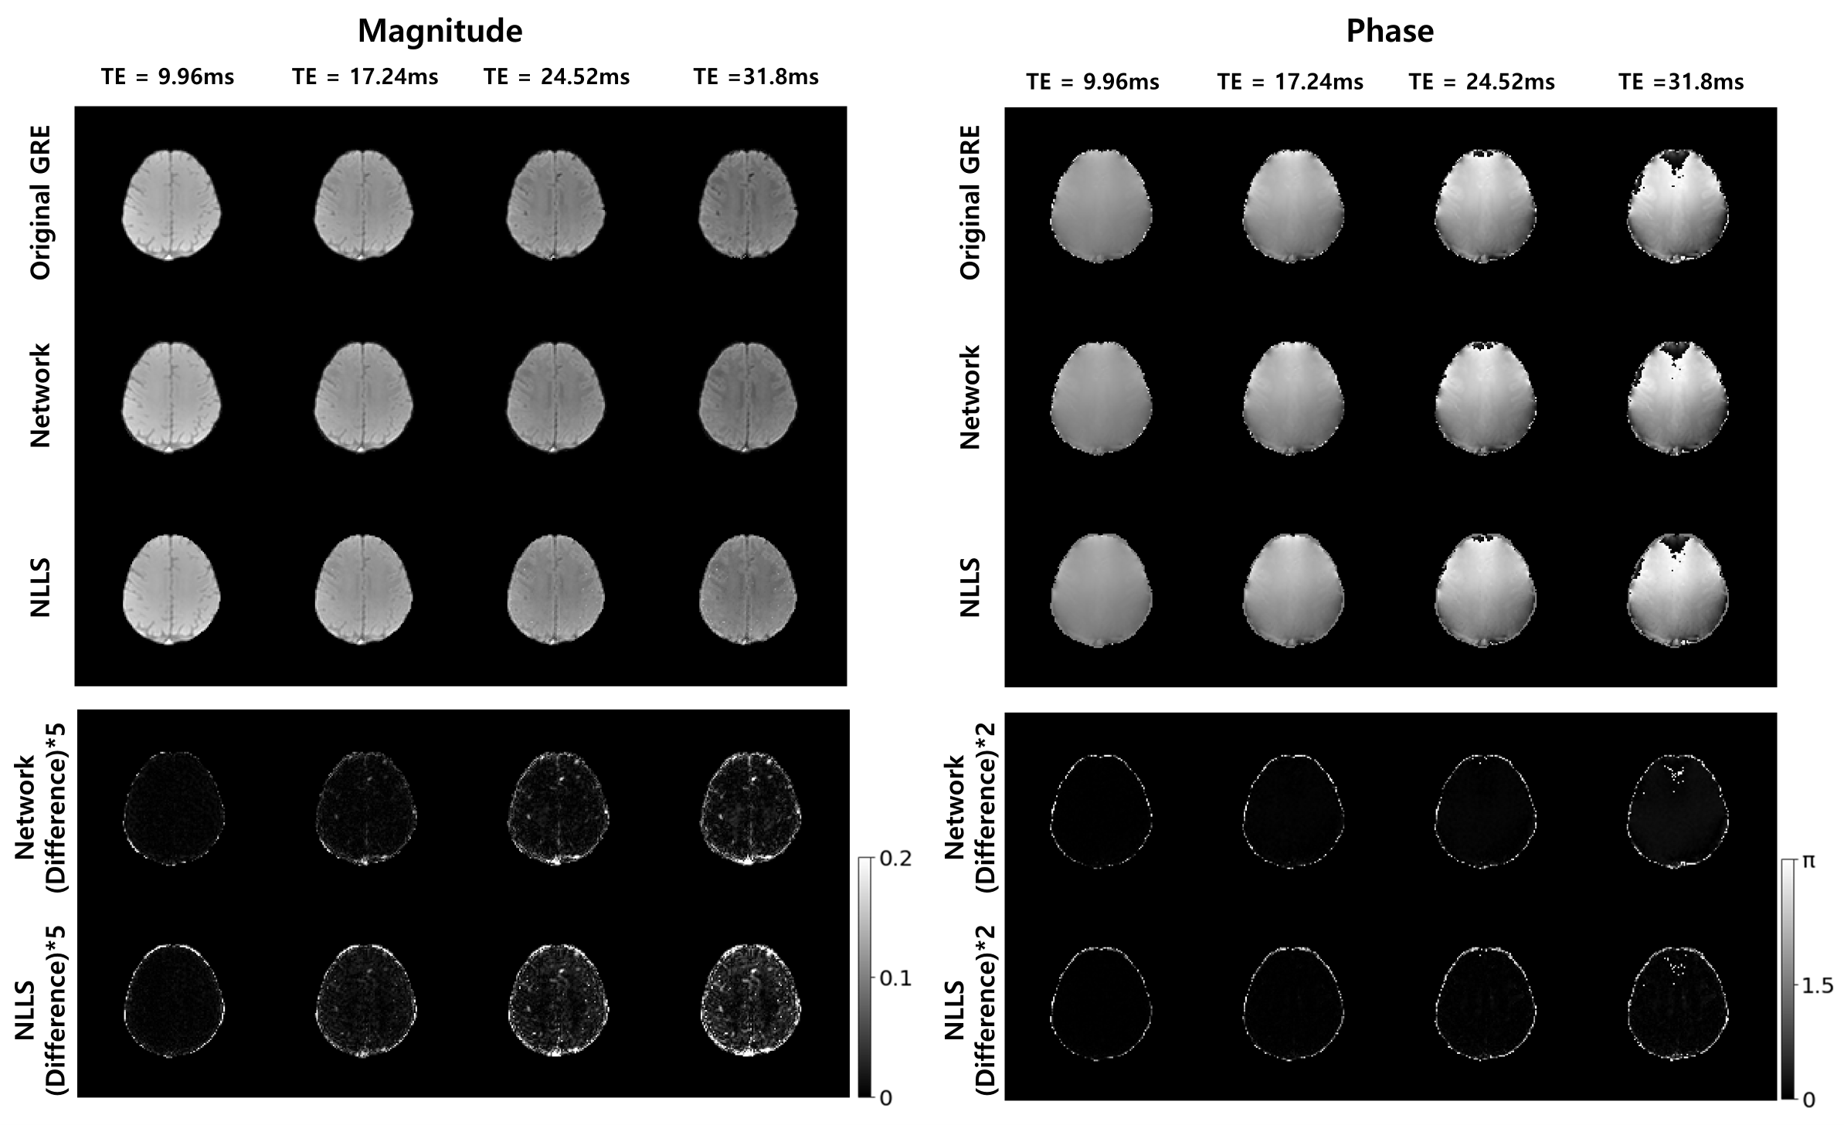
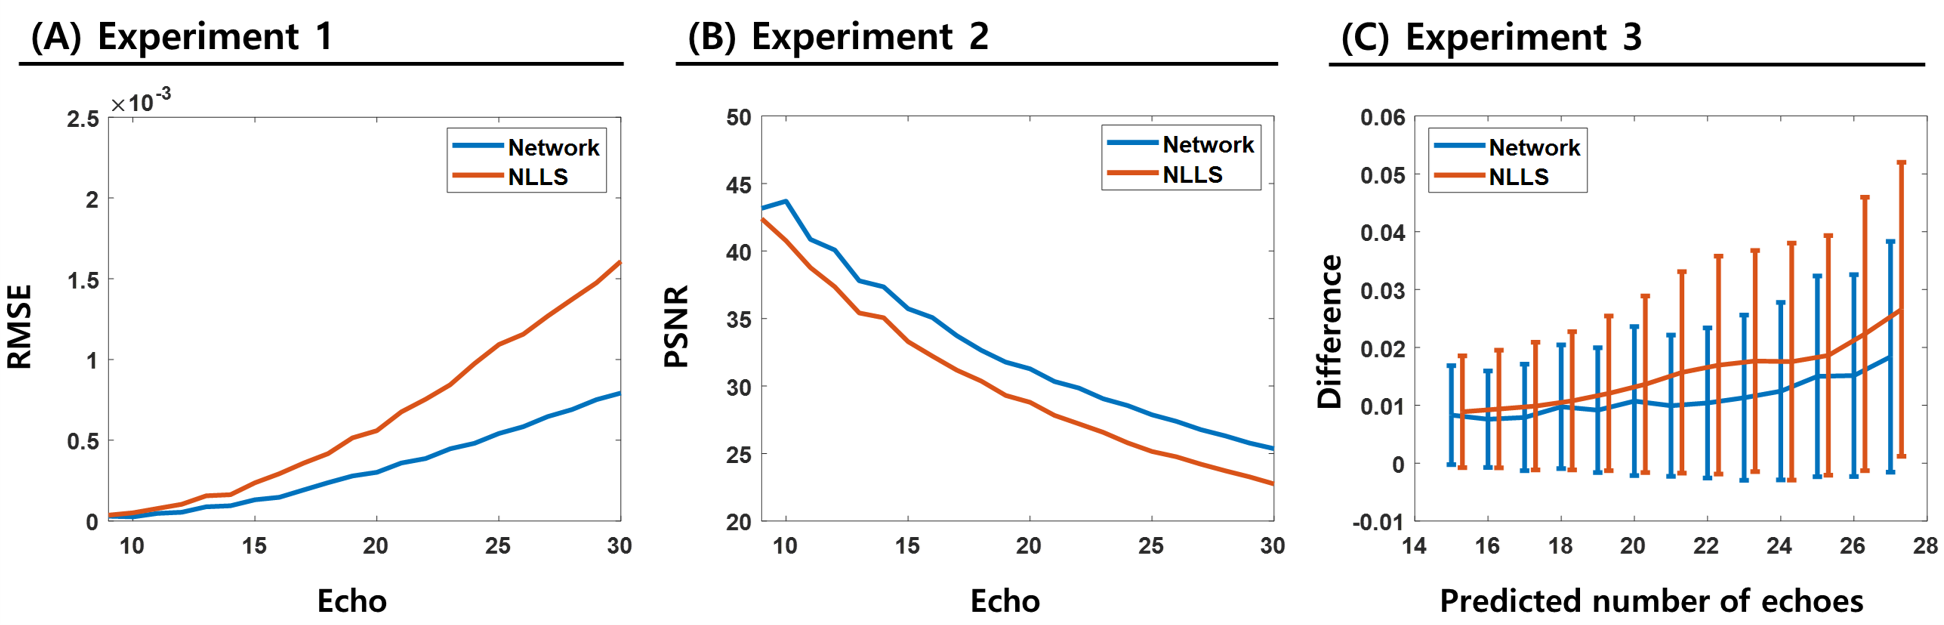
Figure 3. Numerical Comparison between Network and NLLS
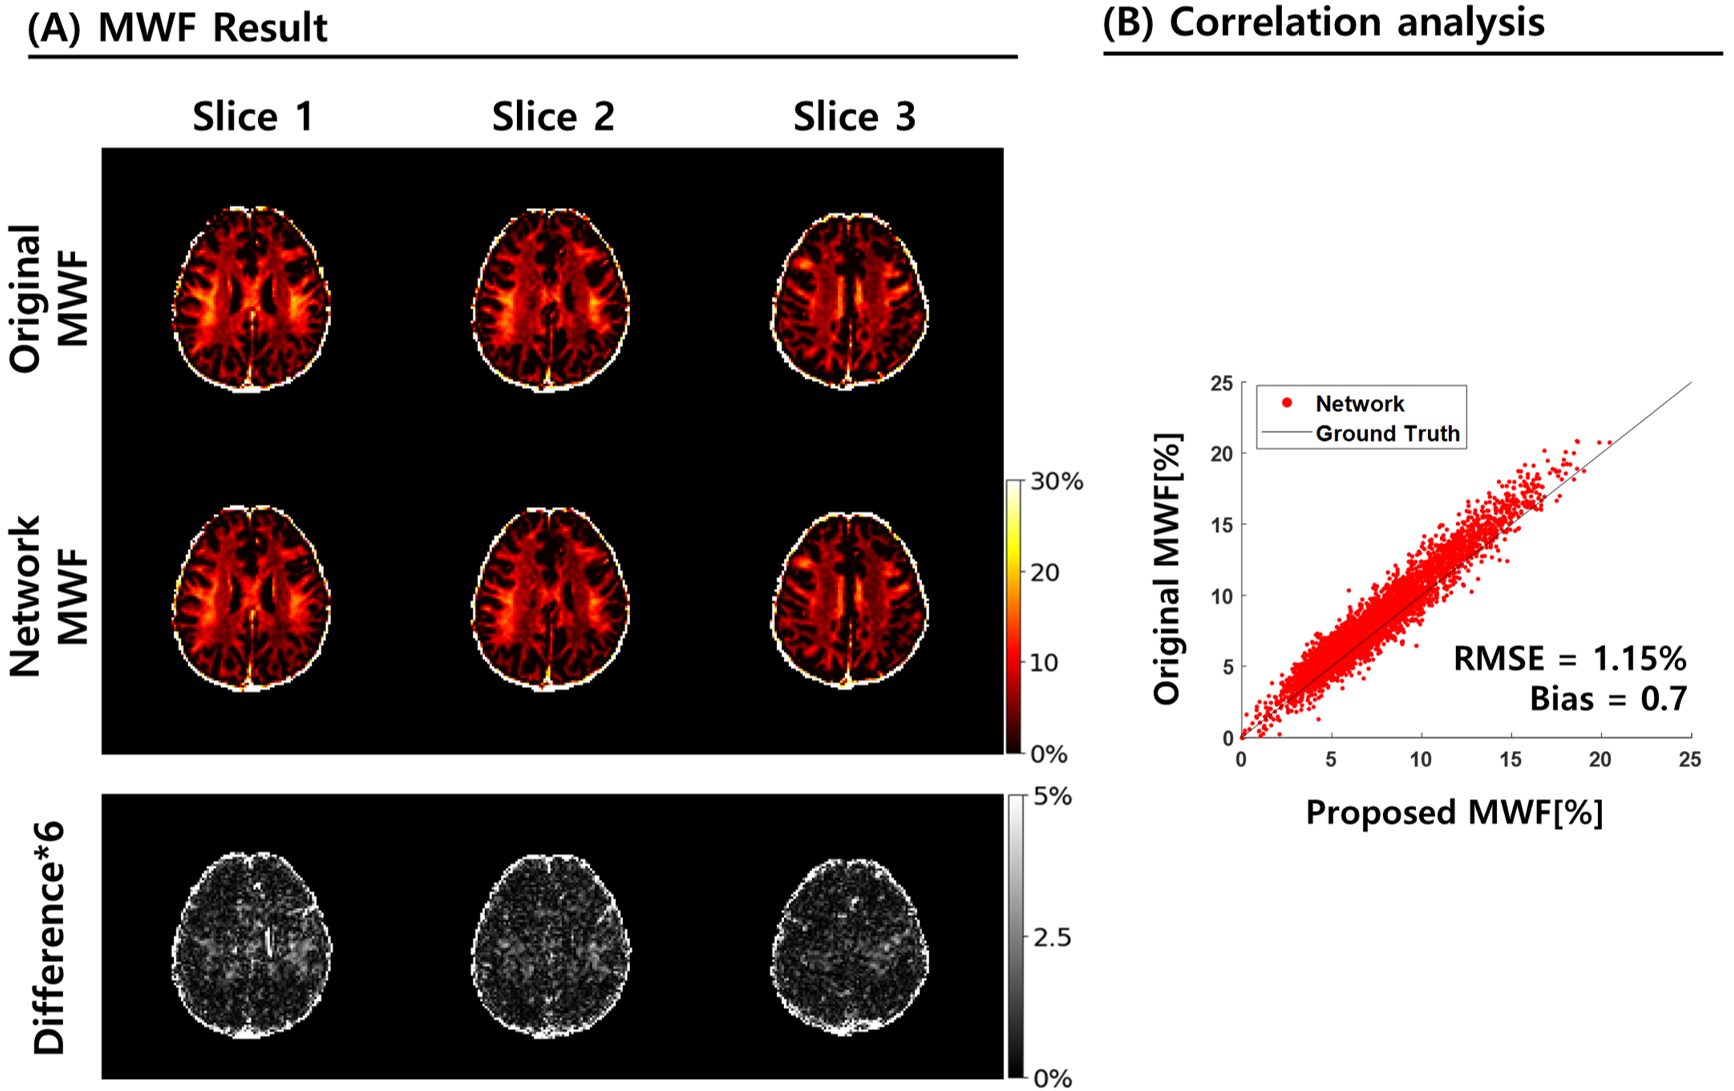
Figure 4. MWF map comparison and correlation generated from predicted GRE
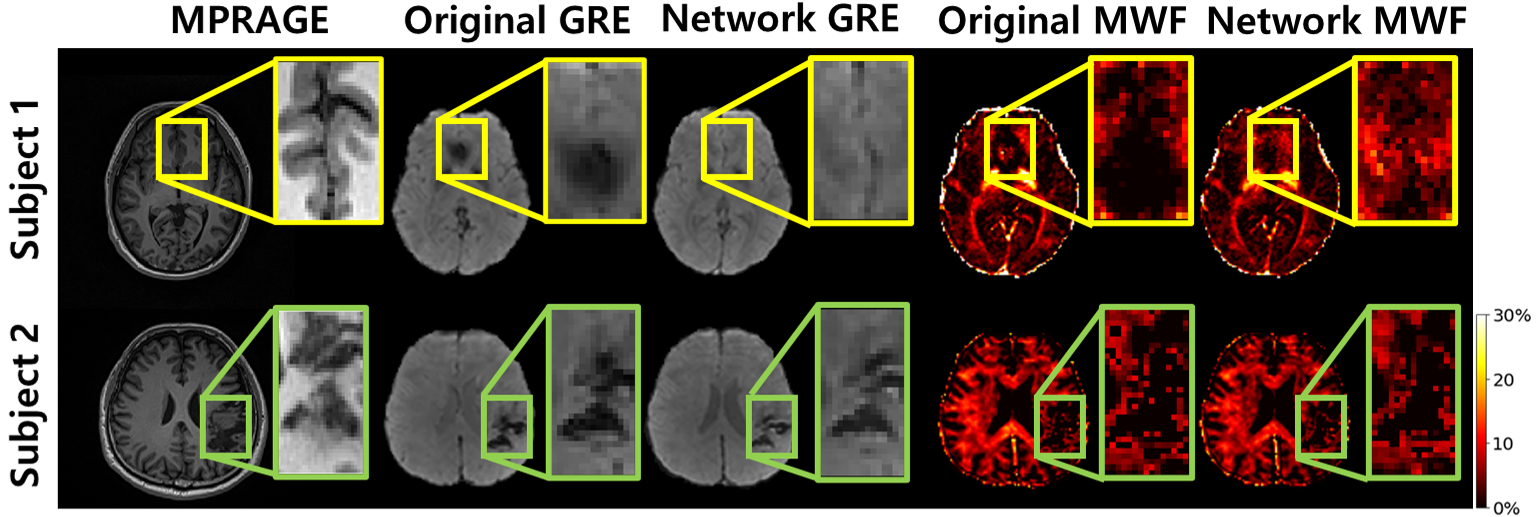
Figure 5. Result on b0 inhomogeneity regions (subject 1) and unseen data from patient (subject 2)