1057
Brain MR image super resolution using simulated data to perform in real-world MRI
Aymen Ayaz1, Kirsten Lukassen1, Cristian Lorenz2, Juergen Weese2, and Marcel Breeuwer1,3
1Biomedical Engineering Department, Eindhoven University of Technology, Eindhoven, Netherlands, 2Philips Research Laboratories, Hamburg, Germany, 3MR R&D – Clinical Science, Philips Healthcare, Best, Netherlands
1Biomedical Engineering Department, Eindhoven University of Technology, Eindhoven, Netherlands, 2Philips Research Laboratories, Hamburg, Germany, 3MR R&D – Clinical Science, Philips Healthcare, Best, Netherlands
Synopsis
We propose to simulate a large set of anatomically variable voxel-aligned and artifact-free brain MRI data at different resolutions to be used for training deep-learning based Super Resolution (SR) networks. To the best of our knowledge, no such efforts have been made in past regarding use of simulated data to train a SR network. We trained a SR network using such simulated data and tested the performance on real-world MRI data. The trained network could significantly sharpen low-resolution input MR images and clearly outperformed classic image interpolation methods.
Introduction
In clinical practice, High-Resolution (HR) MRI is desirable for accurate disease diagnosis. Due to its relatively long scan time, patient motion, and hardware limitations, the spatial resolution of MRI is limited. HR MRI acquired is also prone to unacceptable motion artefacts. Deep learning based Super Resolution (SR) networks1,2,3 are a promising approach and can produce superior MRI images from a Low-Resolution (LR) counterpart. Such SR networks are trained on a large number of paired HR-LR MRI data. The training data is usually acquired from the MRI scanner at different resolutions, or a LR image is derived from the acquired HR counterpart by downsampling in image or frequency domain. In general, there is a lack of acquired paired LR-HR data and the HR data is often corrupted with unwanted artifacts. We propose to simulate a large set of voxel-aligned and artifact-free brain MRI paired data at different resolutions to train a SR network. To the best of our knowledge, no such efforts have been made in past regarding use of simulated data to train a SR network. Our SR network is tested on real MRI dataset, and outperforms classic image interpolation methods both quantitatively and qualitatively.Methods
Our Matlab based simulation framework (Figure 1) is used to simulate HR-LR paired T1w brain MRI. 200 patient-specific brain phantoms are derived from the HCP4 database by feeding high-resolution structural MRI data to the Philips proprietary fully automated complete brain segmentation tool, based on the fully convolutional network architecture that process images at multiple scales and different fields of view5. Each phantom is thereafter simulated for T1w contrast at HR-1mm and LR-2mm. A fixed matrix size of 224x224 is used for both generating 90 slices of HR and LR data.The overall architecture of the proposed 2D SR network is shown in Figure 2 (A) with an insight of the residual dense block in (B). A weighted loss function of edge-based loss and pixel loss is used from Seif et. al6. with weightings set to 0.9 and 0.1 respectively to maximize the sharpness over edge pixels. A patch wise approach is used to train the network in smaller images of size 64x64 with an overlap of 50% in both directions. The output 2D patches are merged together to form a HR image. The network is trained using the stochastic gradient descent optimizer with learning rate of 0.01, batch size of 32 on three NVIDIA TITAN Xp GPUs. The network is tested on real T1w brain MRI data from MRBrainS187. The real T1w MRI volumes have a size of 240x240x48 and voxel spacing of 0.95x0.95x3mm. The original images are taken as the Ground Truth (GT) HR images, and LR images are derived by low-pass filtering in k-space. A 2D tapered cosine window filtering is used to down sample HR MRI in k-space by a factor of 2 in each direction. The LR k-space is zero padded in both directions to make the matrix size equivalent to HR. The SR predictions are made on the input LR images, and realistic Gaussian noise is added.To compare SR images with classic image sampling techniques, Bi-Cubic Interpolated (BCI) images are generated by upsampling the LR images by a factor of 2 using bi-cubic interpolation. Image quality metrics of Structural Similarity Index (SSIM), Normalized Mean Square Error (NRMSE) and Peak Signal to Noise Ratio (PSNR) are computed for both SR and BCI images while having the original HR images as GT. A visual experiment is made showing axial slices side by side in pairs of GT-SR, and SR-BCI. Readers are asked to rate the image quality characteristics of contrast, SNR, sharpness, and diagnostic quality on a scale of 0-4 varying from excellent (as 0) to worst (as 4). The responses are recorded for the visual quality assessment.Results and Discussions
Our set of simulated paired brain MRI data is aligned on voxel level, does not have motion induced artifacts and is a perfect use case of training and optimizing any SR network. SR and BCI results on T1w real MRI for three different subjects are presented in Figure 3. The SR images have more details and sharpness over edges as compare to BCI. Also, the lesions (pointed with arrow) are well preserved and enhanced in SR image. SSIM, NRMSE and PSNR scores are listed in Figure 4(A) for both SR and BCI images. High SSIM and PSNR and low NRMSE scores of SR indicate better performance of SR over BCI. Reader scores for image contrast, SNR, sharpness and diagnostic quality are presented in Figure 4(B) as a frequency bar chart, also indicating higher scores of GT and SR images and lower ratings for BCI. Overall, the 2D SR network trained only on our simulated data performs well on the real MRI dataset, and outperforms bicubic interpolation.Conclusions
Using our simulation pipeline, a voxel-aligned and artifact-free brain MRI data at different resolutions is generated. Such data can be used to train SR networks that perform well on the real MRI data. Thus, limiting the need of HR MRI acquisitions.Acknowledgements
This work has been supported by openGTN (opengtn.eu) project grant in the EU Marie Curie ITN-EID program (project 764465).References
- Chen, Y., et al. “Brain MRI Super Resolution Using 3d Deep Densely Connected Neural Networks.” IEEE International Symposium on Biomedical Imaging, 2018.
- Du, J., et al. “Accelerated Super-resolution MR Image Reconstruction via a 3D Densely Connected Deep Convolutional Neural Network.” IEEE International Conference on Bioinformatics and Biomedicine, 2018.
- Zhang, Y., et al. “Residual DenseNetwork for Image Super-Resolution.” IEEE conference on computer vision and pattern recognition, 2018.
- Van Essen, David C., et al. "The WU-Minn human connectome project: an overview." Neuroimage, 2013.
- Brosch, Tom, and Axel Saalbach. "Foveal fully convolutional nets for multi-organ segmentation." Medical Imaging, 2018.
- Seif, G., et al. “Edge-Based Loss Function for Single Image Super-Resolution.” IEEE International Conference on Acoustics, Speech and Signal Processing, 2018.
- Grand Challenge on MR Brain Segmentation 2018. (MRBrainS18). https://mrbrains18.isi.uu.nl/
Figures
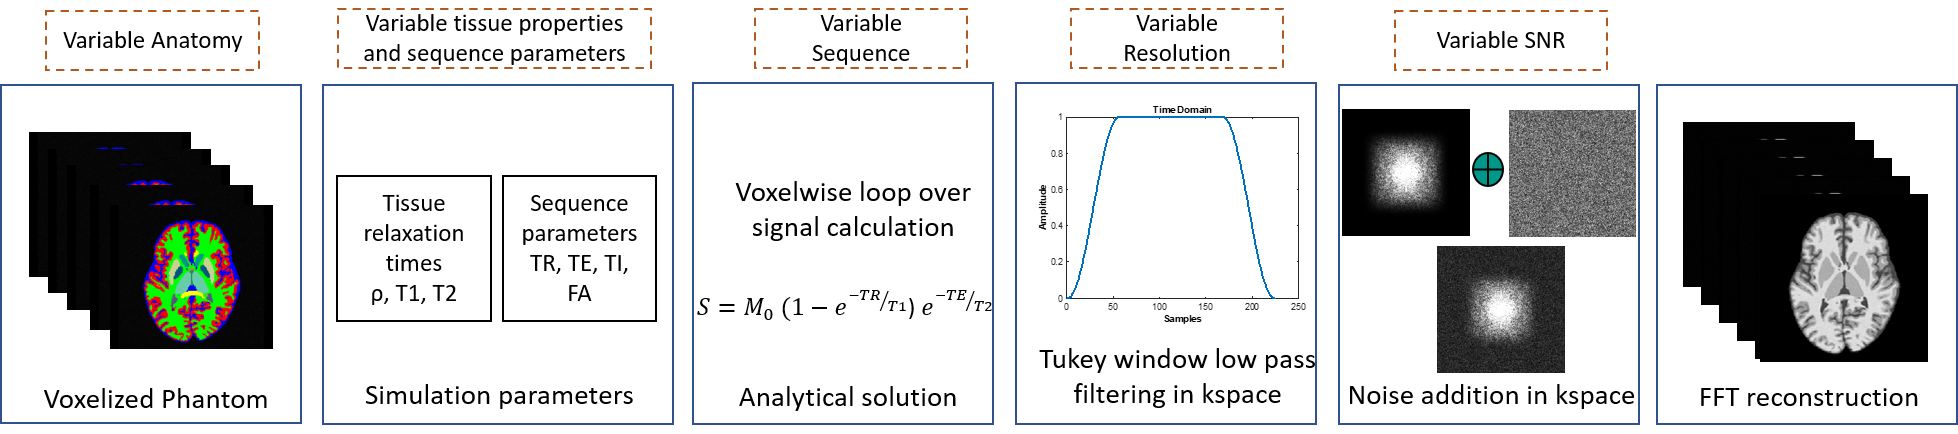
Figure 1: Our proposed simulation framework to simulate large sets of realistic T1w brain MRI at two different resolutions in pairs. Each phantom is simulated slice by slice with fixed number of slices and slice thickness of 2mm at 2D resolution of 1mm and 2mm.
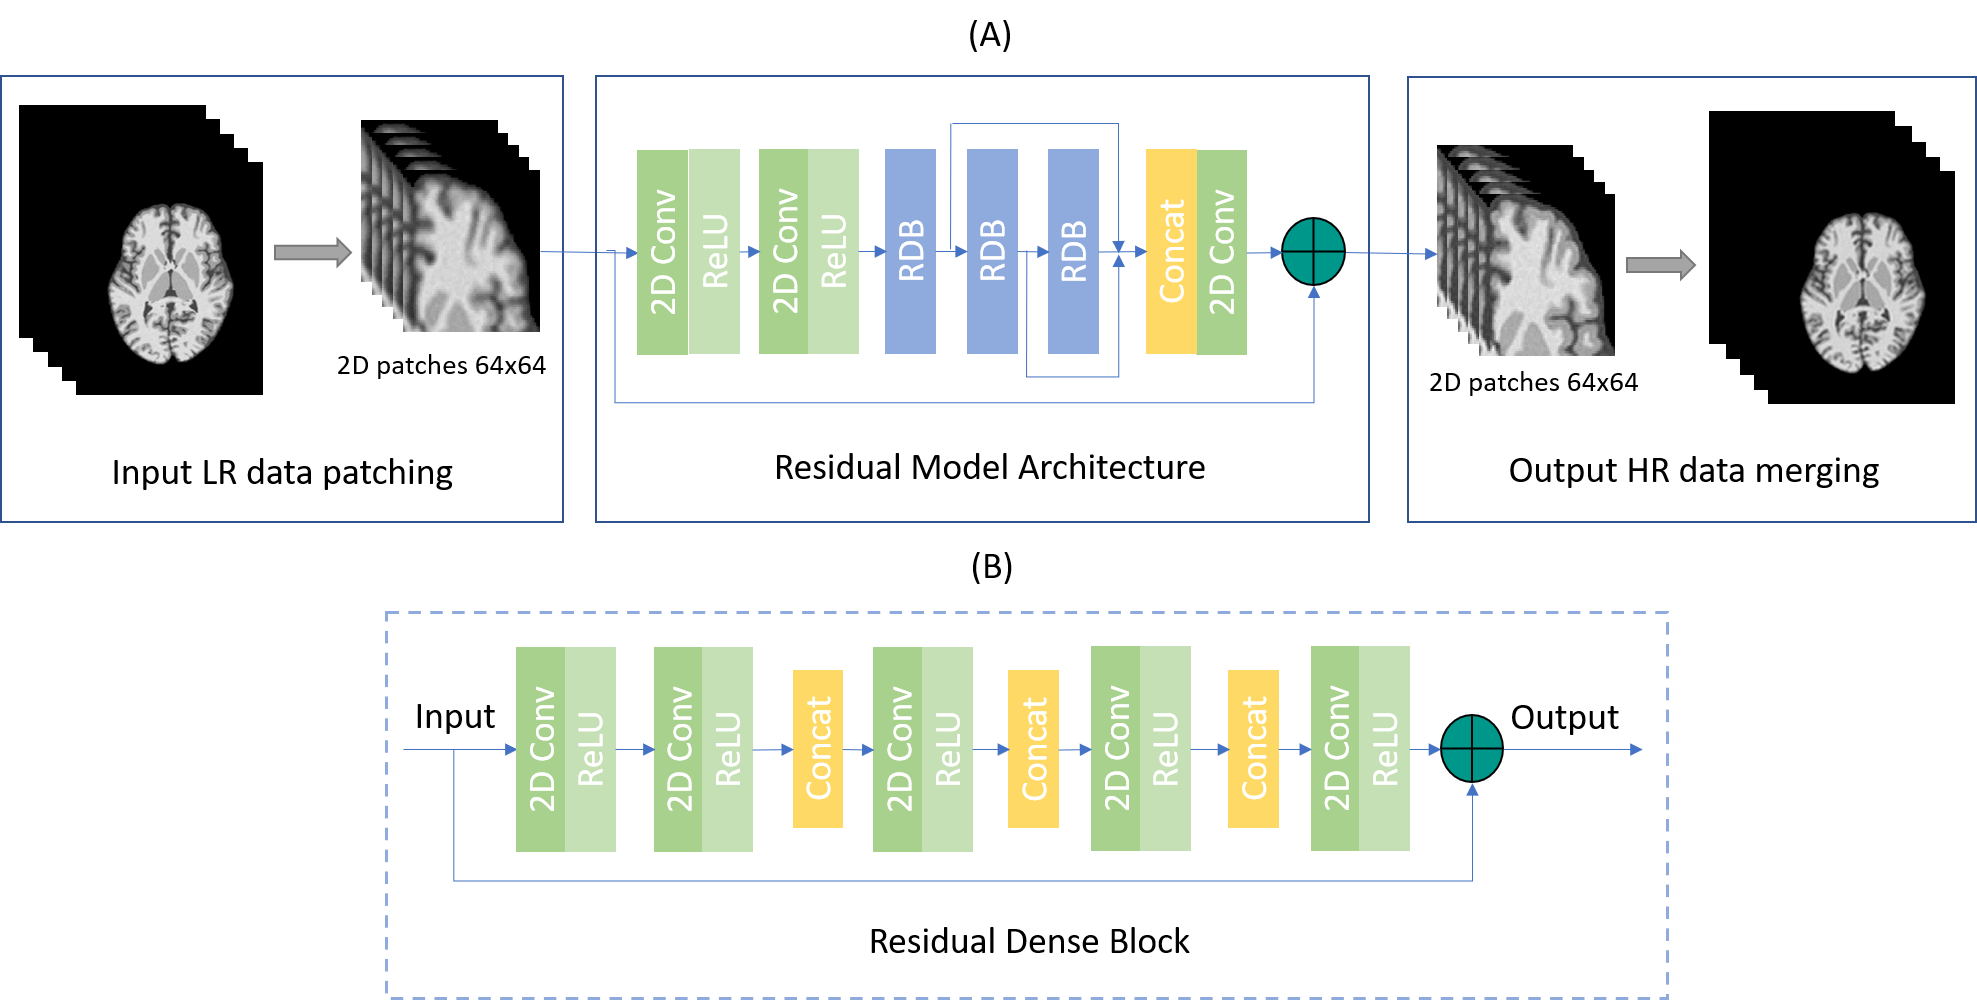
Figure 2: (A) Our proposed super resolution network based on global residual model architecture with multiple convolutional layers and three local residual dense blocks. (B) Each residual dense block having multiple dense connections and a local residual connection.
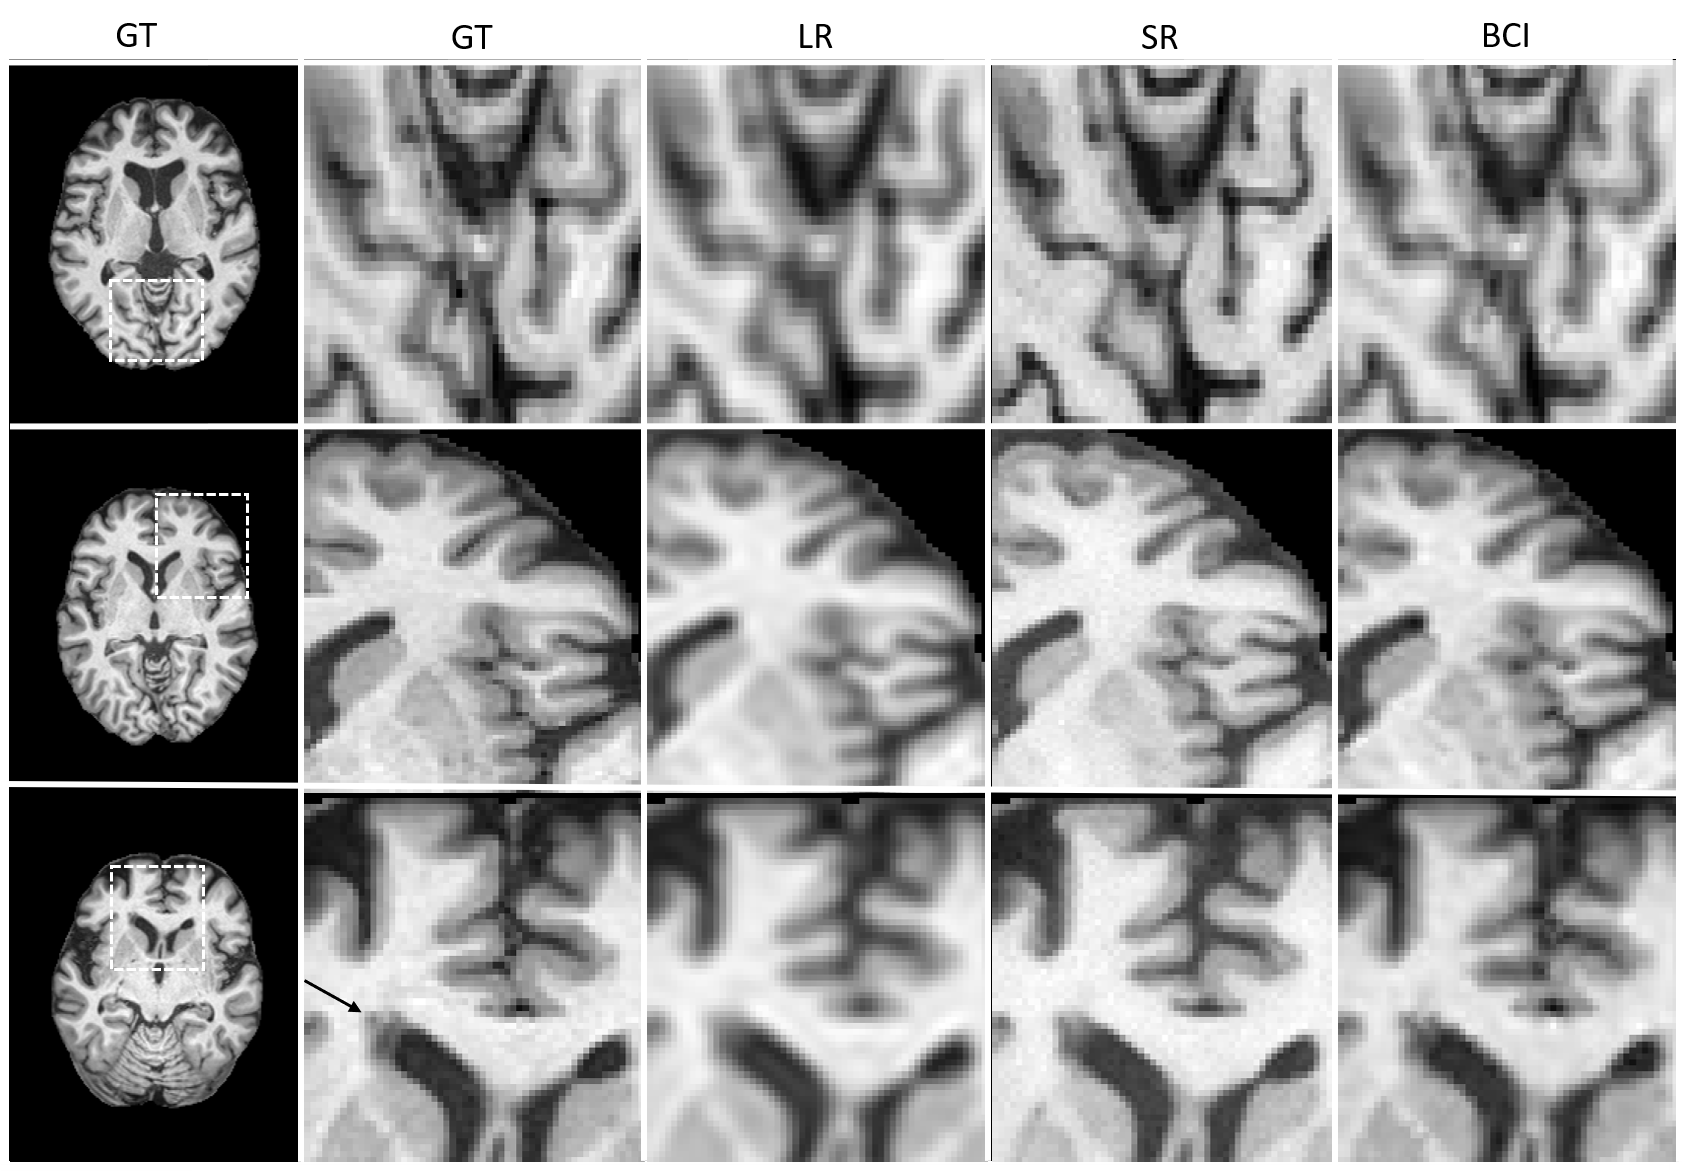
Figure 3: T1w real MRI centered-cut axial images of three different subjects. Full 2D slices of HR Ground Truth (GT) images are shown in first column followed by a zoom-in to a ROI at different cortex locations across subjects. ROI zoomed slices of GT, derived LR, predicted SR and BiCubic Interpolated (BCI) images are shown to draw a visual comparison for image details. In addition, an arrow is pointed for a subject GT ROI in last row to point the lesion presence.
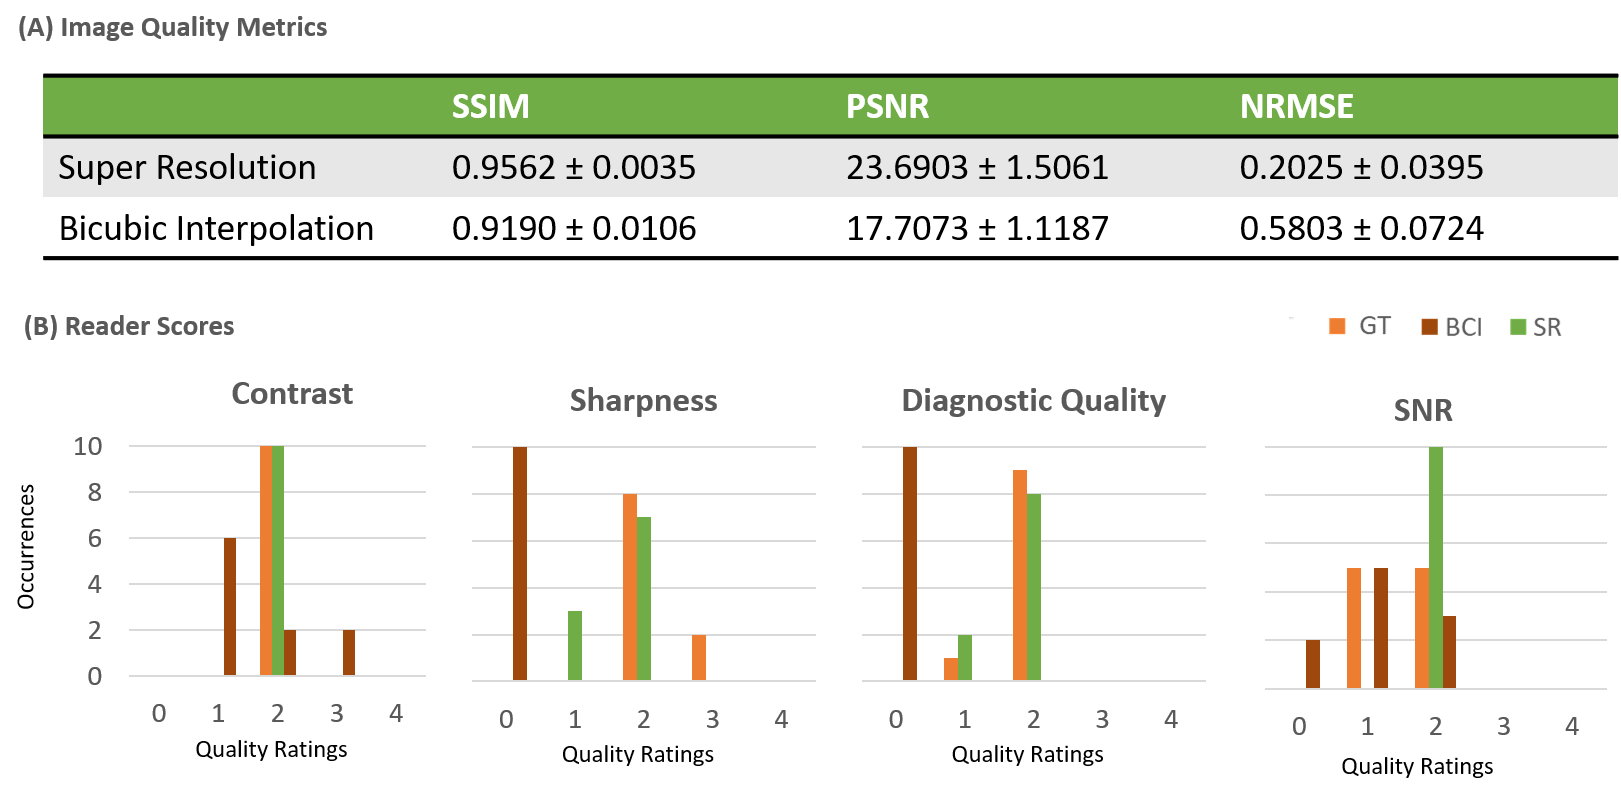
Figure 4: (A) Image quality metrics of SSIM, PSNR and normalized MSE of SR and BCI brain MRI volumes with real HR MRI as a ground truth. The values are presented as mean and standard deviation. (B) Reader scores for image quality ratings for some sample real HR GT, predicted SR, and BCI images. The quality ratings are on a scale of 0-4 varying from Excellent (as 0) to Worst (as 4).
DOI: https://doi.org/10.58530/2022/1057