1056
Accelerating MR Elastography using Deep Learning-Reconstruction of Undersampled Data1Department of Diagnostic Physics, Oslo University Hospital, Oslo, Norway, 2Department of Computational Radiology and Artificial Intelligence, Oslo University Hospital, Oslo, Norway, 3Biomedical Data Science Laboratory, Instituto Universitario de Tecnologías de la Información y Comunicaciones, Universitat Politècnica de València, Valencia, Spain
Synopsis
Problem summary: Brain MR elastography is associated with extended acquisition times, which is alleviated by reduced coverage or resolution. The aim of this project is to utilize deep learning to accelerate MRE. Methods: We employ an MRE for fully sampled acquisition. Undersampled data is simulated by masking phase-encoding steps. A cascaded reconstruction network is used to reconstruct the phase image from undersampled k-space. Results: There are subtle differences between the reconstructed and fully sampled phase images. We observe a non-significant difference for stiffness values in our preliminary results. Conclusions: The method shows promise for accelerating MR elastography data.
Introduction
Ristretto MR elastography (MRE) is an emerging technique using a modified gradient-echo sequence with motion encoding and a third-party mechanical transducer system to measure the elastic properties of tissue. To properly measure and estimate the path of the mechanical wave through tissue, a collection of data at regularly spaced intervals called wave phases is required. In traditional MRE, the same image volume must be re-scanned up to 8-times, making the total acquisition time too long for a clinical setting, or even for research protocols. Extended acquisition times may also lead to poor image quality from patient motion. To alleviate the issue of prolonged scans, most protocols use suboptimal image resolution and reduce the number of slices, resulting in partial coverage of the brain only. The goal of our study is to take advantage of a deep learning-based model to reconstruct undersampled MRE scans. To assess the viability of deep learning-based acceleration of Ristretto MRE, the resulting undersampled mechanical property map was compared with the fully-sampled ground truth map by histogram analysis, as well as by visual inspection.Methods
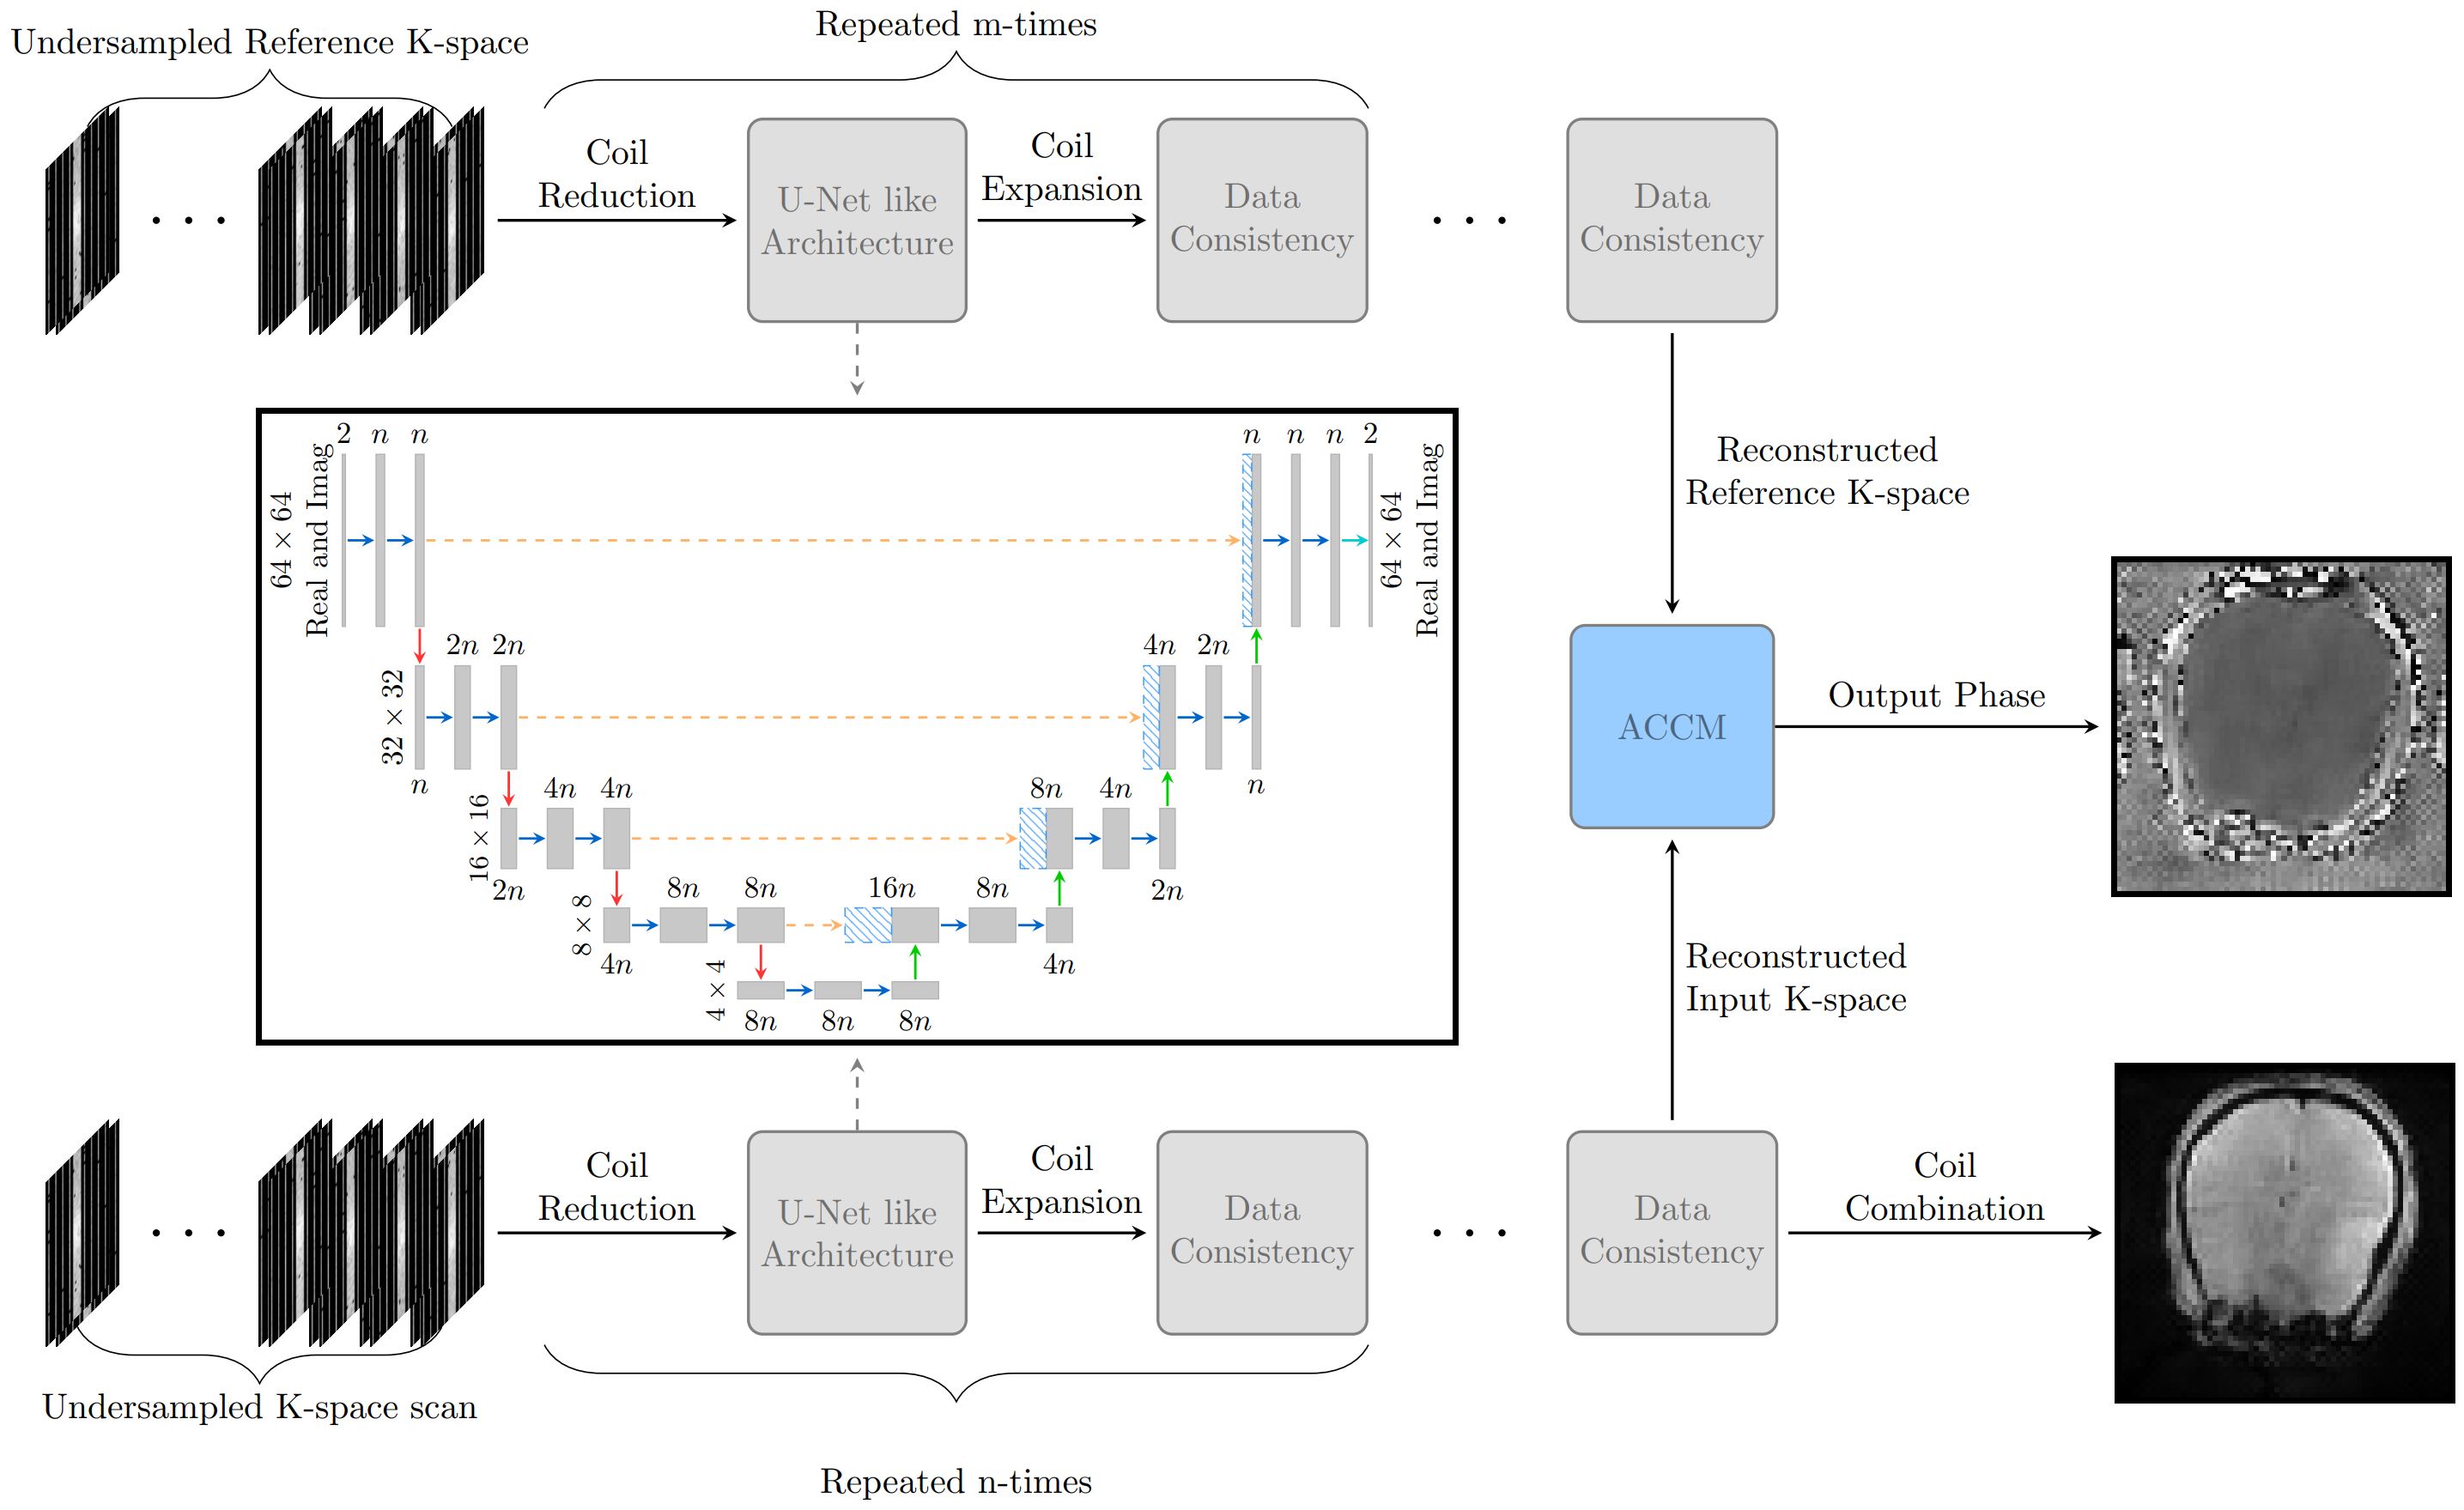
The study was approved by the national Research Ethics Committee and the Institutional Review Board. Informed consent was obtained from all patients. All data was acquired on a Premier 3T system (GE healthcare) with a 48-channel headcoil. EPIC pulse programming tools were used to modify a standard FGRE sequence for Ristretto MRE. The FGRE scan parameters were: FOV = 220 mm ✕ 220 mm, slice thickness = 3mm, 13 slices, no slice gap, TR = 15.7692ms, Slice-Slice TR = 205ms, TE 12ms, Flip angle = 20°, Nw/Nd = 5/1, Wave phases = 8, k-space dummy lines = 1. All data was collected without acceleration, and total acquisition time was 7 minutes. Fifteen adult patients with subsequent confirmed meningioma were examined before first-time surgery. 12 of these were used in training the model, while 2 of the remaining 3 patients intended for testing were excluded due to MRE-specific technical difficulties. The remaining test case is therefore intended as a preliminary, proof-of-concept analysis. The deep learning model (ElastNet) is a cascading reconstruction network based on the End-to-End variational network (1) that employs alternating deep learning refinements with a U-Net like model (2) and data consistency. Unlike more traditional MRI scans, MRE has both an input and a relative reference scan in which the wave phase is measured against. To handle this, the deep learning model contains two cascaded networks without shared weights that reconstructs the reference and input scan in parallel. The reconstructed input and reference scan is in the final stage combined using the adaptive coil combine method (3), and the magnitude image from the input scan is constructed with the root sum of squares method. The model is illustrated in Figure 1 for a 4-times accelerated scan. ElastNet was implemented in the PyTorch framework. For training, we used ADAM optimizer (4) with an initial learning rate of and step-wise learning rate decay after 60 iteration, and a batch size of 4 using gradient accumulation. We trained the model for 90 iterations where each iteration contains 10000 randomly selected images from the meningioma patient cohort and the fastMRI (5,6) dataset excluding the FLAIR scans. The meningioma dataset had 4-times the weight compared to the fastMRI data during the random sampling.Results
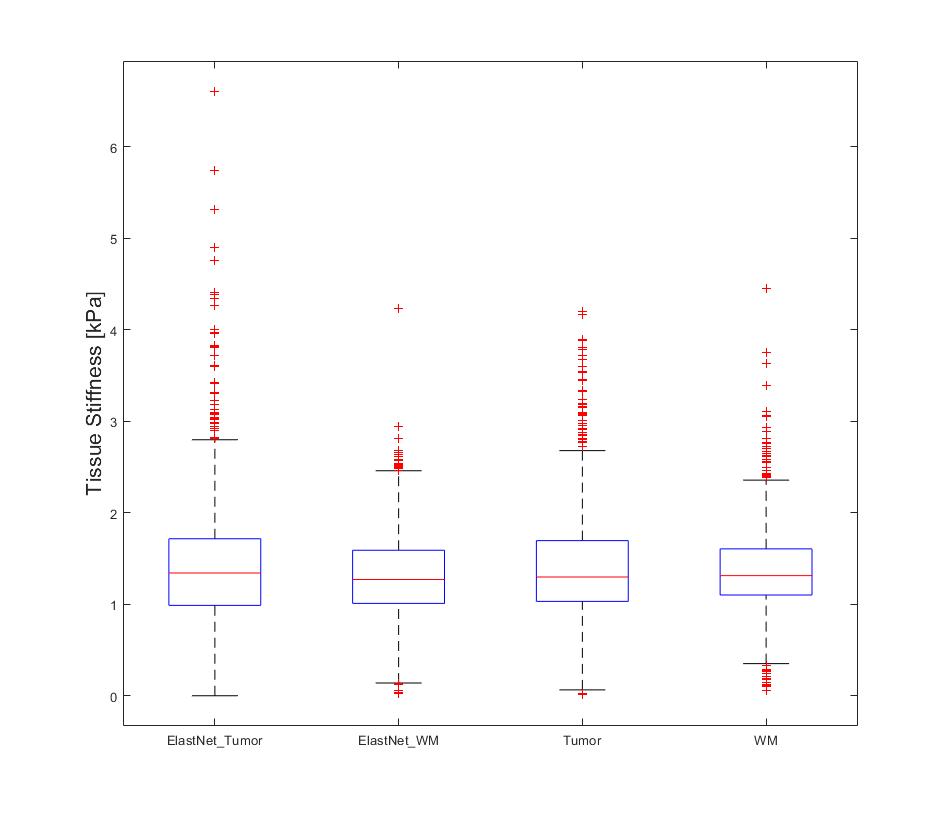
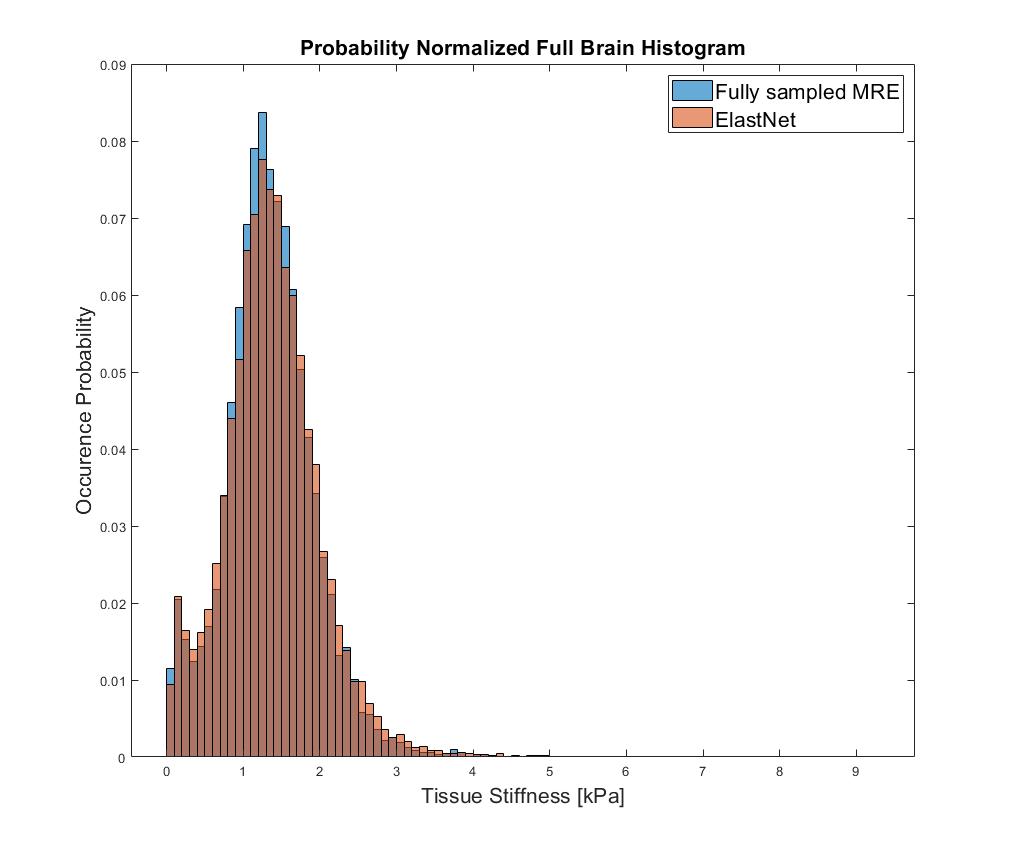
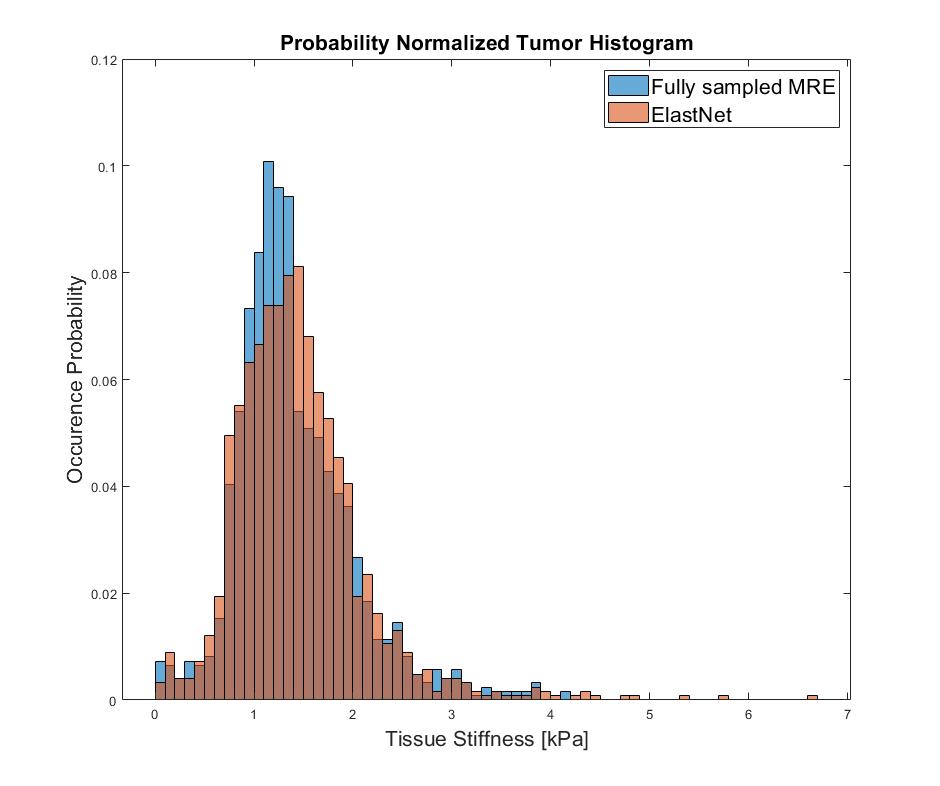
The fully sampled and reconstructed magnitude, phase and tissue stiffness map, respectively, for the test patient case, are shown in Figure 2. Figure 3 shows a box plot of MRE-based tissue stiffness for the tumor and the entire brain. The corresponding histogram plots are shown in Figure 4. No difference in tumor tissue stiffness was observed between the two cohorts (t-test, P=0.0796). Median values in the tumor region for ElastNet and fully sampled were 1.34 (Q1 = 0.99, Q3 = 1.72) and 1.30 kPa (Q1 = 1.03, Q3 = 1.70), respectively.Discussion
As evident by figure 3, there are subtle visual differences between the fully sampled scan and reconstructed undersampled scan. Nonetheless, the data distribution seen in Figure 4 and 5 suggest the reconstruction is capable of reconstructing the phase image without significant loss of precision in the MRE-based stiffness estimation. A significant limitation for these preliminary data is the fact that we have used most of our data for training the model, and have so far only tested reconstruction on a single case. We wish to expand on this by utilizing newly acquired data from our scanner in order to both improve the model and increasing the number of available cases for statistical comparison.Conclusion
There are slight visual discrepancies between the fully sampled image and the reconstructed image, but the suggested ElastNet model reconstructed the phase image to a degree in which there is a non-significant difference in measured tissue stiffness properties. Further work with architectural design and training data is warranted.Acknowledgements
We would like to thank the tireless radiographers at the neuroradiology lab, NMR3, who have assisted us with data acquisition and numerous issues along the way.References
1. Sriram A, Zbontar J, Murrell T, et al. End-to-End Variational Networks for Accelerated MRI Reconstruction. Lect Notes Comput Sci (including Subser Lect Notes Artif Intell Lect Notes Bioinformatics). 2020;12262 LNCS:64-73. doi:10.1007/978-3-030-59713-9_7
2. Ronneberger O, Fischer P, Brox T. U-Net: Convolutional Networks for Biomedical Image Segmentation. Lect Notes Comput Sci (including Subser Lect Notes Artif Intell Lect Notes Bioinformatics). 2015;9351:234-241. doi:10.1007/978-3-319-24574-4_28
3. Bydder M, Larkman DJ, Hajnal J V. Combination of signals from array coils using image-based estimation of coil sensitivity profiles. Magn Reson Med. 2002;47(3):539-548. doi:10.1002/mrm.10092
4. Kingma DP, Ba JL. Adam: A Method for Stochastic Optimization. 3rd Int Conf Learn Represent ICLR 2015 - Conf Track Proc. Published online December 2014.
5. Knoll F, Zbontar J, Sriram A, et al. fastMRI: A Publicly Available Raw k-Space and DICOM Dataset of Knee Images for Accelerated MR Image Reconstruction Using Machine Learning. https://doi.org/101148/ryai2020190007. 2020;2(1):e190007. doi:10.1148/RYAI.2020190007
6. Zbontar J, Knoll F, Sriram A, et al. fastMRI: An Open Dataset and Benchmarks for Accelerated MRI. Published online November 2018.
Figures