1050
Protocol harmonization using a generative adversarial network decreases morphometry variability1Advanced Clinical Imaging Technology, Siemens Healthcare AG, Lausanne, Switzerland, 2Department of Radiology, Lausanne University Hospital and University of Lausanne, Lausanne, Switzerland, 3LTS5, Ecole Polytechnique Fédérale de Lausanne (EPFL), Lausanne, Switzerland
Synopsis
In radiology, the deployment of automated clinical decision support tools to new institutions is often hindered by inter-site data variability. In MRI, data heterogeneity often arises from differences in acquisition protocols. To overcome this issue, we propose a post-hoc harmonization technique based on generative adversarial networks (GAN). Seventy-seven patients suffering from dementia were scanned with two distinct T1-weighted MP-RAGE protocols. We show that cross-protocol harmonization of brain images using a conditional GAN improves image similarity and reduces the variability of brain morphometry.
Introduction
Recent advances in image processing and computer vision have led to the emergence of various clinical decision support tools for medical imaging, and particularly MRI. The deployment of such tools across multiple institutions is, however, hindered by data heterogeneity that can arise from differences in MR scanner hardware or acquisition protocols. To overcome this limitation, post-hoc harmonization techniques can be implemented to reduce inter-site variability and improve the performance of clinical decision support tools1–3.In this work, we propose to use a conditional Generative Adversarial Network4 (cGAN) to perform cross-protocol harmonization of T1-weighted MP-RAGE brain images in a dementia patient cohort. Differences between brain images both prior and after harmonization are quantified in terms of both image similarity and volumetric estimation of brain regions using MorphoBox5, an automated brain segmentation prototype software.
Methods
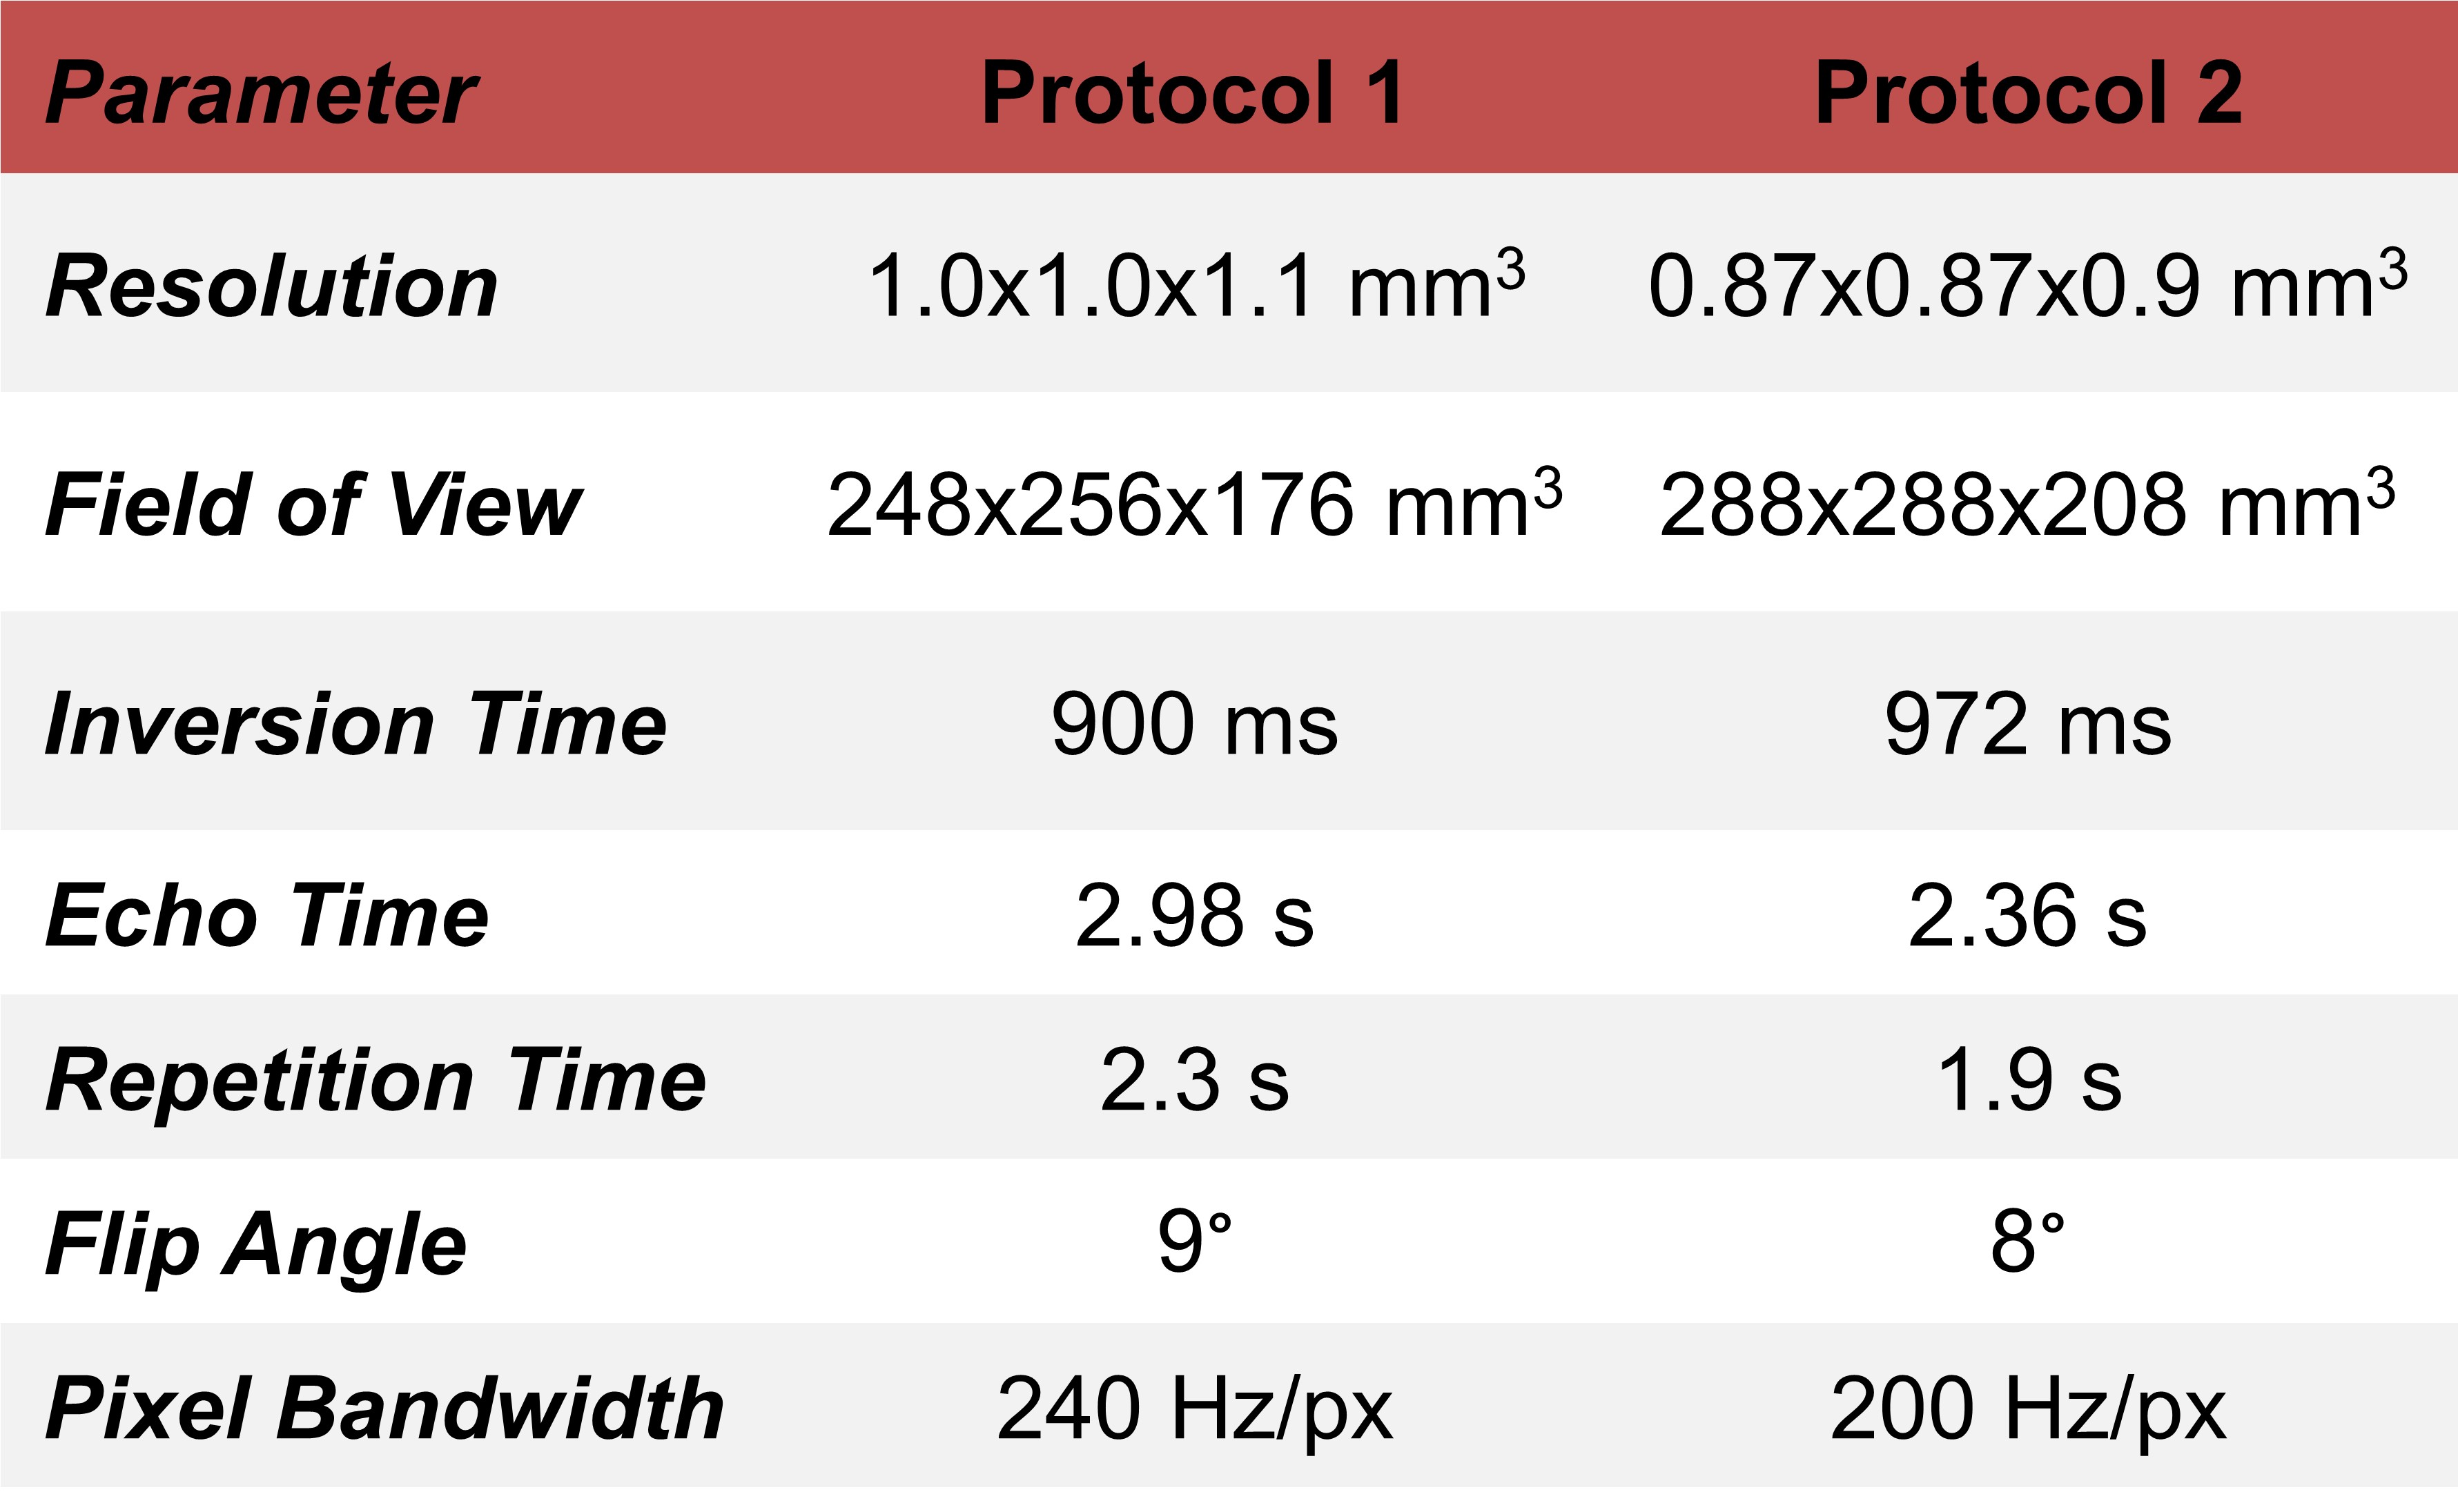
MR dataset and preprocessingSeventy-two patients suffering from dementia (36$$$\,$$$females, age 70.2$$$\,$$$±$$$\,$$$11.9$$$\,$$$y/o) underwent an MR examination at 3T (MAGNETOM Prisma, Siemens Healthcare, Erlangen, Germany). Two distinct 3D T1-weighted MP-RAGE sequences were acquired within the same session, resulting in paired acquisitions. The protocol parameters of the two sequences are reported in Table$$$\,$$$1.
Images acquired with protocol 1 (P1) were considered as reference since MorphoBox was optimized for this contrast. Images acquired with protocol 2 (P2) were corrected for intensity non-uniformities using N4 bias field correction and spatially rigidly registered to P1 images.
Harmonization using a GAN
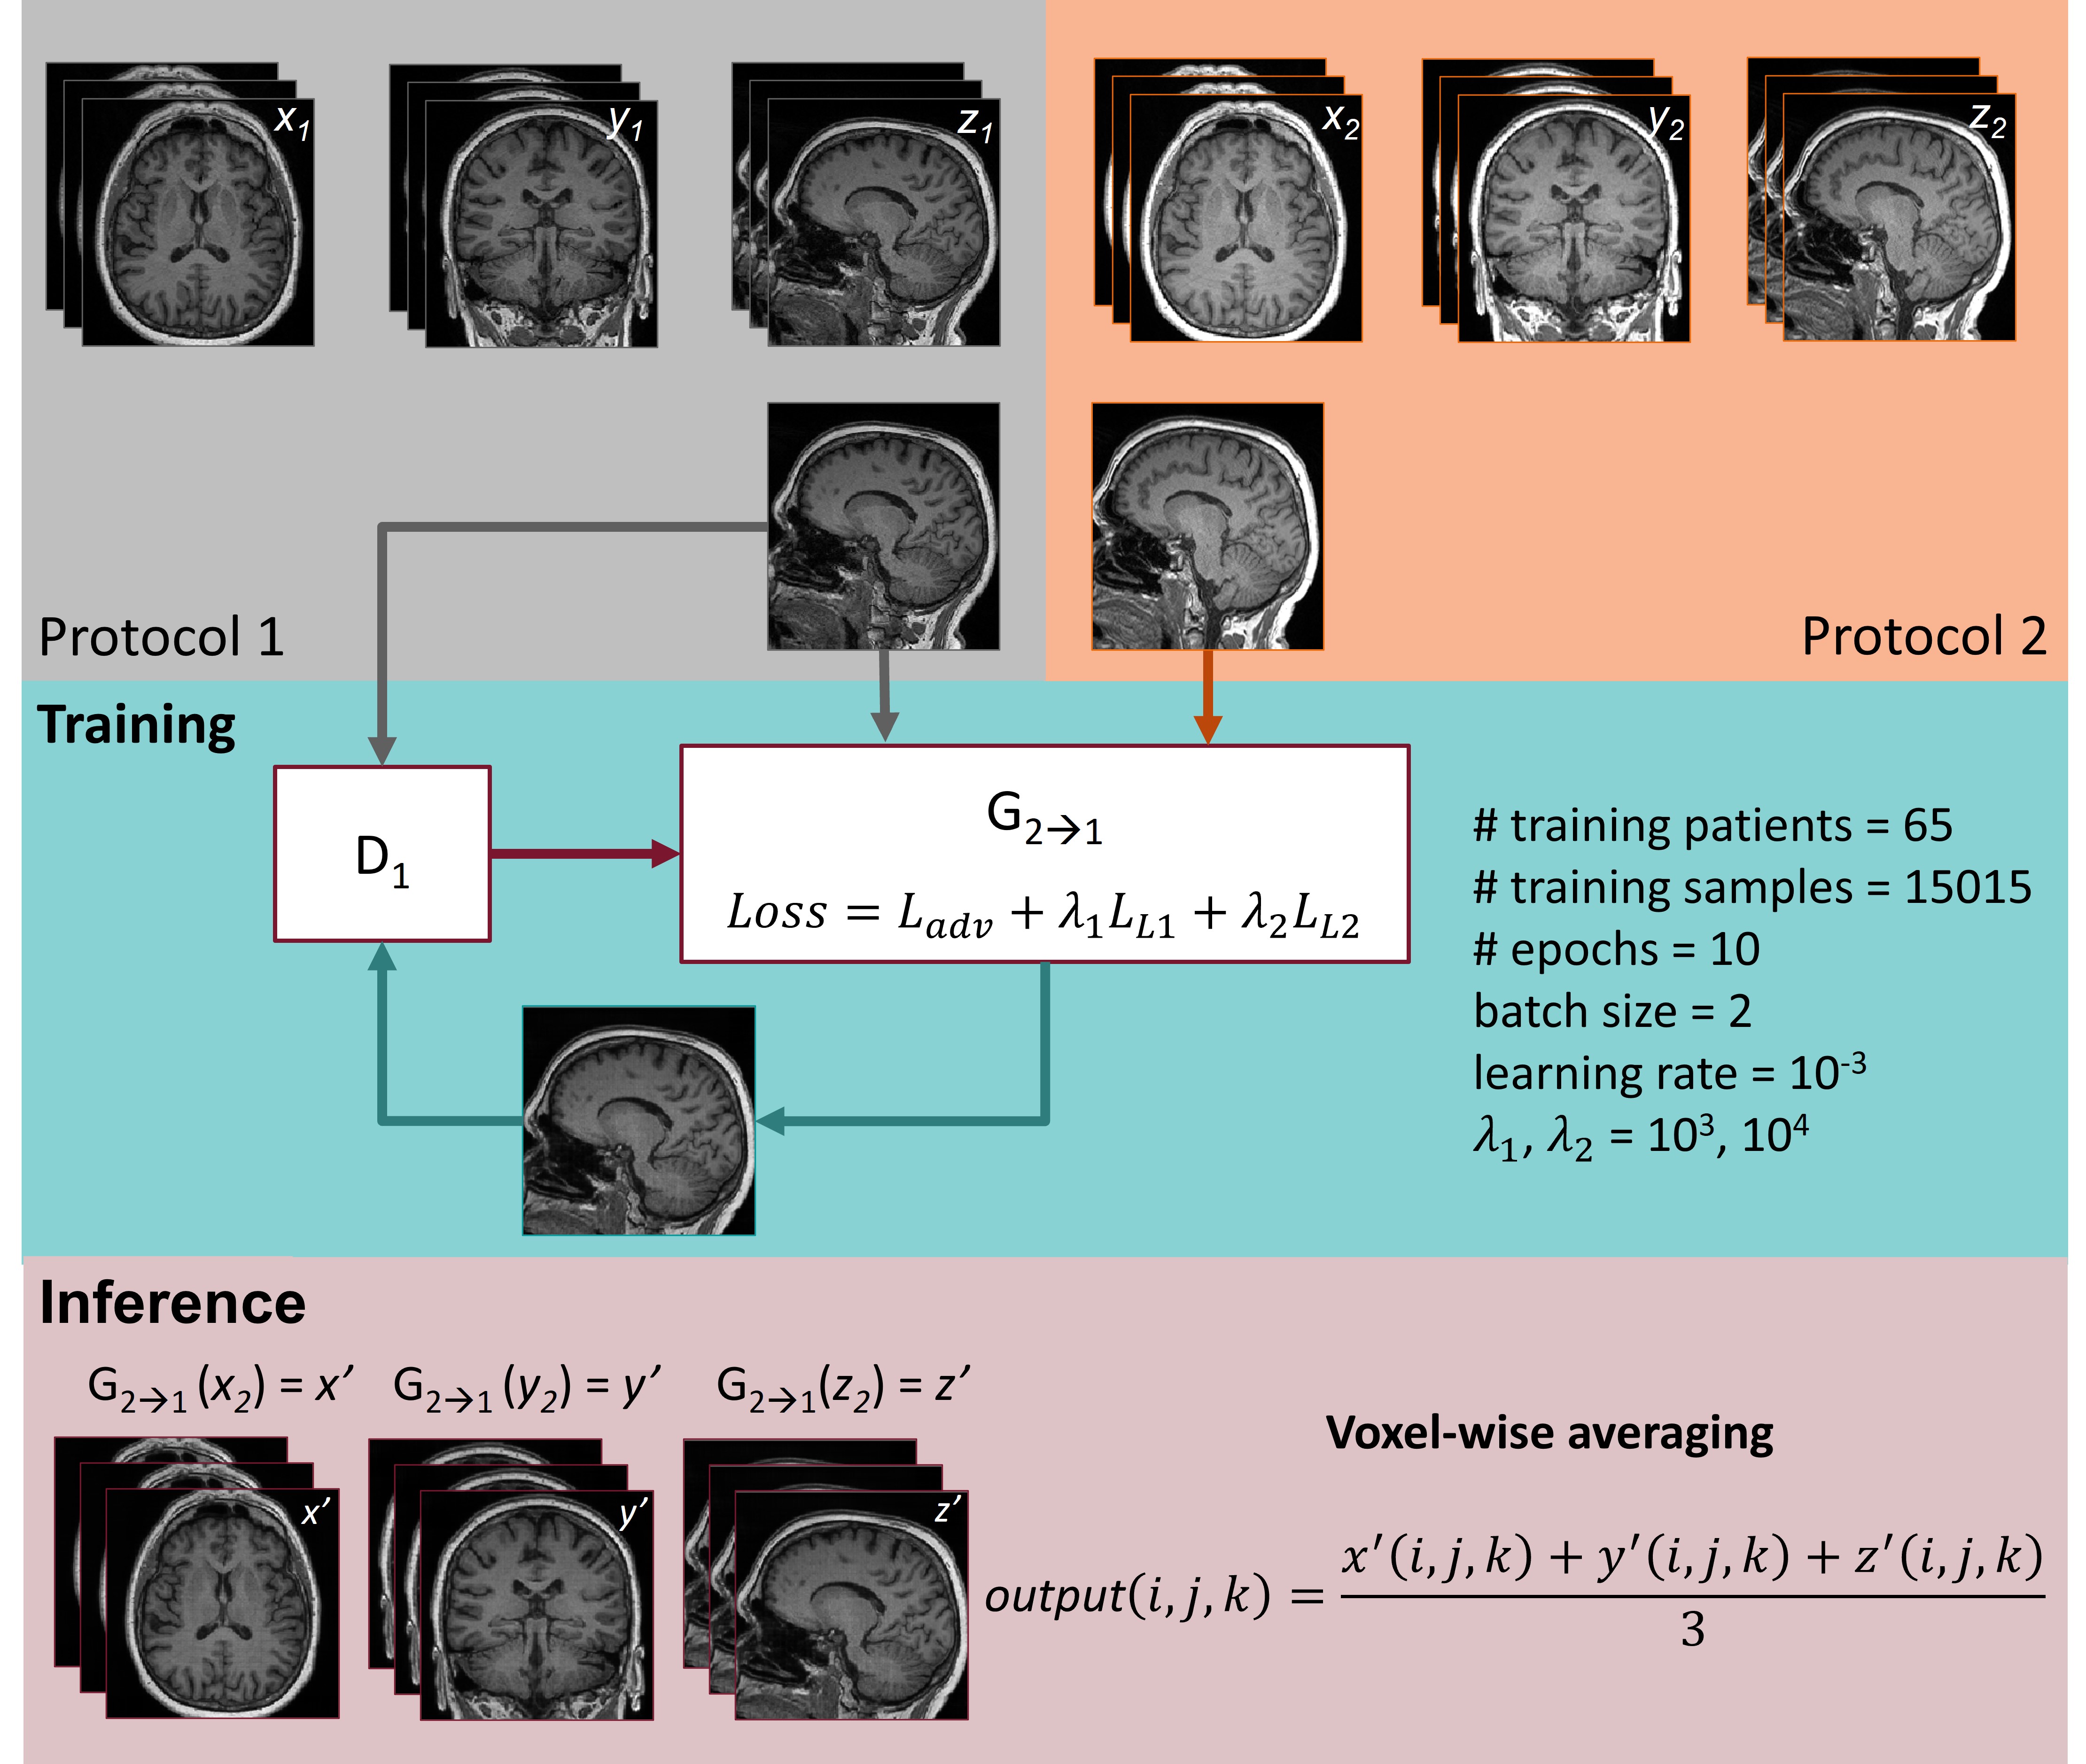
Eighty central slices were extracted in each orientation (i.e., sagittal, axial and coronal) for both protocols from sixty-five randomly selected training patients, resulting in approximatively 16k training images. A 2.5D pix2pix model4 was implemented using a three channels input composed by stacks of three consecutive slices in the same orientation, within the same minibatch. The model was trained to learn a mapping between co-registered N4-corrected P2 images and the reference P1 images. The cGAN architecture and relevant training parameters are reported in Figure$$$\,$$$1.
During testing, three volumes were reconstructed independently for each orientation, and voxel-wise averaging was performed to obtain the final harmonized image for seven test datasets.
Statistical analysis
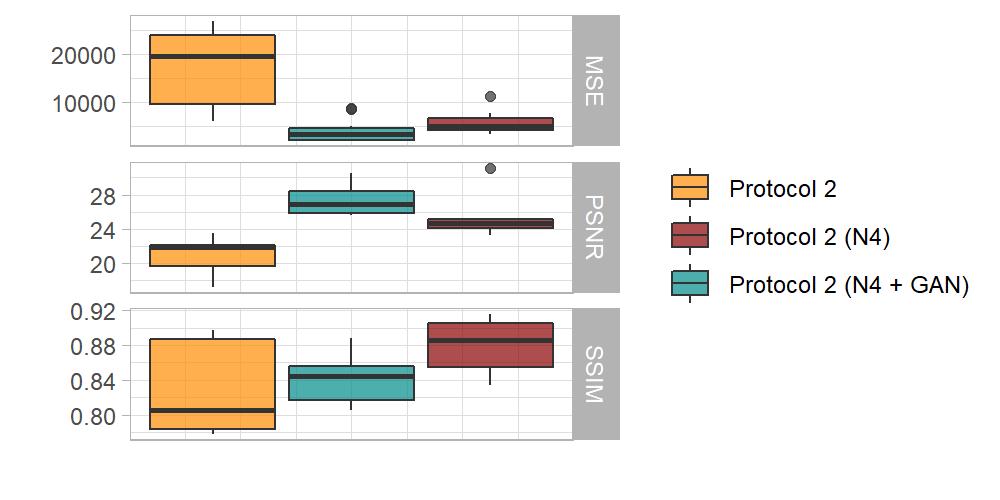
To study the added value of using a cGAN for cross-protocol harmonization, similarity metrics were computed between protocols, both before and after harmonization, in the testing cohort. Particularly, we computed the mean squared error (MSE), the peak-signal to noise ratio (PSNR) and the structural similarity index measure (SSIM6).
Subsequently, the effects of harmonization on brain morphometry were assessed by estimating brain volumes using MorphoBox in original images (P1 and P2), preprocessed images (N4 bias field correction, co-registration) and harmonized images using the cGAN. For each image, we computed the relative error in volumetric estimation of brain regions with respect to the reference P1. A paired, two-sided Student t-test was performed to identify significant differences in the distribution of relative errors between original images acquired with P2 and harmonized images. P-values were corrected for multiple comparison using Benjamini-Hochberg false discovery rate method.
Results
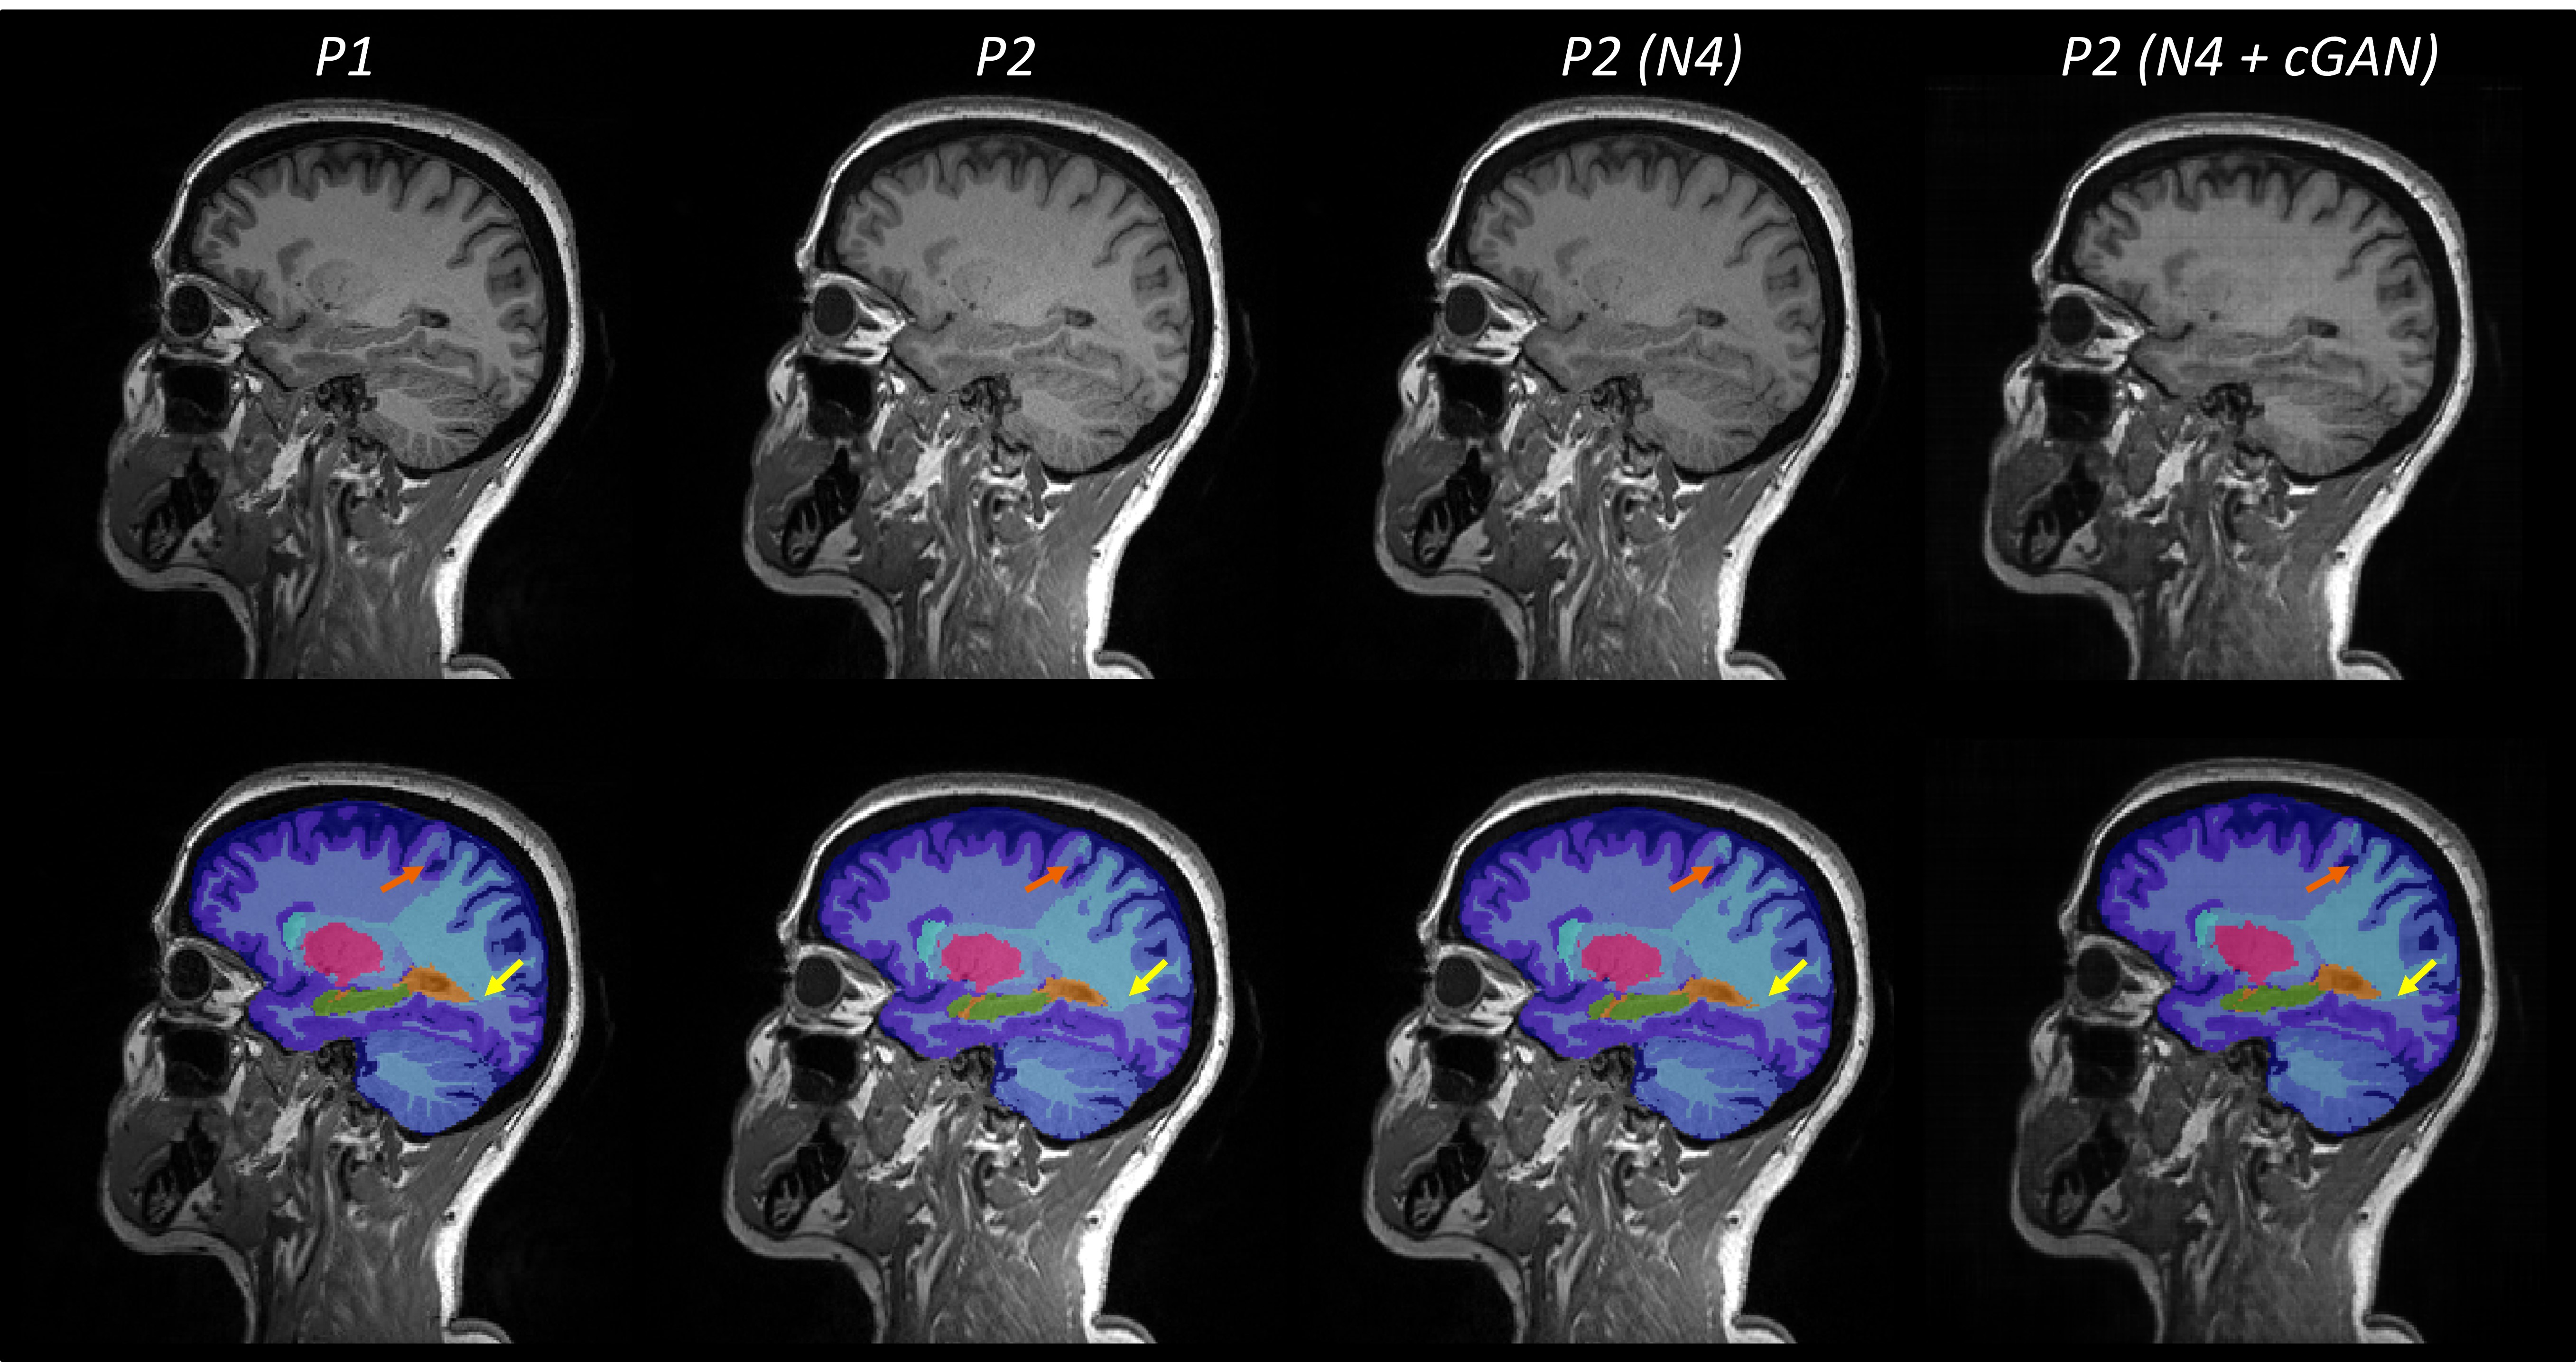
Figure$$$\,$$$2 shows representative examples of the images acquired with the two protocols, after preprocessing and after harmonization, together with the resulting segmentations. Compared to the reference segmentation, the boundaries between brain lobes (highlighted with arrows) showed substantial differences when computed on P2 images. Visually, the segmentation of the occipital lobe improved after correcting for N4 bias field (orange arrow), whereas the boundary between the frontal and parietal lobe (yellow arrow) improved in cGAN-harmonized images.The distribution of image similarity metrics computed in the testing cohort is shown in Figure$$$\,$$$3 for the original contrast (in orange), the N4-corrected image (in dark red) and the cGAN-harmonized result (in blue). In terms of MSE and PSNR, the harmonized image was the closest to the reference image, whereas the highest SSIM was achieved for the preprocessed contrast.
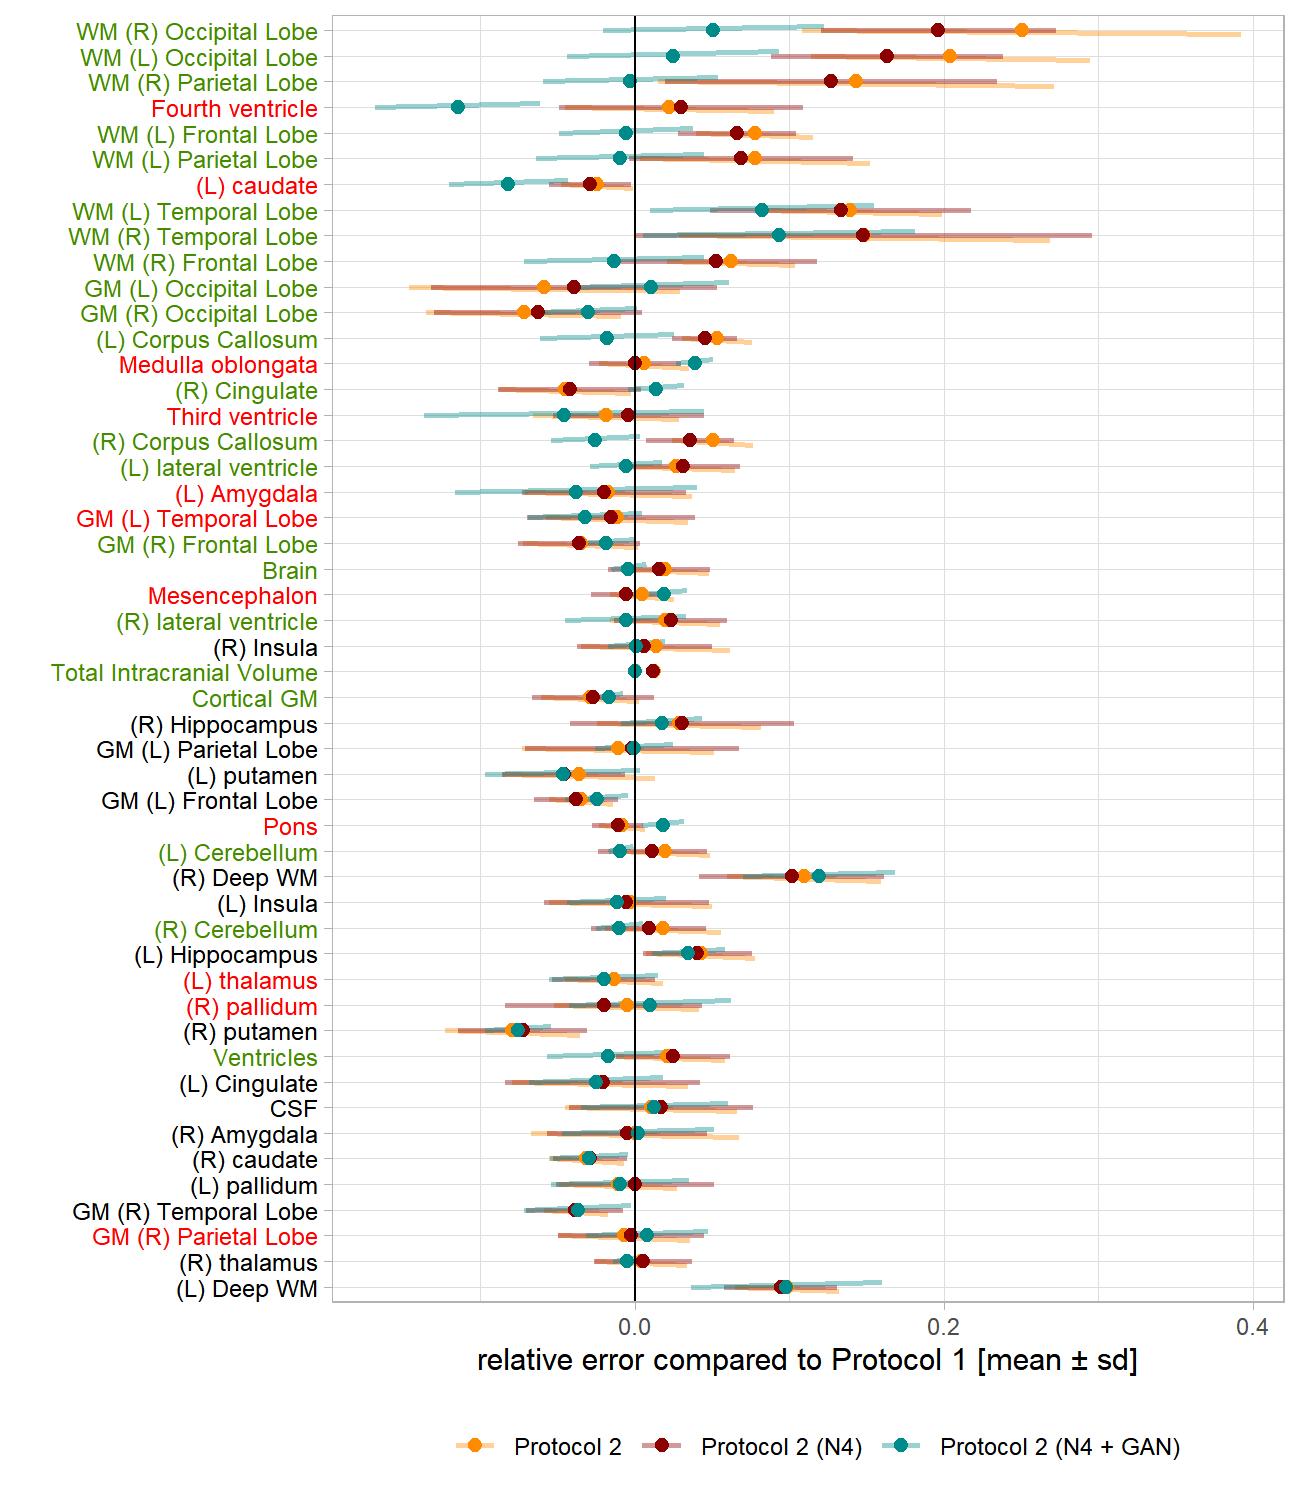
When comparing the relative errors in volumetric estimation, represented as mean$$$\,$$$±$$$\,$$$sd in Figure$$$\,$$$4, one can notice that overall, applying N4 bias field correction (in dark red) reduces the relative error compared to the original images (in orange). However, the greatest improvement was observed after harmonizing the contrasts using the cGAN, which significantly improved the segmentation for most brain regions, highlighted in green. The greatest improvements were observed for the segmentation of white matter in brain lobes. On the other hand, the segmentation accuracy of some regions (highlighted in red) was also decreased with a smaller effect size.
Discussion and Conclusions
This work shows that post-hoc harmonization using a cGAN is a promising approach to improve performance and generalizability of automated clinical decision support tools for radiology. Overall, the similarity between contrasts was improved. The lower value in SSIM is likely to be caused by a checkboard pattern in the synthetic image. Nevertheless, when segmented with MorphoBox, the volumetric estimation of most brain regions was significantly improved by the harmonization.While we only tested on one segmentation tool, we believe that this conclusion is generalizable to similar software. Despite its relevance and utility to overcome the limitation of data heterogeneity between different institutions, this method was implemented only for two protocols and therefore suffers from poor scalability to multiple sites. Further, it requires paired acquisitions of travelling subjects which limits its applicability to clinical frameworks. Thus, future work should investigate new unsupervised methods.
Acknowledgements
No acknowledgement found.References
1. Tax CM, Grussu F, Kaden E, et al. Cross-scanner and cross-protocol diffusion MRI data harmonisation: A benchmark database and evaluation of algorithms. Neuroimage. 2019;195(February):285-299. doi:10.1016/j.neuroimage.2019.01.077
2. Guan H, Liu Y, Yang E, Yap PT, Shen D, Liu M. Multi-site MRI harmonization via attention-guided deep domain adaptation for brain disorder identification. Med Image Anal. 2021;71:102076. doi:10.1016/j.media.2021.102076
3. Bashyam VM, Doshi J, Erus G, et al. Medical Image Harmonization Using Deep Learning Based Canonical Mapping: Toward Robust and Generalizable Learning in Imaging. arXiv Prepr arXiv201005355. 2020.
4. Isola P, Jun-Yan Z, Zhou T, Efros AA. Image-to-Image Translation with Conditional Adversarial Networks. Proc IEEE Conf Comput Vis pattern Recognit. 2017:1125-1134. doi:10.1007/978-3-030-11009-3_37
5. Schmitter D, Roche A, Maréchal B, et al. An evaluation of volume-based morphometry for prediction of mild cognitive impairment and Alzheimer’s disease. NeuroImage Clin. 2015;7(1):7-17. doi:10.1016/j.nicl.2014.11.001
6. Wang Z, Bovik AC, Sheikh HR, Simoncelli EP. Image quality assessment: From error visibility to structural similarity. IEEE Trans Image Process. 2004;13(4):600-612. doi:10.1109/TIP.2003.819861
Figures