1049
MRSI Processing and Simulation Toolbox in the FID Appliance (FID-A)
Brenden Kadota1, Bernhard Strasser2,3, Wendy Oakden1, and Jamie Near1,4
1Physical Studies Research Platform, Sunnybrook Research Institute, Toronto, ON, Canada, 2Department of Biomedical Imaging and Image-Guided Therapy, Medical University of Vienna, Vienna, Austria, 3A. A. Martinos Center for Biomedical Imaging, Massachusetts General Hospital, Boston, MA, United States, 4Medical Biophysics, University of Toronto, Toronto, ON, Canada
1Physical Studies Research Platform, Sunnybrook Research Institute, Toronto, ON, Canada, 2Department of Biomedical Imaging and Image-Guided Therapy, Medical University of Vienna, Vienna, Austria, 3A. A. Martinos Center for Biomedical Imaging, Massachusetts General Hospital, Boston, MA, United States, 4Medical Biophysics, University of Toronto, Toronto, ON, Canada
Synopsis
Magnetic resonance spectroscopic imaging (MRSI) is a biomedical imaging tool that enables spatial mapping of metabolite signals in vivo. Dedicated software for MRSI data preprocessing, image reconstruction, visualization and simulation is vital to the development and routine application of MRSI but relatively few tools are available for this purpose. We present an open source toolbox in MATLAB for preprocessing, visualization and simulation of MRSI data. The processing toolbox includes functions for importing data, coil combination, B0 inhomogeneity correction, and non cartesian reconstruction, while the simulation toolbox can simulate MRSI acquisitions with arbitrary input k-space trajectories.
Introduction
Magnetic resonance spectroscopic imaging (MRSI) non-invasively maps the spatial distribution of metabolite concentrations in vivo. Software tools are necessary for any MRSI workflow, i.e. processing tools to reconstruct data and remove artifacts, plotting tools for visualization of measured metabolite maps, and simulation tools to assess properties of different k-space trajectories. Our lab previously developed the open-source FID appliance (FID-A), for processing and simulation of magnetic resonance spectroscopy data1. However, the original version of FID-A was not capable of processing MRSI data.Here, we present an extension to the MATLAB-based FID-A toolkit to enable processing, simulation and visualization of MRSI data. The processing toolbox includes functions for reconstructing conventional phase-encoded and more advanced, non-Cartesian spatial-spectral encoded MRSI, while the simulation toolbox allows simulation of MRSI experiments on user-defined in-silico phantoms with arbitrary k-space trajectories. A human-brain-like in-silico phantom is provided as part of the simulation toolbox and contains realistic brain metabolite concentrations and lipid signals in the extracranial space to accurately simulate lipid contamination. The toolkit consists of modular command line functions for ease of use and flexibility.
Methods
Processing toolbox: The processing toolbox can import Siemens .rda and .dat data into MATLAB and create a modified FID-A structure for MRSI data. The fields of the FID-A MRSI data structure are shown in Figure 1. Once loaded, a sequence of operations can be used to process and reconstruct the data as shown in Figure 2. The coil combination method uses the first point of the free induction decay to scale and phase each radiofrequency channel at each voxel position. The processing toolbox also allows for non-cartesian reconstruction using the discrete ”slow” fourier transform and density compensation with Voronoi diagrams.2,3 Finally, the toolbox contains a visualization feature to overlay either an MRSI spectral grid or an LCModel output metabolite concentration map onto an anatomical MRI using spm12’s MRI image function4,5 (Figure 3). MRSI data for Figure 3 were acquired on a Siemens 3T scanner (MAGNETOM Prisma; Siemens Healthineers, Erlangen, Germany) using a semi-LASER MRSI sequence (Center for Magnetic Resonance Research, Minnesota, under C2P agreement).6,7Simulation toolbox: The simulation toolbox uses the density matrix formalism whereby the sample magnetization is represented by spatially-resolved density matrices which evolve via the action of Hamiltonian operators describing the basic pulse sequence elements.8 Users can create their own k-space trajectories or use pre-existing trajectories provided. An in-silico phantom is provided based on the MNI152 atlas with 2 mm isotropic resolution which has been segmented into grey matter, white matter, cerebrospinal fluid, and skull.9,10 The segmented areas contain metabolite and lipid concentrations based on previous published work11. Experimental imperfections such as B0 or B1 inhomogeneity can readily be incorporated into the simulations to assess their effects on MRSI image quality. Finally, the package contains tools to evaluate MRSI trajectory properties like point spread function and scan duration.
Results
Figure 4 shows the results of two simulations using the MNI 152 MRSI phantom with conventional phase encoded MRSI: a low-resolution simulation with an 8x8 matrix and a high resolution simulation with a 32x32 matrix. Both signals were zero-filled to a resolution of 64x64 before Fourier transformation. The magnitude of each voxel’s spectra was integrated from -1 ppm to 1 ppm to illustrate lipid contamination (Figure 4b,c), and from 2.2-2.4 ppm to illustrate the glutamate distribution (Figure 4e,f). These simulations illustrate that increased scan resolution effectively mitigates lipid contamination throughout the brain, due to improvements in point spread function.Figure 5 illustrates the incorporation of B0 inhomogeneity into simulations and its correction using the processing toolbox. The simulation was performed using the MNI 152 MRSI phantom with a uniform water concentration throughout, and a linear B0 field offset along the y direction (Figure 5a). Conventional phase encoding MRSI was used with a 32x32 matrix. The simulated signal had noise added and was apodized to simulate line broadening effects. Finally, the signal was zero filled to a 64x64 resolution and Fourier transformed to generate the MRSI image. A B0 offset measurement and correction was then performed using the ‘op_CSIB0Correction.m’ function which is part of the processing toolbox. Figure 5 shows the simulation toolbox successfully simulating experiments with B0 inhomogeneity and the B0 correction tool accurately estimating and correcting the B0 inhomogeneity.
Discussion
The FID-A MRSI processing toolbox contains tools for processing, reconstruction of MRSI data, and overlay onto anatomical MRI. Commonly used processing functions are provided, including coil combination, water removal, temporal truncation, zero filling, and B0-correction. The MRSI simulation toolbox permits simulation of arbitrary k-space trajectories with different spatial resolutions, allowing the assessment of lipid contamination effects. Further, B0 inhomogeneity maps can be incorporated into simulations to examine the effects of realistic experimental imperfections.Conclusion
The MRSI extension of FID-A can be used to process MRSI data and simulate spectra on an in-silico brain phantom. The processing toolbox can correct for B0 inhomogeneities, combine coils, and perform density compensation for non-cartesian trajectories. The simulation toolbox can quickly simulate MRSI trajectories and identify lipid contamination. Increasing the functionality to import different vendor’s data and export to different fitting tools will be required for a wider user base.Acknowledgements
No acknowledgement found.References
- Provencher SW. Estimation of metabolite concentrations from localized in vivo proton NMR spectra. Magn Reson Med 1993;30(6):672-679.
- Simpson R, Devenyi GA, Jezzard P, Hennessy TJ, Near J. Advanced processing and simulation of MRS data using the FID appliance (FID-A)-An open source, MATLAB-based toolkit. Magn Reson Med. 2017 Jan;77(1):23-33
- Bagchi S, Mitra SK. The nonuniform discrete Fourier transform and its applications in filter design. I. 1-D. IEEE Trans Circuits Syst II Analog Digital Signal Process 1996;43(6):422-433.
- Rasche V, Proksa R, Sinkus R, Bornert P, Eggers H. Resampling of data between arbitrary grids using convolution interpolation. IEEE Trans Med Imaging 1999;18(5):385-392.
- SPM, J. Ashburner and K. J. Friston, 1999, Hum. Brain Mapp. 7, 254–266
- Öz G, Tkáč I. Short-echo, single-shot, full-intensity proton magnetic resonance spectroscopy for neurochemical profiling at 4 T: validation in the cerebellum and brainstem. Magn Reson Med. 2011;65:901-10.
- Deelchand DK, Berrington A, Noeske R, Joers JM, Arani A, Gillen J, Schär M, Nielsen JF, Peltier S, Seraji-Bozorgzad N, Landheer K, Juchem C, Soher BJ, Noll DC, Kantarci K, Ratai EM, Mareci TH, Barker PB, Öz G. Across-vendor standardization of semi-LASER for single voxel MRS at 3 Tesla. NMR Biomed 2019;doi: 10.1002/nbm.4218.
- Mulkern R, Bowers J. Density matrix calculations of AB spectra from multipulse sequences: quantum mechanics meets in vivo spectros-copy. Concepts Magn Reson 1994;6:1–23.
- VS Fonov, AC Evans, K Botteron, CR Almli, RC McKinstry, DL Collins and BDCG, Unbiased average age-appropriate atlases for pediatric studies, NeuroImage,Volume 54, Issue 1, January 2011, ISSN 1053–8119, DOI: 10.1016/j.neuroimage.2010.07.033
- VS Fonov, AC Evans, RC McKinstry, CR Almli and DL Collins, Unbiased nonlinear average age-appropriate brain templates from birth to adulthood, NeuroImage, Volume 47, Supplement 1, July 2009, Page S102 Organization for Human Brain Mapping 2009 Annual Meeting,
- Pouwels, P.J.W. and Frahm, J. (1998), Regional metabolite concentrations in human brain as determined by quantitative localized proton MRS. Magn. Reson. Med., 39: 53-60. https://doi.org/10.1002/mrm.1910390110
Figures
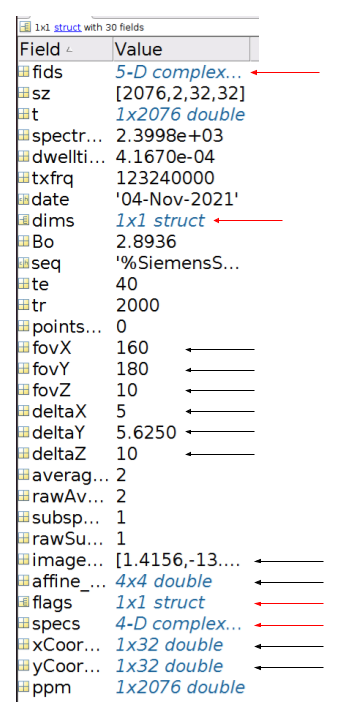
Figure 1: Modified FID-A MATLAB structure. Red arrows indicate modified existing fields and black arrows indicate new fields added to the FID-A structure. The ‘fids’ field contains raw unprocessed data while the ‘specs’ data contains Fourier transformed fids data. The dimensions fourier transformed in ‘specs’ is determined by new flags in the flags field. The ‘affine_matrix’ field contains an affine matrix which maps from voxel space to scanner coordinates.

Figure 2: Pipeline used for MRSI processing of Siemens .dat data. The density compensation step is needed before the Fourier transform step. The Fourier transform function can specify to Fourier transform along spatial or spectral dimensions and whether to use the fast Fourier transform or a “slow” discrete Fourier transform. The final step is visualization which includes plotting spectra, overlaying spectra on MRI images, or plotting LCModel concentrations as a heatmap onto MRI images.
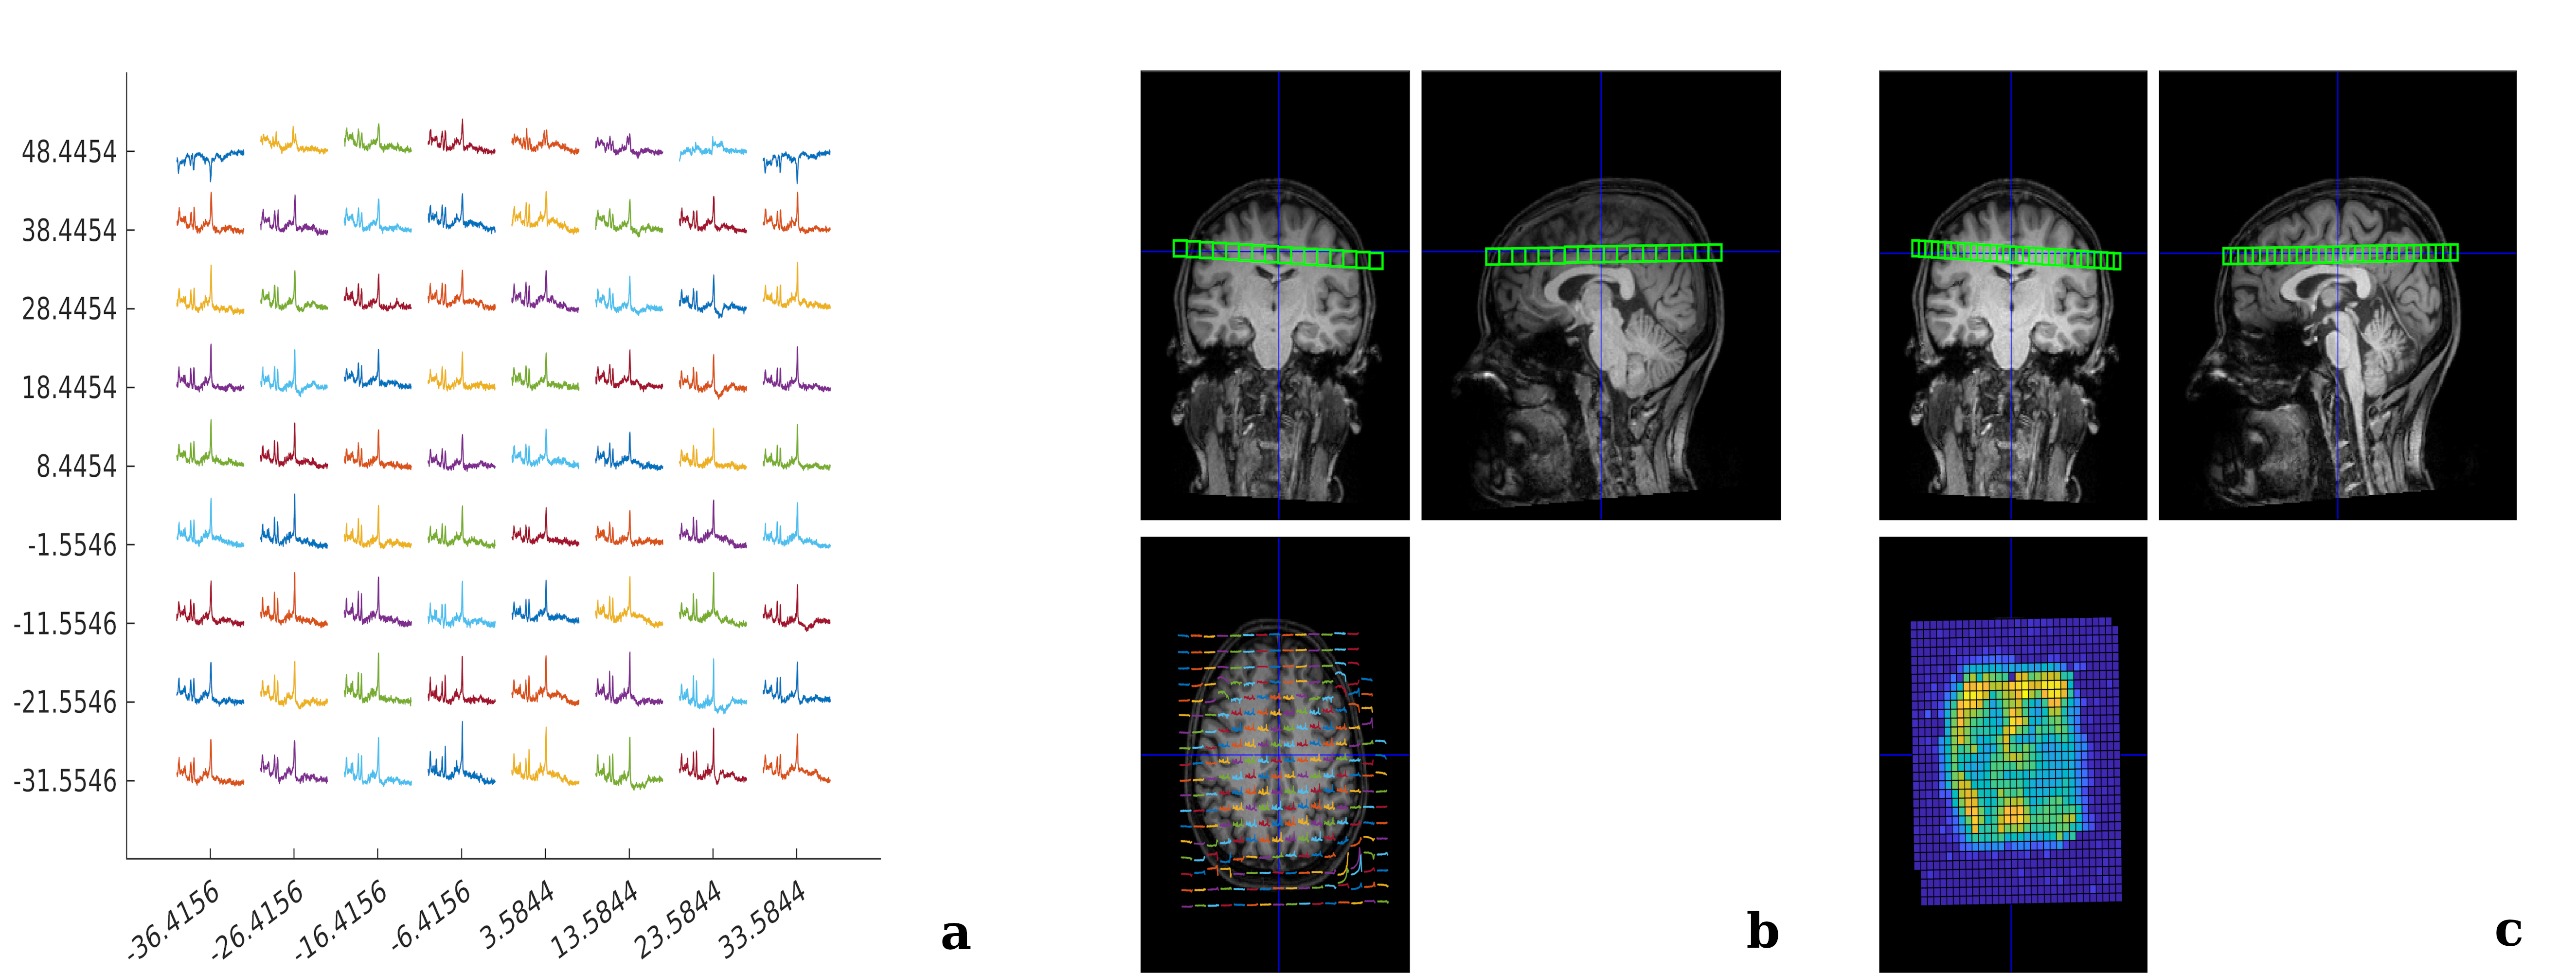
Figure 3: Imaging visualization options for in vivo MRSI data in FID-A. (a) Plotting of in vivo MRSI spectra without overlay using op_CSIPlot. (b) Overlaying in vivo MRSI spectra on an anatomical MRI using op_CSIoverlayMRI. (c) Overlaying NAA LCModel output concentration map on an anatomical MRI using op_CSIoverlaMRI_LCM.
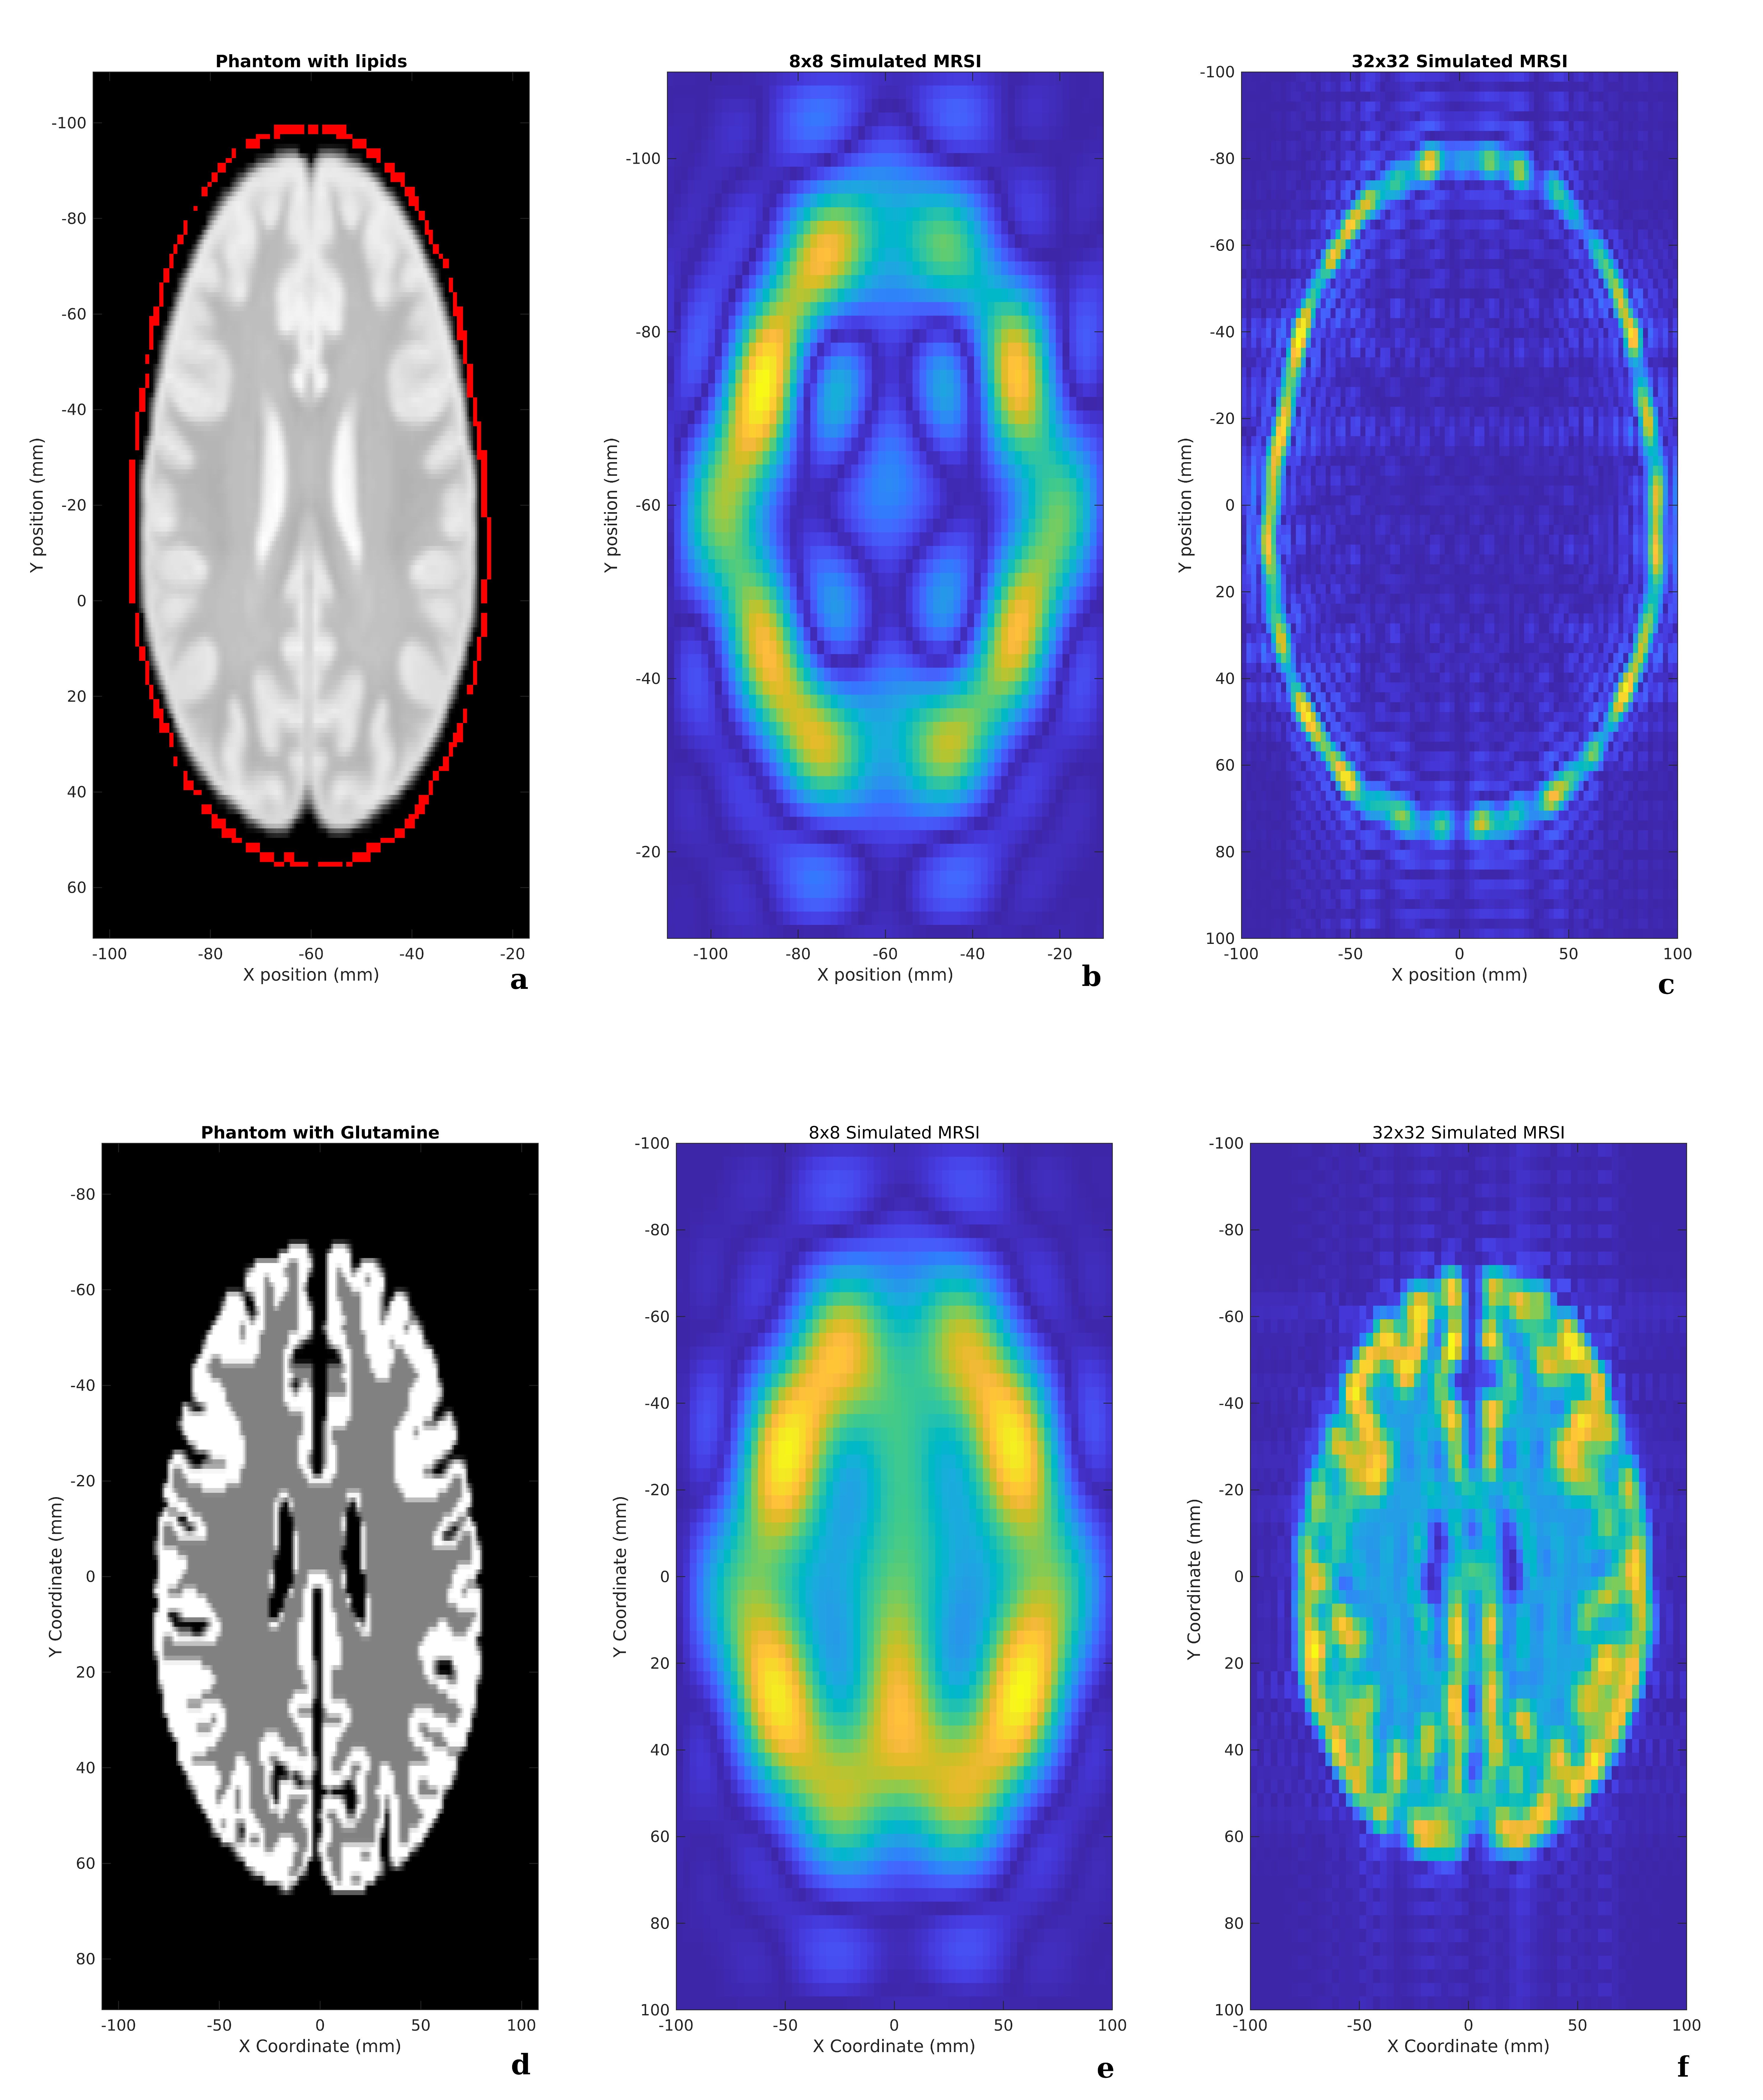
Figure 4: (a) in-silico phantom. Red is the lipid signal and white is the concentration of water. (b) 8x8 MRSI simulation zero filled to 64x64 resolution. Integrated from -1 ppm to 1 ppm. (c) 32x32 MRSI simulation zero filled to 64x64 resolution. Integrated from -1 ppm to 1 ppm. (d) in-silico phantom glutamate concentration. (e) 8x8 MRSI simulation zero filled to 64x64 resolution. Integrated from 1 ppm to 2 ppm. (f) 32x32 MRSI simulation zero filled to 64x64 resolution. Integrated from 1 ppm to 2 ppm.
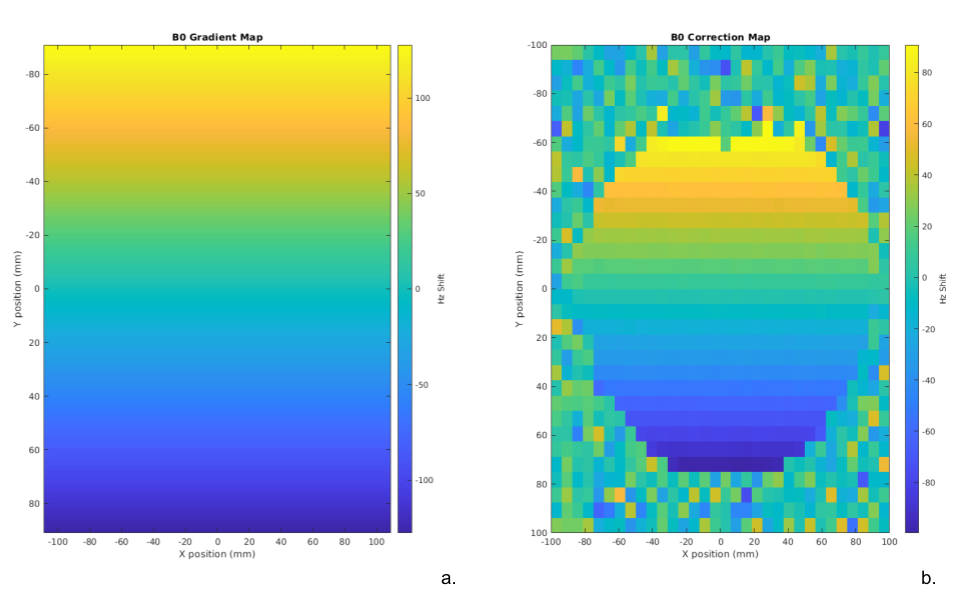
Figure 5: (a) B0 inhomogeneity pattern used for the MRSI simulations, consisting of linear frequency offset in the y-direction ranging from 130Hz to -130Hz. (b) A map of the estimated B0 offsets map produced using the op_CSIB0correct function. The B0 correction uses the existing FID-A op_alignScans to correct for B0 inhomogeneity.
DOI: https://doi.org/10.58530/2022/1049