1045
Susceptibility-induced B-field inhomogeneity of undulating axons and effects on the DWI signal1Department of Applied Mathematics and Computer Science, Technical University of Denmark, Kongens Lyngby, Denmark, 2Danish Research Centre for Magnetic Resonance (DRCMR), Copenhagen University Hospital Hvidovre, Hvidovre, Denmark
Synopsis
Magnetic susceptibility induces morphology- and orientation-dependent perturbations of the $$$B_0$$$-field and hence the DWI signal. At the micro-structural scale of brain white matter, the main contribution to these perturbations comes from myelin. To understand how the perturbations are shaped by the intrinsically undulating morphology of axons, observed in 3D reconstructions of synchrotron imaging and electron microscopy, we have implemented a framework that enables us to systematically study how undulation affects the orientation-dependency of susceptibility-induced B-field inhomogeneity, and how this affects the DWI signal - both in the intra- and extra-axonal compartments.
Introduction
The diffusion weighted imaging (DWI) signal is commonly assumed to be independent of the orientation of the sample1,2. But when magnetic susceptibility induces morphology- and orientation-dependent perturbations of the $$$B_0$$$-field this is no longer true3,4. As high-field MRI scanners are becoming more widespread, it is becoming even more crucial for us to understand these effects. At the micro-structural scale of brain white matter (WM), the main contribution to these perturbations comes from myelin5. We have previously shown a significant effect in silico for straight axons6, and in ex vivo DWI for the monkey corpus callosum and cingulum7. But axons are not straight. This has been quantified from synchrotron imaging as a micro-dispersion effect along the axons8. The micro-dispersion effect can be modeled as undulating cylinders. Here we show in silico how undulating axons affect B-field inhomogeneity and the DWI signal for intra- and extra-axonal compartments in 3D.Methods
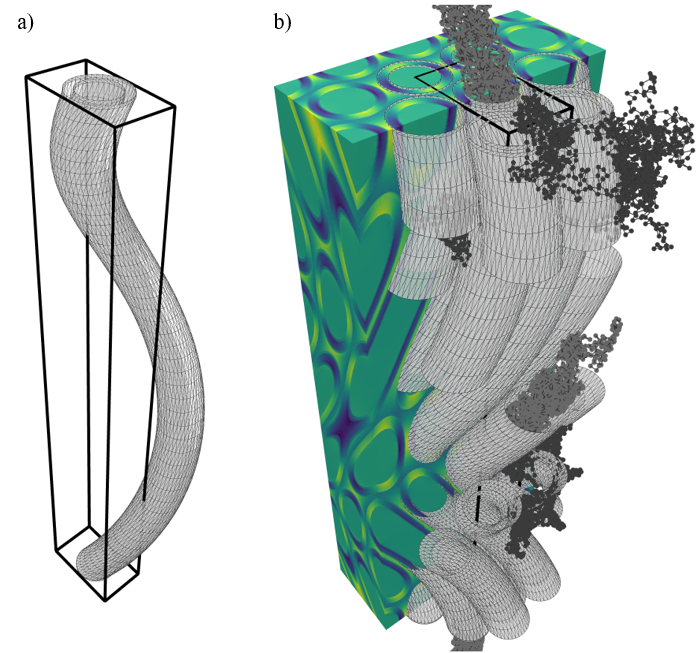
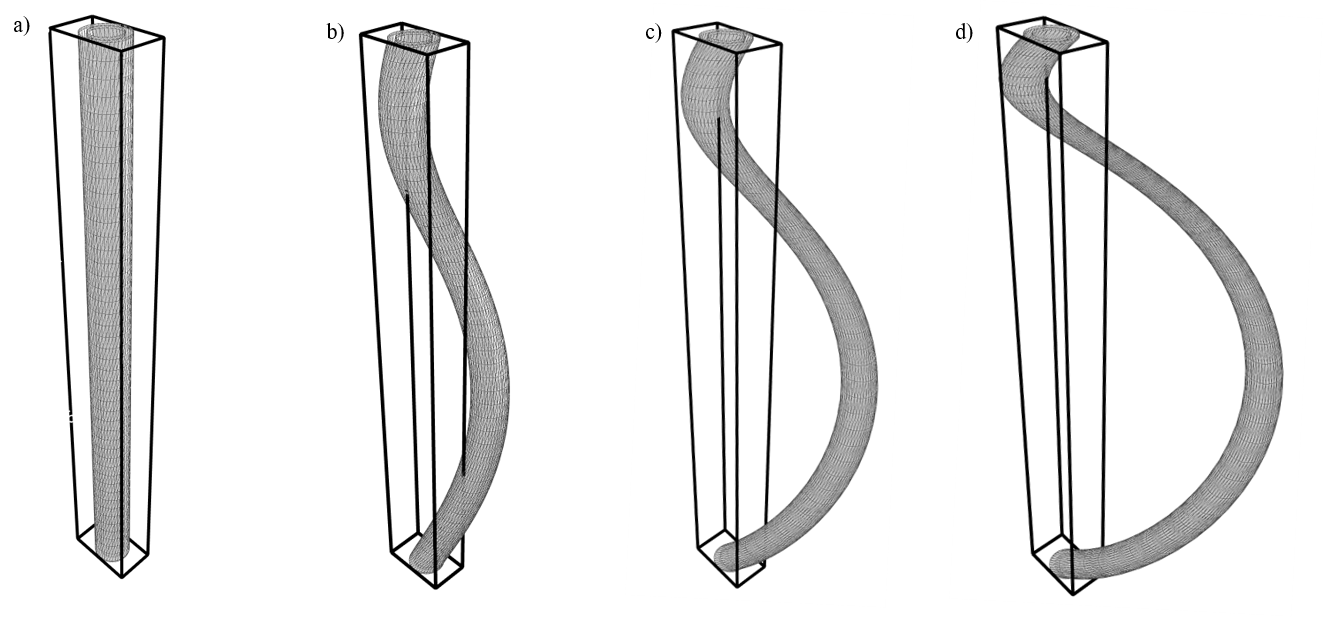
Substrates: In order for the B-field computations to be feasible, periodic substrates of relatively small unit voxels are required. The unit-voxel has periodic boundary conditions (like the unit cell known from solid state physics). Hence we choose hexagonally-packed helix-undulating co-axial cylinders (axons) where the axon diameter is constant in the xy-plane (Figure 1). The axons are characterized by an outer diameter of 1.0 $$$\mu$$$m, and a g-ratio of 0.7. The undulation is characterized by a helix trajectory inspired by the findings from synchrotron imaging in [8] with wavelength $$$\lambda$$$=15 $$$\mu$$$m, and a radii=[0.0, 1.0, 2.0, 3.0] $$$\mu$$$m (Figure 2). The packing is organized hexagonally in the xy-plane, and characterized by an extra-axonal volume fraction of 0.29. For computational efficiency the meshes are cropped around the unit-voxel such that only relevant mesh-segments remain.B-field computation: The B-field arising from a spatial distribution of magnetic permeability $$$\mathbf{\mu_r} = \mathbf{\chi} + 1$$$ is given by
$$B_{resulting} = \mu_0 \mathbf{\mu_r}\left(1 - \frac{1}{2} (\mathbf{\mu_r - 1})\right) (-\nabla\mathbf{\Phi}),$$
where $$$\mu_0$$$ is the magnetic permeability of vacuum, and $$$\mathbf{\Phi}$$$ is the magnetic scalar potential (MSP). The MSP is solved from
$$\nabla \cdot (\mu_r\nabla\mathbf{\Phi}) = 0$$
with an in-house finite difference method10 (inspired by [11, 12]).
Diffusion simulations: Diffusion trajectories are acquired with the MC/DC Simulator13 for intrinsic diffusivity $$$D_0$$$=0.6 m$$$^2$$$/ms (corresponding to ex vivo14). The DWI signal is then computed for a PGSE sequence with TE=22.0 ms, $$$\delta$$$=4.2 ms, $$$\Delta$$$=12.2 ms, b-values=[0, 2000, 4000] s/mm$$$^2$$$, and 21 b-vectors uniformly distributed over a half-sphere. Signal from the myelin compartment is neglected due to the T2 of this compartment15 being very short compared to TE of the experiments.
Diffusion tensor fitting: A diffusion tensor model was fitted16 to b-values [0, 2000, 4000] s/mm$$$^2$$$.
Results and discussion
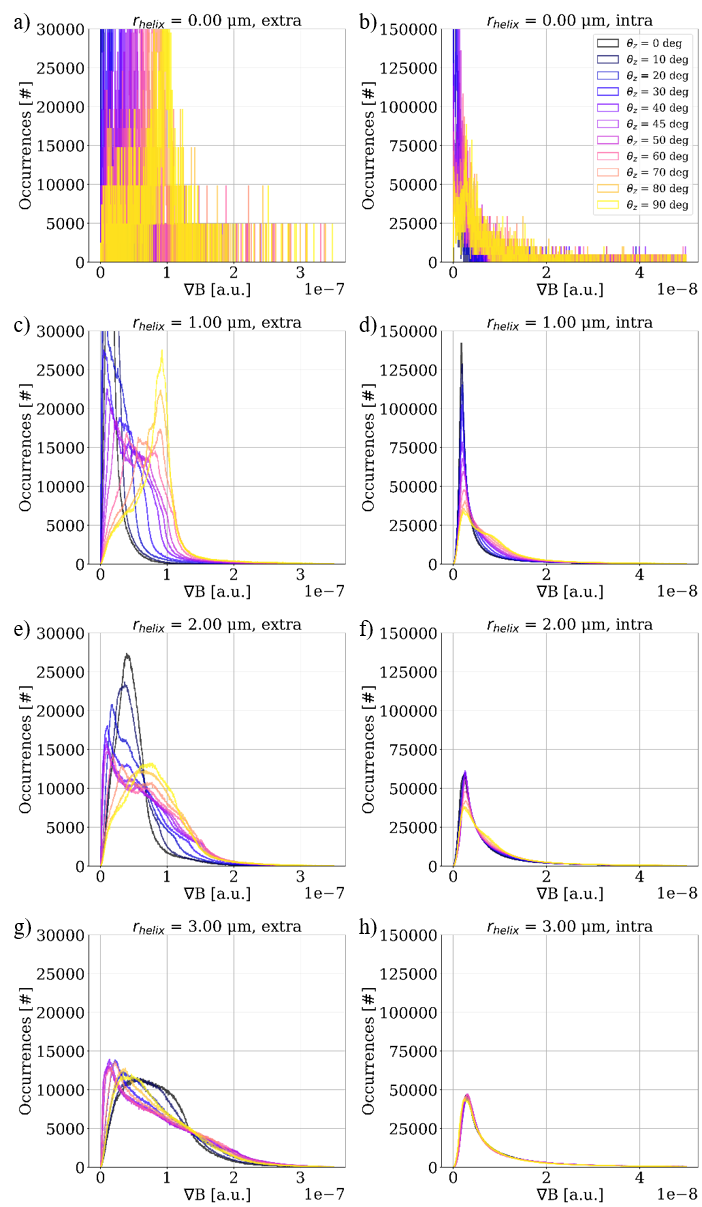
Figure 3 shows the distribution of gradients induced by the given substrates for varying orientations w.r.t. the applied B-field. The extra-axonal compartment shows a higher degree of orientation dependency than the intra-axonal compartment. $$$r_{helix}$$$=0.0 $$$\mu$$$m (i.e. a straight cylinder) induces the most narrow distributions. For $$$r_{helix}$$$=3.0 $$$\mu$$$m we see a decrease in fiber orientation dependence w.r.t. the applied B-field especially for the intra-axonal compartment. This is as expected for a high degree of undulation.Figure 4 shows how the mean diffusivity (MD) is affected by the orientation of the substrate w.r.t. the applied B-field. c) and d) shows a zoom of $$$r_{helix}$$$=0.0 $$$\mu$$$m. As expected11, we see no orientation-dependency for the intra-axonal compartment, while we do see a sinusoidal orientation-dependency for the extra-axonal compartment. a) and b) contains all substrates. For $$$r_{helix}$$$>0.0 $$$\mu$$$m we see a much stronger orientation-dependency compared to the $$$r_{helix}$$$=0.0 $$$\mu$$$m case. The wavelength of the sinusoid is no longer 2$$$\pi$$$, but $$$\pi$$$/4. We expect this to be a consequence of the periodicity of the substrate. The orientation dependency is stronger for $$$r_{helix}$$$=2.00 $$$\mu$$$m than for $$$r_{helix}$$$=1.00 $$$\mu$$$m, but weaker for $$$r_{helix}$$$=3.00 $$$\mu$$$m than for $$$r_{helix}$$$=2.00 $$$\mu$$$m. This is as expected for a high degree of undulation.
Conclusions
We successfully implemented a framework that enables us to systematically study how 3D undulation, inspired by histological data, affects the orientation-dependency of susceptibility-induced B-field inhomogeneity for both intra- and extra-axonal compartments. When advancing from straight axons to undulating axons, we start to see effects not only in the extra-axonal compartment, but also in the intra-axonal compartment. The periodicity of these substrates and their corresponding B-fields are expected to influence the DWI signal.Acknowledgements
TD have received funding from the Capital Region Research Foundation (grant number A5657). HL has received funding from the European Research Council (ERC) under the European Union’s Horizon 2020 research and innovation programme (grant agreement No 804746). SW is funded by a EuroTech PhD scholarship.References
1. Basser, P. J., Mattiello, J. & LeBihan, D. MR diffusion tensor spectroscopy and imaging. Biophys. J. 66, 259–267 (1994).
2. Szczepankiewicz, F., Westin, C.-F., Stahlberg, F., Latt, J. & Nilsson, M. Minimum number of diffusion encoding directions required to yield a rotationally invariant powder average signal in single and double diffusion encoding. ISMRM 2016.
3. Blundell, S. Magnetism in condensed matter. (Oxford University Press, 2001).
4. Schenck, J. F. The role of magnetic susceptibility in magnetic resonance imaging: MRI magnetic compatibility of the first and second kinds. Med. Phys. 23, 815–850 (1996).
5. Xu, T., Foxley, S., Kleinnijenhuis, M., Chen, W. C. & Miller, K. L. The effect of realistic geometries on the susceptibility‐weighted MR signal in white matter: Effect of Realistic Geometries on Susceptibility-Weighted MR Signal in White Matter. Magn. Reson. Med. 79, 489–500 (2018).
6. Winther, S., Lundell, H., Andersson, M. & Dyrby, T. Orientation-dependent biases in powder averaging caused by inhomogeneous distributions of magnetic susceptibility in white matter. ISMRM 2020.
7. Winther, S., Andersson, M., Lundell, H. & Dyrby, T. Susceptibility-induced fiber orientation dependency of the DWI signal in white matter measured in ex vivo rat brain at 7 T. ISMRM 2021.
8. Andersson, M. & Kjer, H. M. Axon morphology is modulated by the local environment and impacts the noninvasive investigation of its structure–function relationship. Proceedings of the National Academy of Sciences, 117 (52), 33649-33659 (2020).
9. Nicholson, C. & Syková, E. Extracellular space structure revealed by diffusion analysis. Trends Neurosci. 21, 207–215 (1998).
10. Winther, S. B. Master Thesis: Susceptibility-induced B-field inhomogeneities at the microstructural scale of brain white matter and the effect in diffusion weighted magnetic resonance imaging. (2018).
11. Bhagwandien, R., Moerland, M. A., Bakker, C. J., Beersma, R. & Lagendijk, J. J. Numerical analysis of the magnetic field for arbitrary magnetic susceptibility distributions in 3D. Magn. Reson. Imaging 12, 101–107 (1994).
12. Bhagwandien, R. et al. Numerical analysis of the magnetic field for arbitrary magnetic susceptibility distributions in 2D. Magn. Reson. Imaging 10, 299–313 (1992).
13. Rafael-Patino, J. et al. Robust Monte-Carlo Simulations in Diffusion-MRI: Effect of the substrate complexity and parameter choice on the reproducibility of results. Frontiers in Neuroinformatics 14 (2020).
14, (2019).14. Dyrby, T. B., Sogaard, L. V., Hall, M. G., Ptito, M. & Alexander, D. C. Contrast and stability of the axon diameter index from microstructure imaging with diffusion MRI. Magn. Reson. Med. 70, 711–721 (2013).
15. MacKay, A. L. & Laule, C. Magnetic Resonance of Myelin Water: An in vivo Marker for Myelin. Brain Plasticity 2, 71–91 (2016).
16. Garyfallidis, E. et al. Dipy, a library for the analysis of diffusion MRI data. Front. Neuroinform. 8, 1–17 (2014).
Figures