1042
SLOW-EPSI for the Whole Brain Detection of Phosphorylethanolamine (PE) at 7T
Guodong Weng1,2, Piotr Radojewski1,2, Philippe Schucht3, Roland Wiest1,2, and Johannes Slotboom1,2
1Institute for Diagnostic and Interventional Neuroradiology, Support Center for Advanced Neuroimaging (SCAN), INSEL Gruppe AG, University of Bern, Bern, Switzerland, 2Translational Imaging Center, sitem-insel AG, Bern, Switzerland, 3Department of Neurosurgery, Inselspital Bern and University Hospital, Bern, Switzerland
1Institute for Diagnostic and Interventional Neuroradiology, Support Center for Advanced Neuroimaging (SCAN), INSEL Gruppe AG, University of Bern, Bern, Switzerland, 2Translational Imaging Center, sitem-insel AG, Bern, Switzerland, 3Department of Neurosurgery, Inselspital Bern and University Hospital, Bern, Switzerland
Synopsis
Purpose: to detect phosphoethanolamine (PEtn or PE) in vivo for whole-brain MRSI, overcoming challenges of B1+-inhomogeneities and CSDE at 7T.
Methods: An EPSI-based B1+ robust SLOW-editing was applied to three healthy subjects. TE = 90 ms, TR = 1500 ms, and TA = 9:04 mins.
Results: the editing PE signal at 3.22 ppm was clearly present, and the B1+-homogenous result/map was obtained.
Conclusions: whole-brain in vivo PE-editing can be performed in around 9 minutes measurement time and is therefore clinically applicable.
INTRODUCTION
Increased phosphoethanolamine (PEtn or PE) is frequently observed in 31P-MRS studies of various cancers in humans. The role of PE in cancer cell survival and the molecular causes of this increase are, however, relatively underexplored1. Recently Osawa et al 2 presented evidence that glutamine deprivation leads to phosphoethanolamine (PE) accumulation in cancer cells via the downregulation of PE-cytidylyltransferase, a rate-limiting enzyme of phosphatidylethanolamine biosynthesis. Spatially-resolved in vivo PE-mapping could be useful for studying the heterogeneity in metabolism within tumors. Up till now, such mapping has been done using 31P-MRSI with the drawback of low spatial resolution. Recently, however, Hui et al 3 have shown the feasibility of detecting PE at 3T using the single-voxel MEGA-PRESS-sequence. 1H-MRS has the advantage of having a higher spatial-resolution and improved SNR than 31P-MRS. However, due to the high B1+-peak power requirements of the PRESS-sequence, needed to minimize the chemical-shift displacement-error (CSDE), its usage at 7T is not feasible. Here we present an alternative EPSI-based SLOW-editing method 4,5, which enables whole-brain proton PE-editing at UHF.METHODS
MRI/MRSI was performed on a Siemens 7T-scanner in clinical mode (MAGNETOM Terra, Germany) using the Nova 1Tx 32Rx head coil.The SLOW-EPSI 4–6 (Figure 1A-B) was applied on a PE-phantom (~14 mmol/L) and in three healthy volunteers (TE=90 ms, TR=1500 ms, matrix = 65x23x9, FOV=280x180x70 mm, and TA=9:04 min). The refocusing/editing chemical-selective adiabatic pulse (2π-CSAP) for SLOW-editing has 35 ms duration. The bandwidths (BW) of editing-full and editing-partial ranges are 1.7–4.3 ppm and 1.7–3.6 ppm, respectively (Figure 2A). Editing results are obtained by the subtraction of editing-full (acquisition #1) and editing-partial (acquisition #2) spectra. In SLOW-editing, the 2π-CSAP acts as both a refocusing and as an editing pulse.
Simulations of all spin-systems were performed using in-house MATLAB (R2019b) code, by solving relaxation-free Liouville-von-Neumann equation7.
RESULTS
Figure 2A shows the pulse-profiles of editing-full (1.7–4.3 ppm) and editing-partial (1.7–3.6 ppm). The corresponding in vitro measurement was shown in Figure 2B. Figure 2C,D shows the simulation of PE and Glx (glutamate/glutamine = 2/1) using SLOW-editing.Figure 3 illustrates the in vitro integration maps of editing-full and -partial and of the difference at 3.22 ppm, which are not corrected for B1+/B1--inhomogeneity.
Figure 4A shows the in vivo measurement (spectral editing difference) of three healthy volunteers. The PE signal at 3.22 ppm is clearly present in both gray- and white-matter, as well as the co-edited Glx at 2.11 ppm. Figure 4B shows the results of editing-full and -partial of subject 1. The displaced volumes (~1.3 x 2.2 x 0.8 cm, i.e., 2.3 cm3) from which the spectra were computed are indicated by blue (gray matter) and orange (white matter) rectangles superimposed to the MR-images.
DISCUSSION and CONCLUSION
A novel whole brain SLOW-editing-based pulse-sequence for PE at 7T has been developed and successfully tested in vitro and in vivo. The simulation results (Figure 2) of PE and Glx spectral profiles agree very well with the results obtained in a phantom and volunteers (Figure 4), indicating the close-to-ideal-behaviour of the phase-compensated complex-sech-modulated 2-CSAP. Figure 3 shows the metabolite and derived maps of PE, which show that there is no in-plane CSDE due to the use of 2-CSAP, in contrast to RF refocussing pulses in MEGA-PRESS and to a lesser extend in MEGA-semiLASER. The variation observed in the maps reflect therefore the inherent B1+-inhomogeneity of the non-adiabatic excitation pulse. This inhomogeneity of the excitation pulse is inevitable at 7T when using non adiabatic excitation in combination with a non-pTx RF head-coil. Whole brain in vivo PE-editing can be performed in less than 10 minutes measurement-time and is therefore clinically applicable. In contrast to the referenced MEGA-PRESS sequence, our method has the advantage that an unlimited number of ROIs can be selected and analysed in the resulting 3D MRSI-dataset.Acknowledgements
The research is supported by the Swiss National Science Foundation (SNSF-182569).References
- Shah T, Krishnamachary B, Wildes F, Wijnen JP, Glunde K, Bhujwalla ZM. Molecular causes of elevated phosphoethanolamine in breast and pancreatic cancer cells. NMR in Biomedicine. 2018;31(8).
- Osawa T, Shimamura T, Saito K, et al. Phosphoethanolamine Accumulation Protects Cancer Cells under Glutamine Starvation through Downregulation of PCYT2. Cell Reports. 2019;29(1).
- Hui SCN, Zöllner HJ, Oeltzschner G, Edden RAE, Saleh MG. In vivo spectral editing of phosphorylethanolamine. Magnetic Resonance in Medicine. Published online August 19, 2021.
- Weng G, Kiefer C, Zubak I, Slotboom J. SLOW: Whole Brain Spectral Editing EPSI Based Technique using Chemical Selective Adiabatic 2π-Refocusing Pulses applied to 2HG and GABA Editing. In: ISMRM & SMRT Annual Meeting & Exhibition. ; 2021:1990-1990.
- Weng G, Sheriff S, Kiefer C, Zubak I, Maudsley A, Slotboom J. Simultaneous Water and Lipid Suppression Using Chemical Selective Adiabatic Refocusing Pulses Echo Planar Spectroscopic Imaging (EPSI) at 7T. In: ISMRM & SMRT Annual Meeting & Exhibition. ; 2021:1985-1985.
- Ebel A, Maudsley AA. Improved spectral quality for 3D MR spectroscopic imaging using a high spatial resolution acquisition strategy. Magnetic Resonance Imaging. 2003;21(2):113-120.
- Slotboom J, Mehlkopf AF, Bovee WMMJ. The Effects of Frequency-Selective RF Pulses on J-Coupled Spin-1/2 Systems. Journal of Magnetic Resonance, Series A. 1994;108(1):38-50.
- Slotboom J, Vogels BAPM, Dehaan JG, et al. Proton Resonance Spectroscopy Study of the Effects of L-Ornithine-L-Aspartate on the Development of Encephalopathy, Using Localization Pulses with Reduced Specific Absorption Rate. Journal of Magnetic Resonance, Series B. 1994;105(2).
Figures
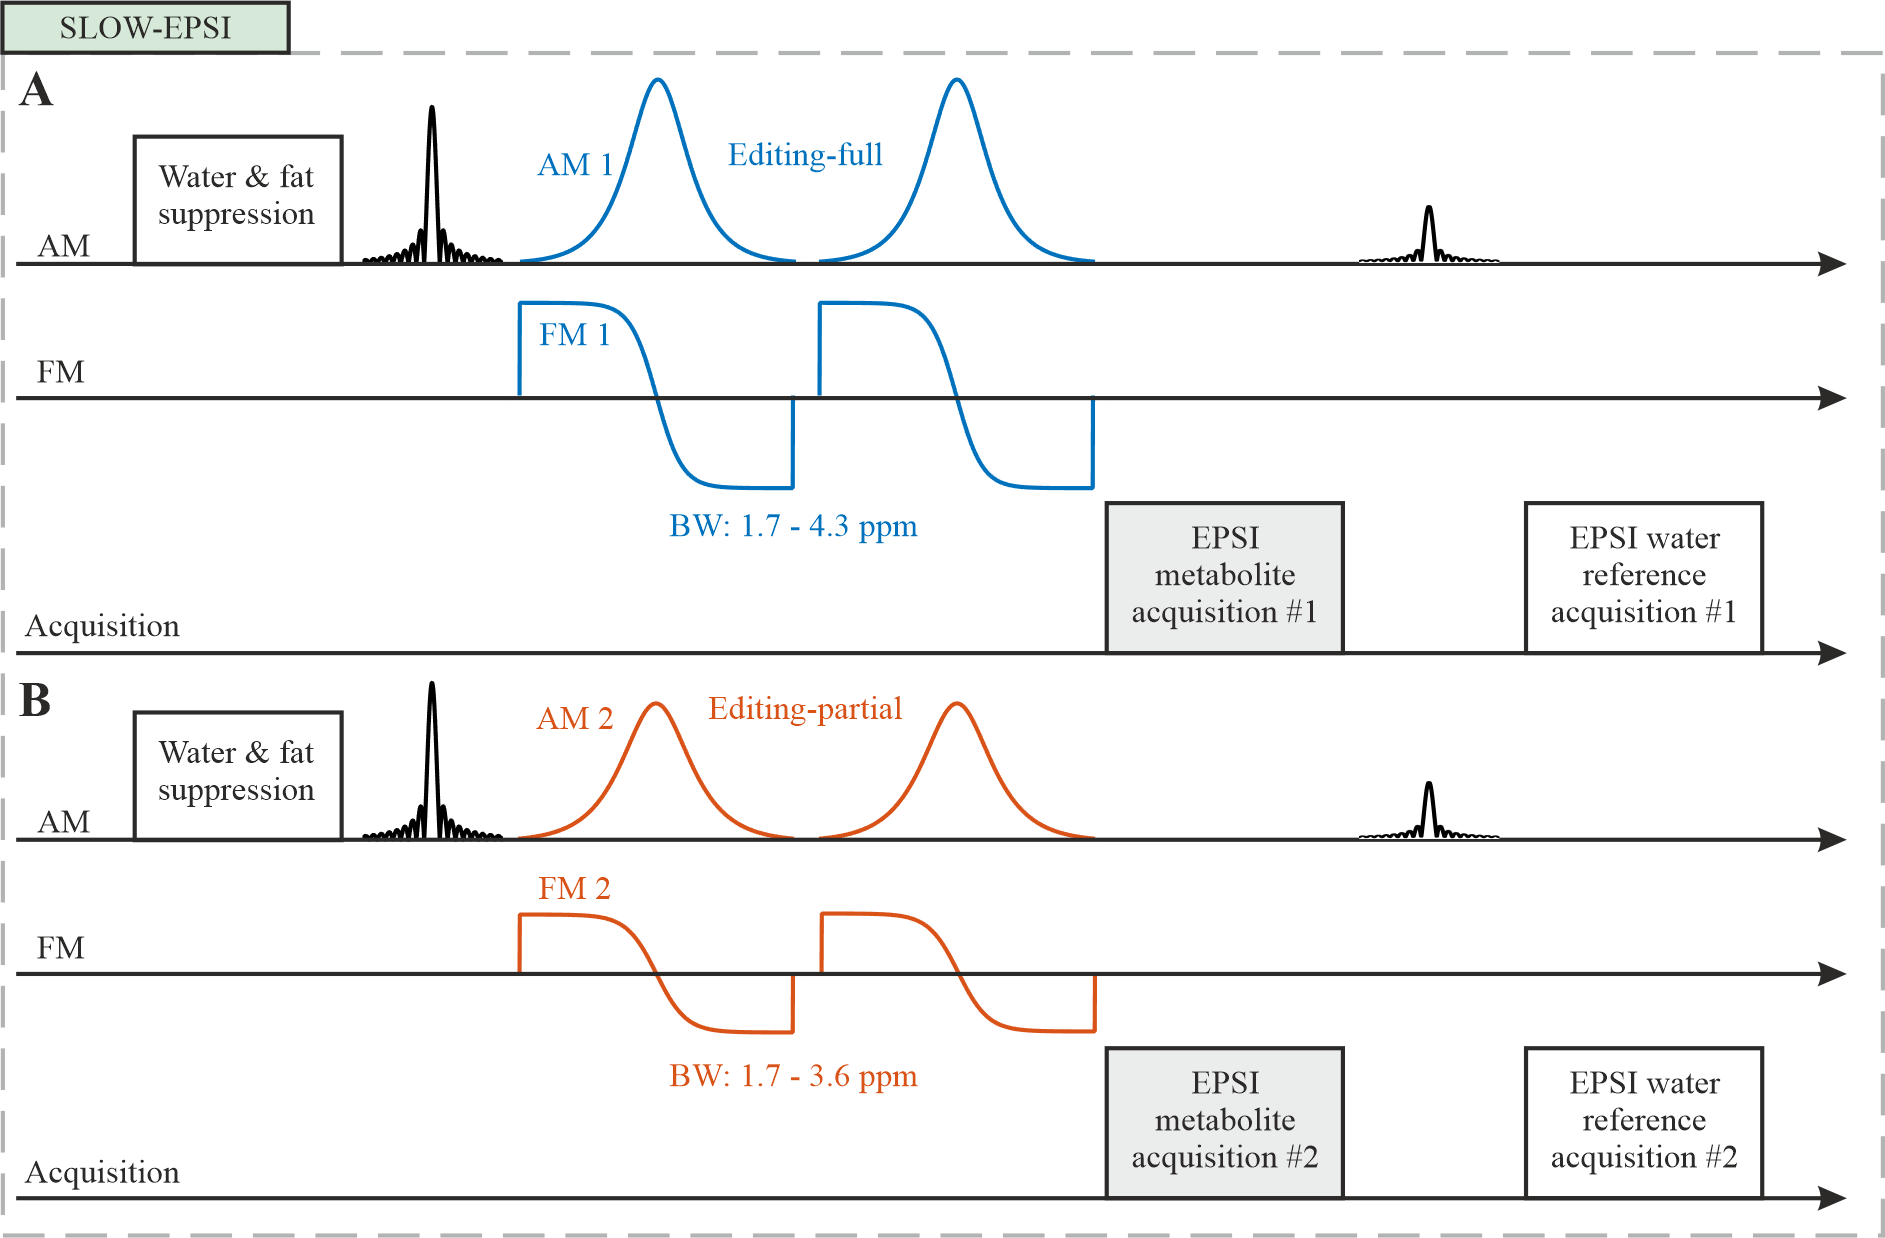
Figure 1: SLOW-EPSI sequence which
makes use of phase compensated adiabatic 2π-pulses with complex secant
hyperbolic modulation type (so called 2π-CSAP pulses) 8. A) Editing-full: the
refocusing/editing pulse BW ranges from 1.7 – 4.3 ppm. B)
Editing-partial: the refocusing/editing pulse BW ranges from 1.7 – 3.6 ppm. The
pulse duration of the 2π-CSAP pulses was 35 ms, enabling a very flat
pass-band and very steep transition bands, which simultaneously suppress water
and lipid signals as well. The results presented in this contribution used an
EPSI read-out as described by 6.
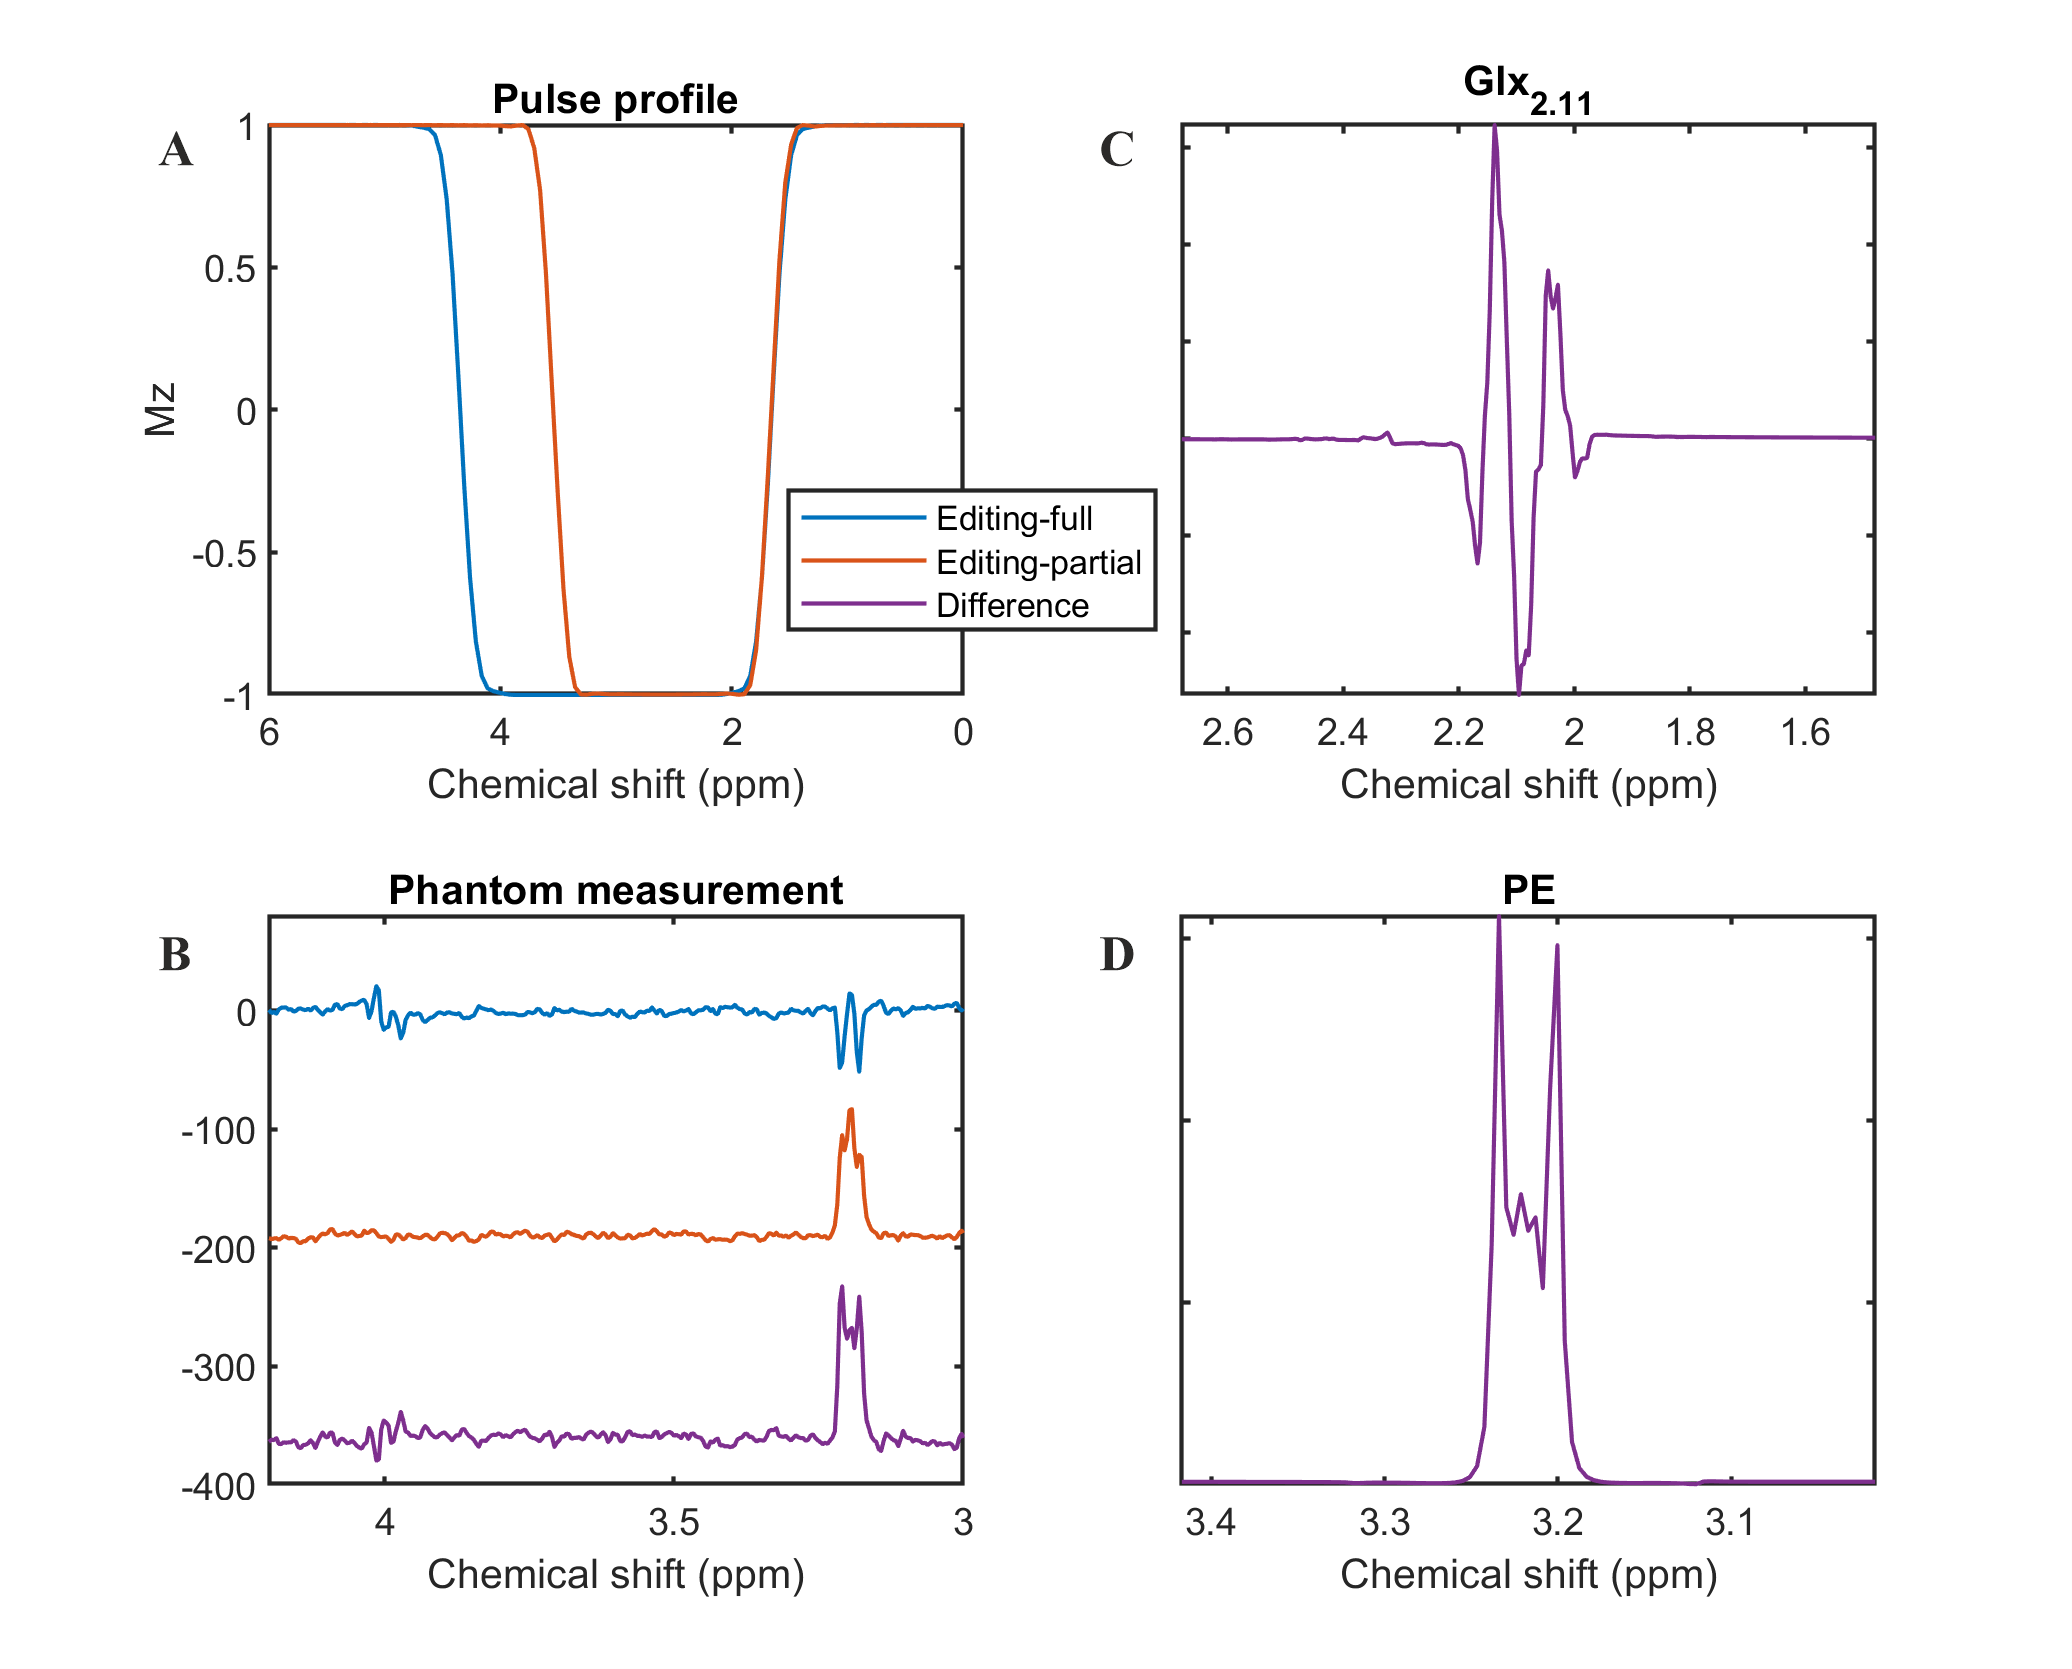
Figure 2: SLOW-editing of PE. A)
Pulse profiles of editing-full and -partial pulse. B) The phantom
measurement results: editing-full (blue), editing-partial (orange), and
difference (purple). C) The simulation of Glx (glutamate/glutamine =
2/1) under SLOW-editing. D) The simulation of PE (glutamate/glutamine =
2/1) under SLOW-editing. Note the striking resemblance between simulation and
phantom measurement.
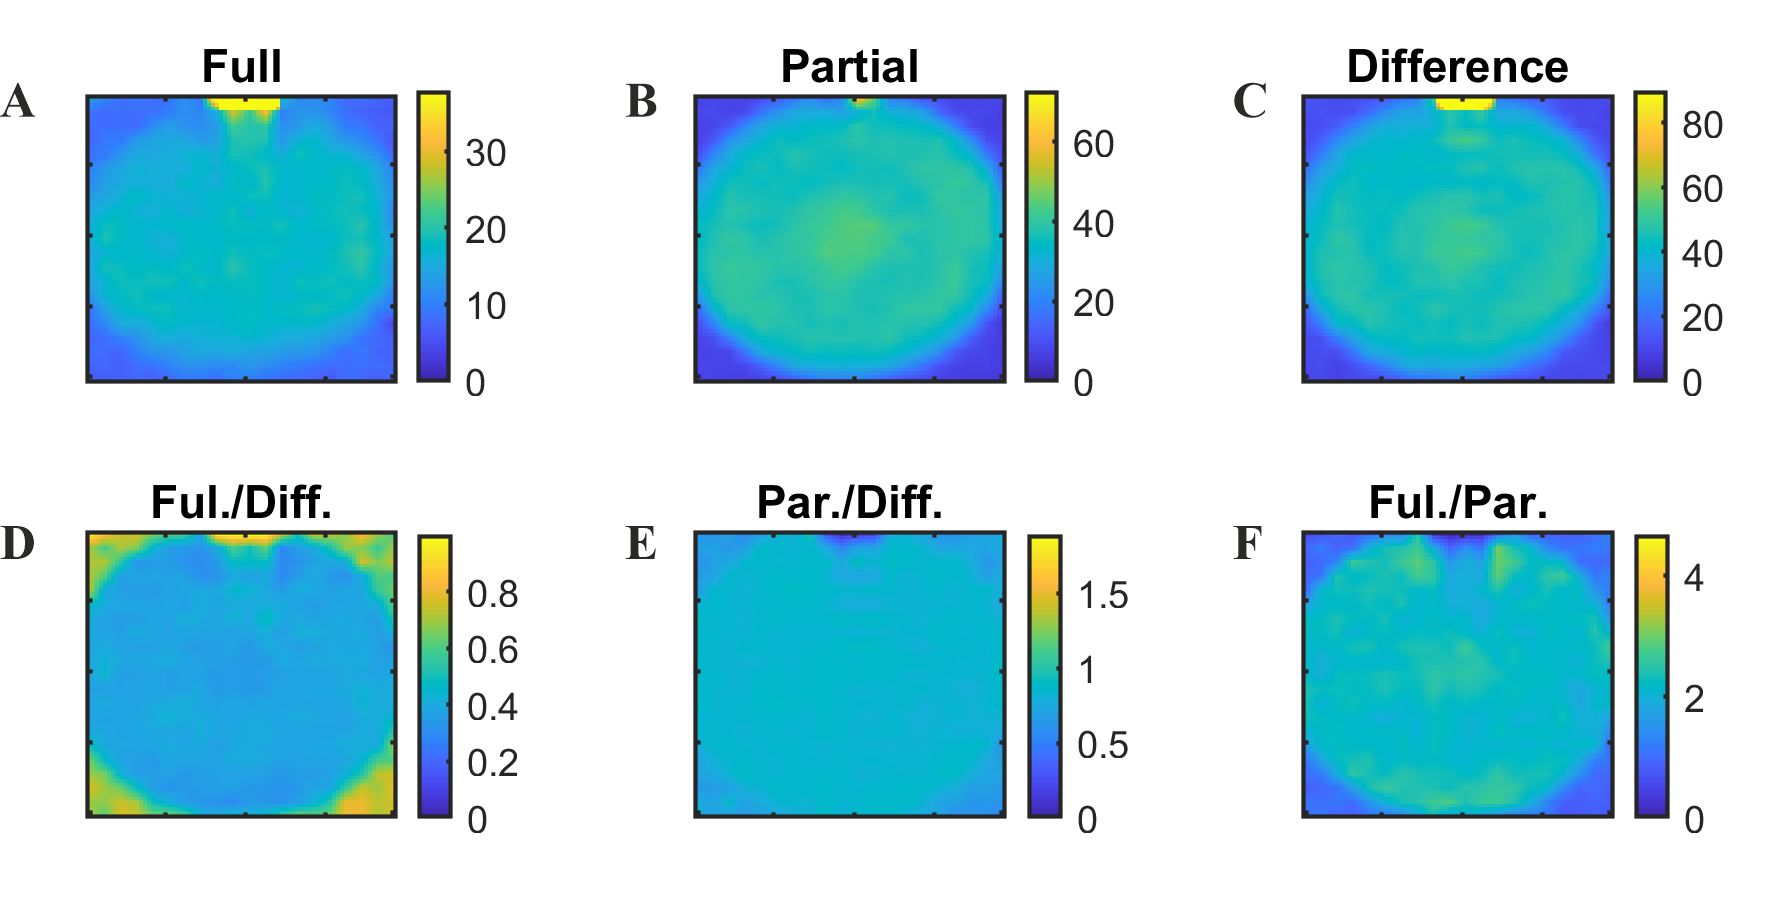
Figure 3: PE peak integration map at 3.22
ppm. A-C) The integration map of editing-full and -partial, and
difference, respectively. D-F) The integration map of
editing-full/difference, editing-partial/difference, and
editing-full-editing-partial, respectively.
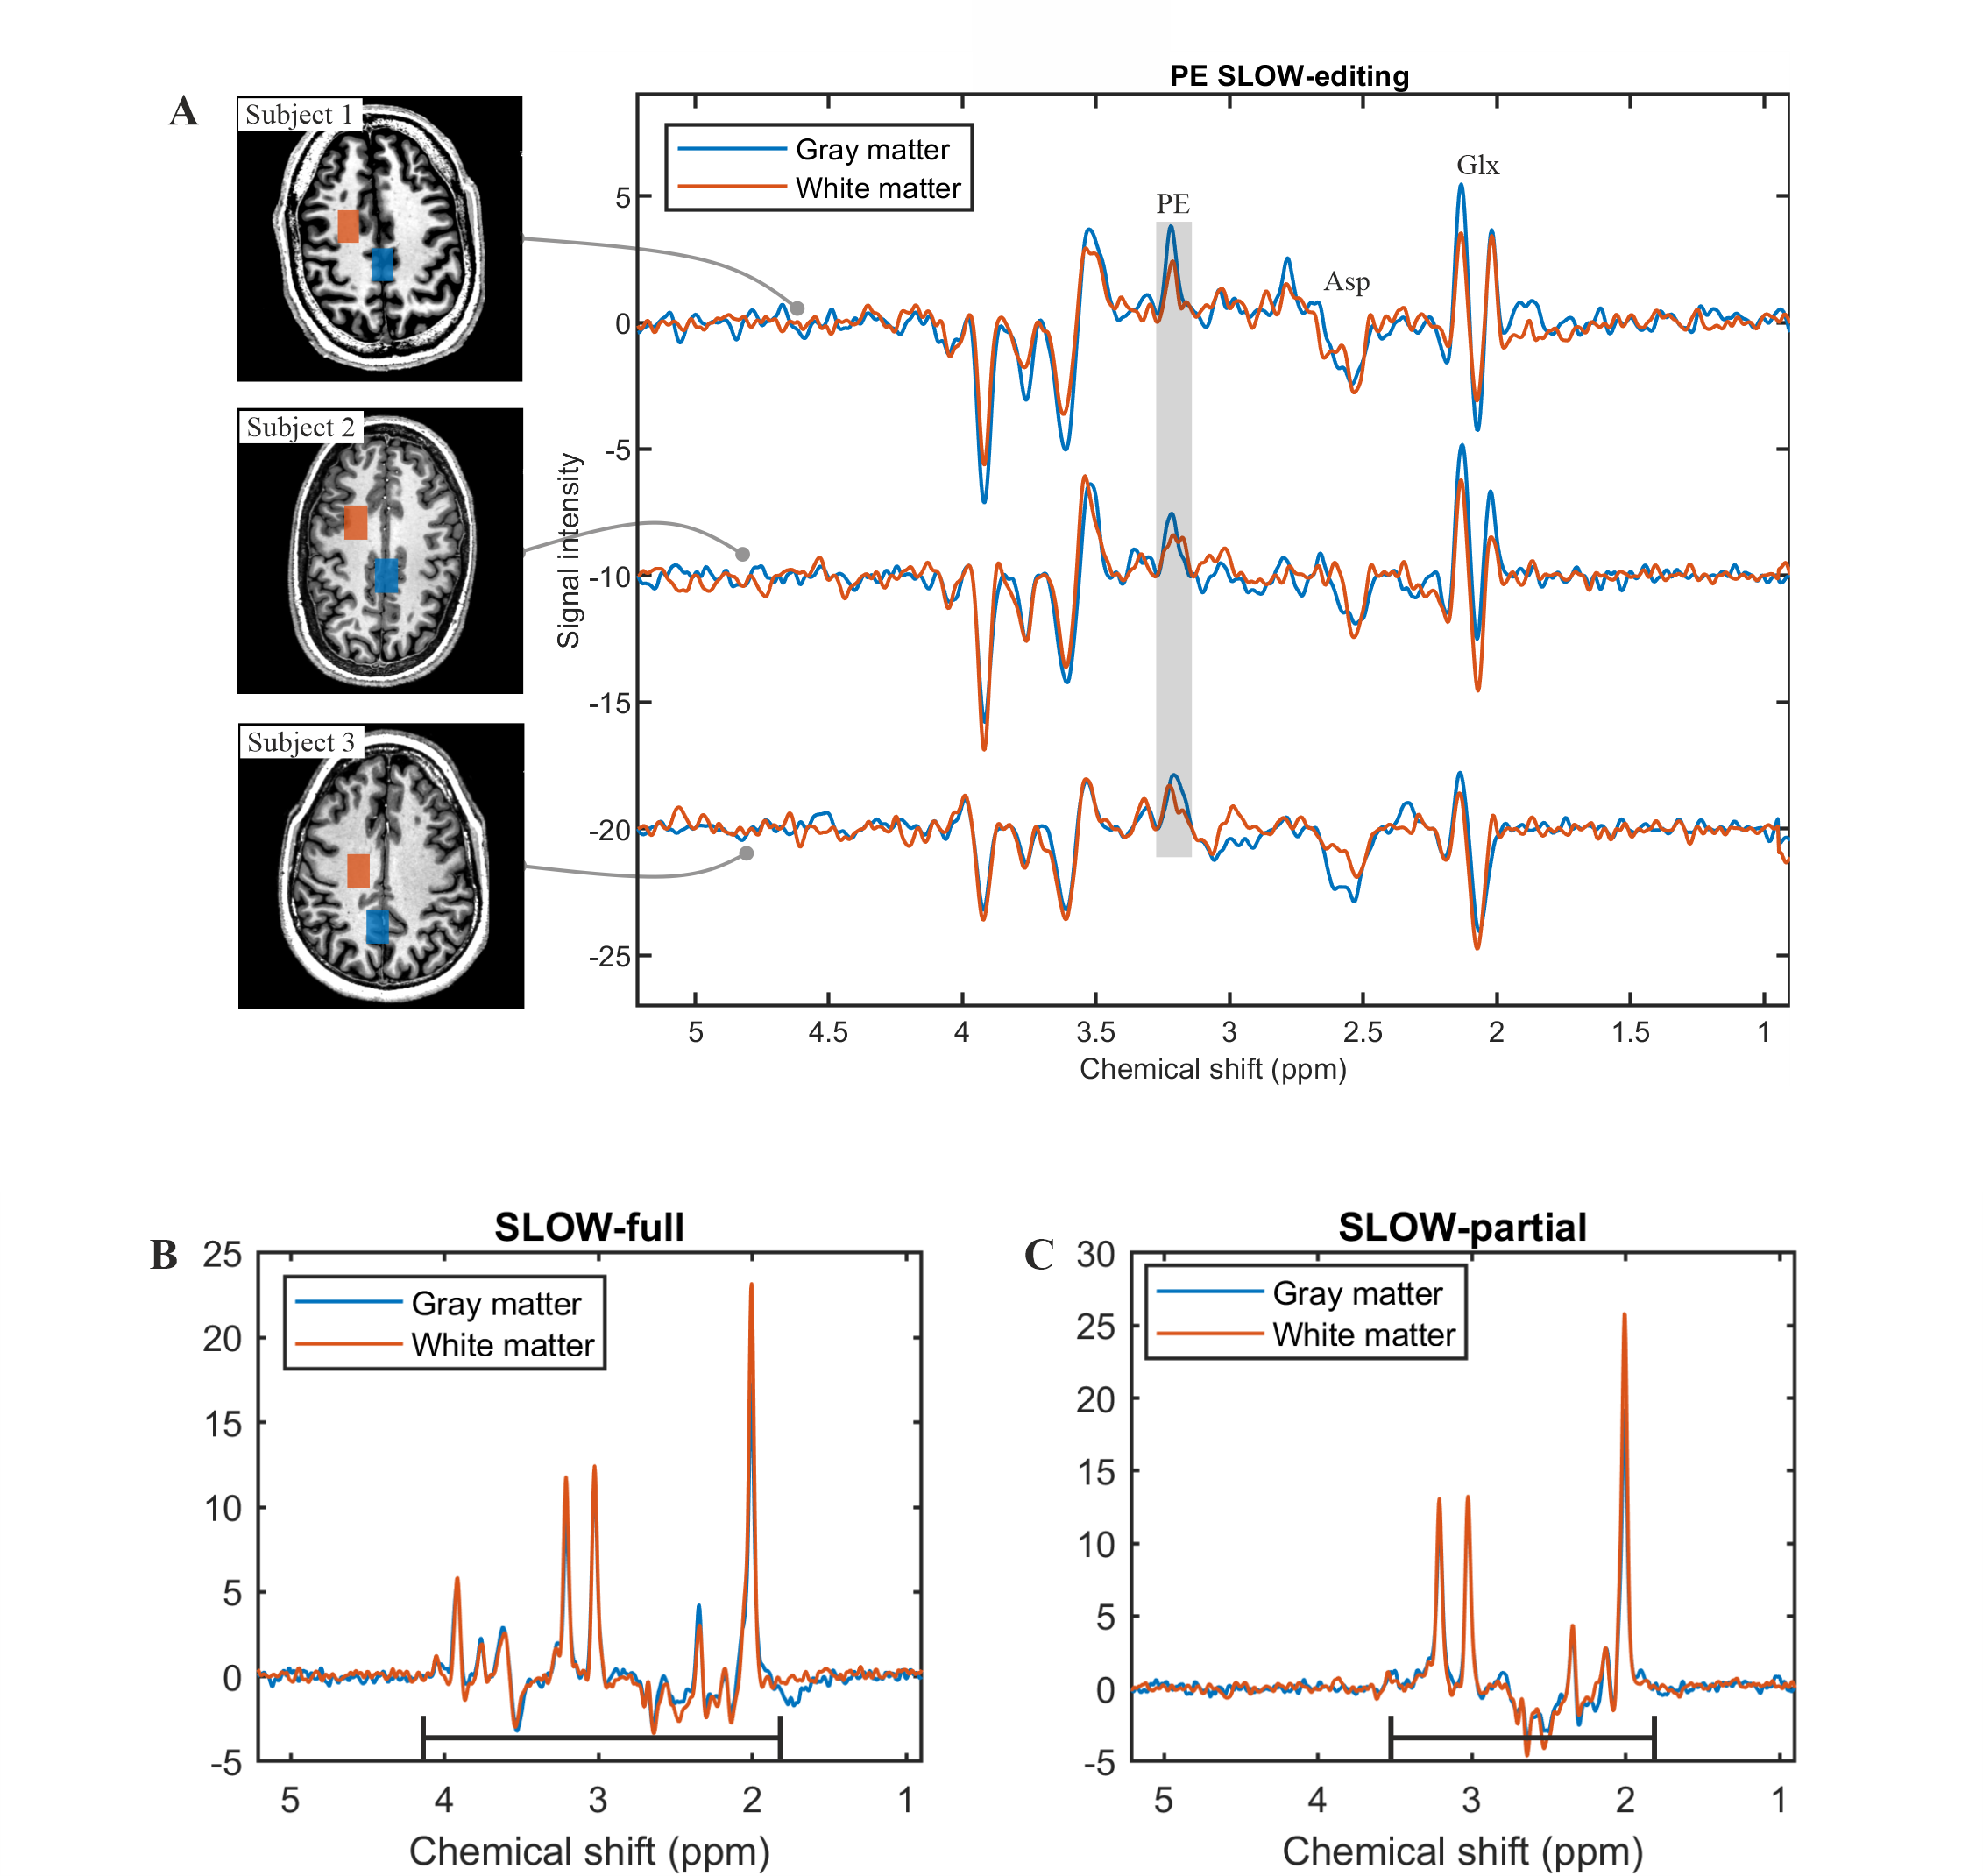
Figure 4: In vivo measurement of
SLOW-editing for PE. A) The spectral editing difference (editing-partial
minus editing-full) of SLOW-editing for three health subjects. The edited
difference spectrum of subject 2, 3 required baseline correction using splines.
B-C) The editing-full and -partial results of subject 1, respectively.
The black lines indicate the passband of the 2π-CSAP pulses. No baseline
correction was applied, and no water/lipid removal needed in this case. TE = 90
ms, TR = 1500 ms, matrix = 65 x 23 x 9, FOV = 280 x 180 x 70 mm, and TA = 9:04
min.
DOI: https://doi.org/10.58530/2022/1042