1037
Investigating Spiral Arterial Spin Labeling with Pulseq and Field Monitoring at 7T1Faculty of Psychology and Neuroscience, Maastricht University, Maastricht, Netherlands
Synopsis
We developed several ASL sequences at 7T with a FAIR-QUIPSS II labeling scheme and various spiral readout strategies using Pulseq. Iterative algebraic image reconstruction was performed with CG-SENSE, using the field evolution data measured with external NMR probes. Robust performance in detecting brain’s perfusion signal was observed in 2D single- and multi-band spiral acquisitions especially at relatively high spatial resolution, without the requirement for a longer scan time. 3D spiral acquisition showed reduced contrast level in perfusion maps and requires further investigation and optimization.
Introduction
Pulseq1 is an open-source MR pulse sequence development package with direct access to all elements in MR sequences including RF pulses, gradients, ADCs and triggers, without going through the time-consuming vendor-specific sequence programming to investigate sequence behavior. Field monitoring with external NMR probes2 enables high-fidelity measurement of the gradient performance and therefore field correction during image reconstruction. In this study, combining the two techniques, we aimed at developing and implementing Arterial Spin Labeling (ASL) acquisitions to investigate the possibility of improving the quality of the measured perfusion signal by comparing perfusion maps from various spiral readout strategies.Methods
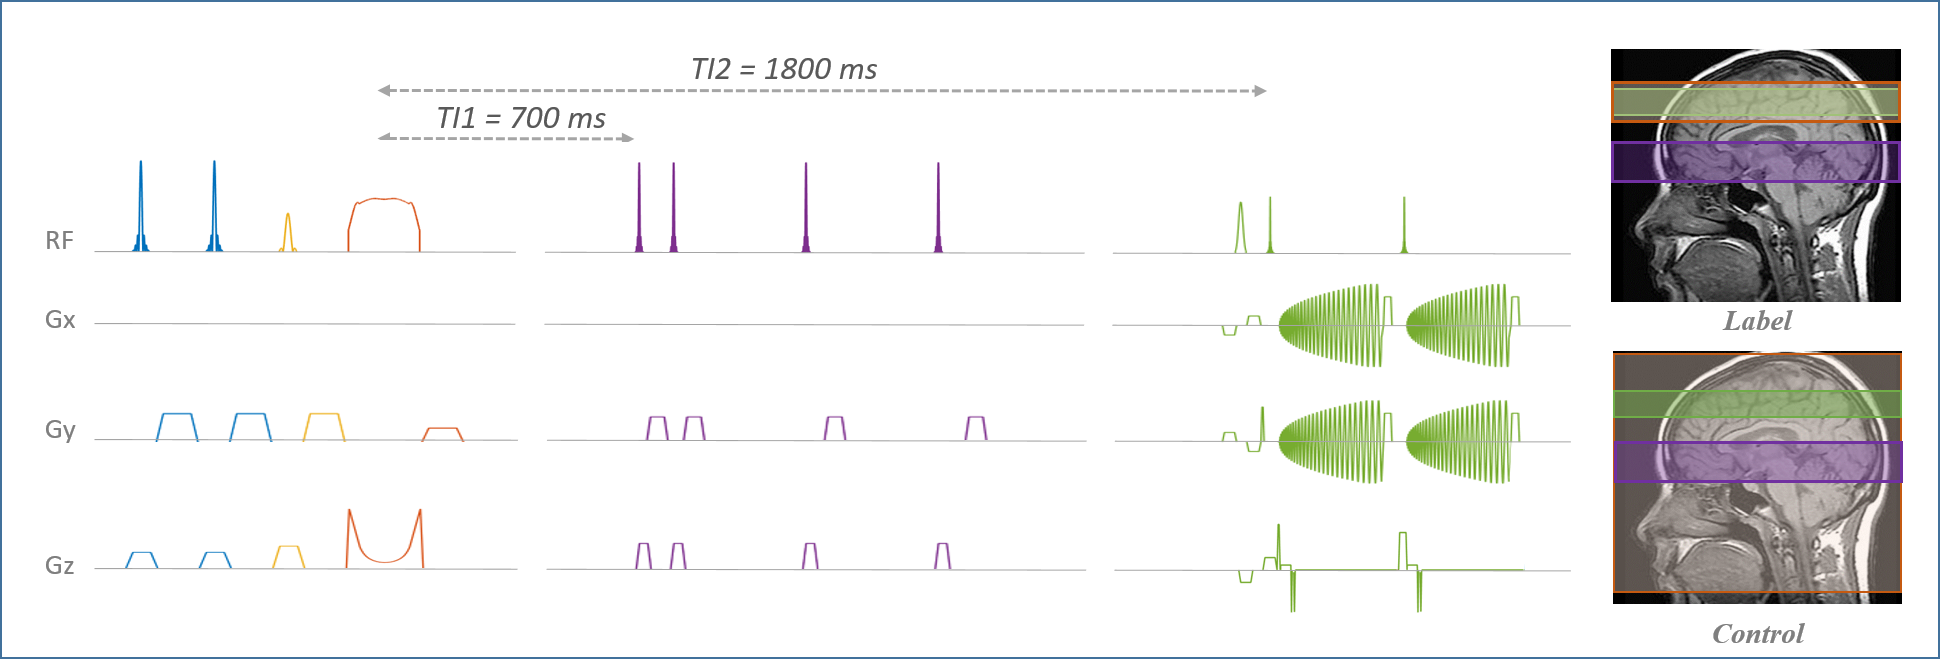
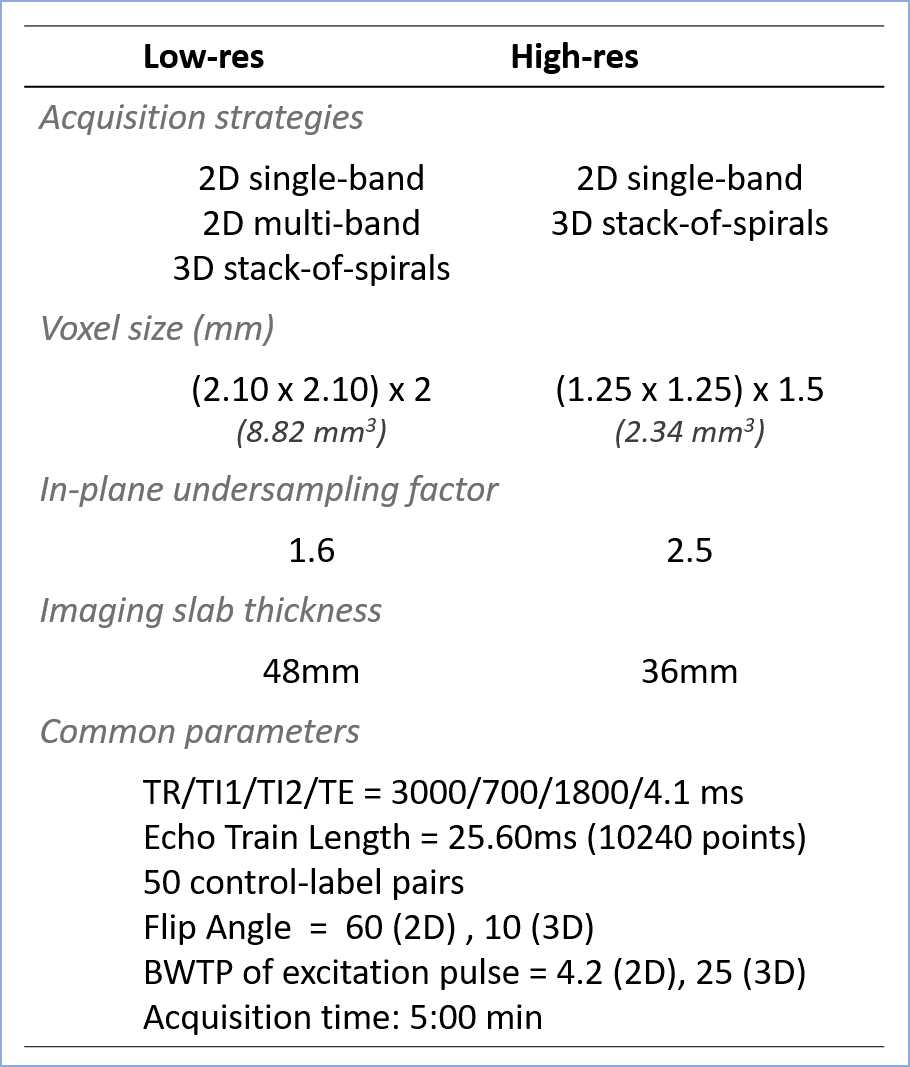
FAIR-QUPISS II labeling module using a tr-FOCI inversion pulse3 was implemented for the spiral ASL sequence using Pulseq in Matlab (The MathWorks, Inc.). The sequence diagram is shown in Fig.1.Two resolution levels, denoted as low-res (8.82mm3) and high-res (2.34mm3), were chosen following an earlier study4. 2D single-band and multi-band CAIPI-sampled spiral5, and 3D stack-of-spirals (SOSP) acquisitions were investigated. The acquisition parameters are listed in Fig.2. For 2D acquisitions, slices were acquired in the ascending order without gap between the neighboring slices. Same number of repetitions was measured for all acquisition strategies to facilitate the comparison afterwards. The sequences designed using Pulseq were compiled using a vendor-specific interpreter and executed on a 7T whole body Siemens scanner (Siemens Healthineers, Erlangen, Germany) with a 1x32 channel head coil (Nova Medical, Wilmington, MA, USA). One participant was tested with all acquisition strategies.
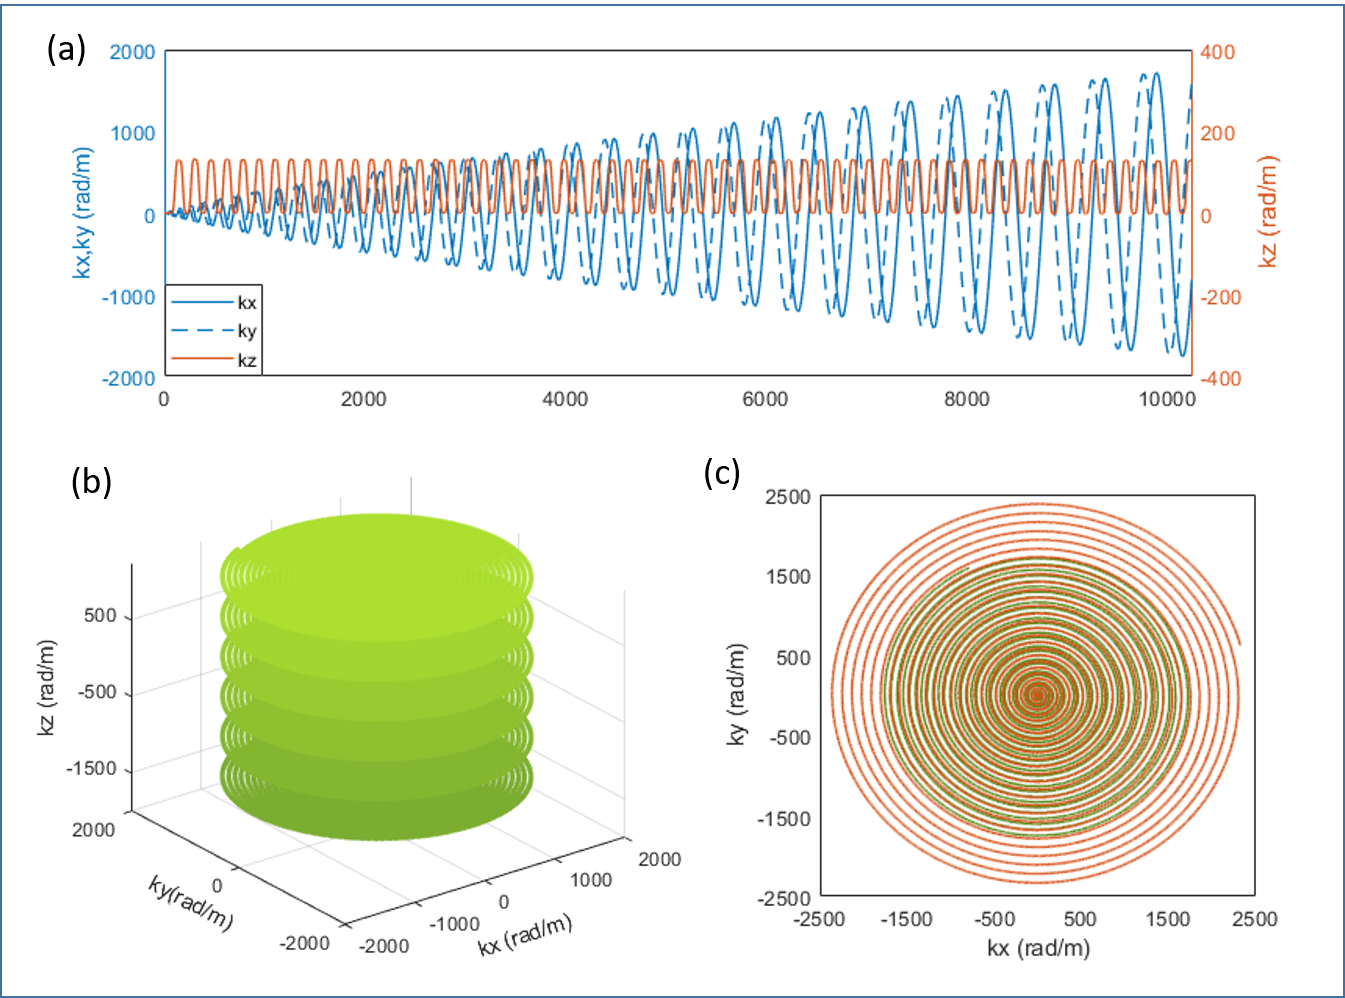
Field monitoring was performed after image acquisition with 16 F19 NMR probes (Skope, Zurich, Switzerland) placed at the iso-center of the scanner. Examples of measured 1st order field evolution are shown in Fig.3. GPU-accelerated algebraic reconstruction with field correction of up to 2nd order based on CG-SENSE model6 was programmed in Matlab. Retrospective motion correction was performed using the realign function from SPM (SPM12, www.fil.ion.ucl.ac.uk/spm/software/spm12/). tSNR maps were computed for quality control. Relative Perfusion-weighted (PW) images, calculated as the difference between label and control images normalized to control images, were generated to evaluate the performance of perfusion signal detection for every encoding scheme.
Results
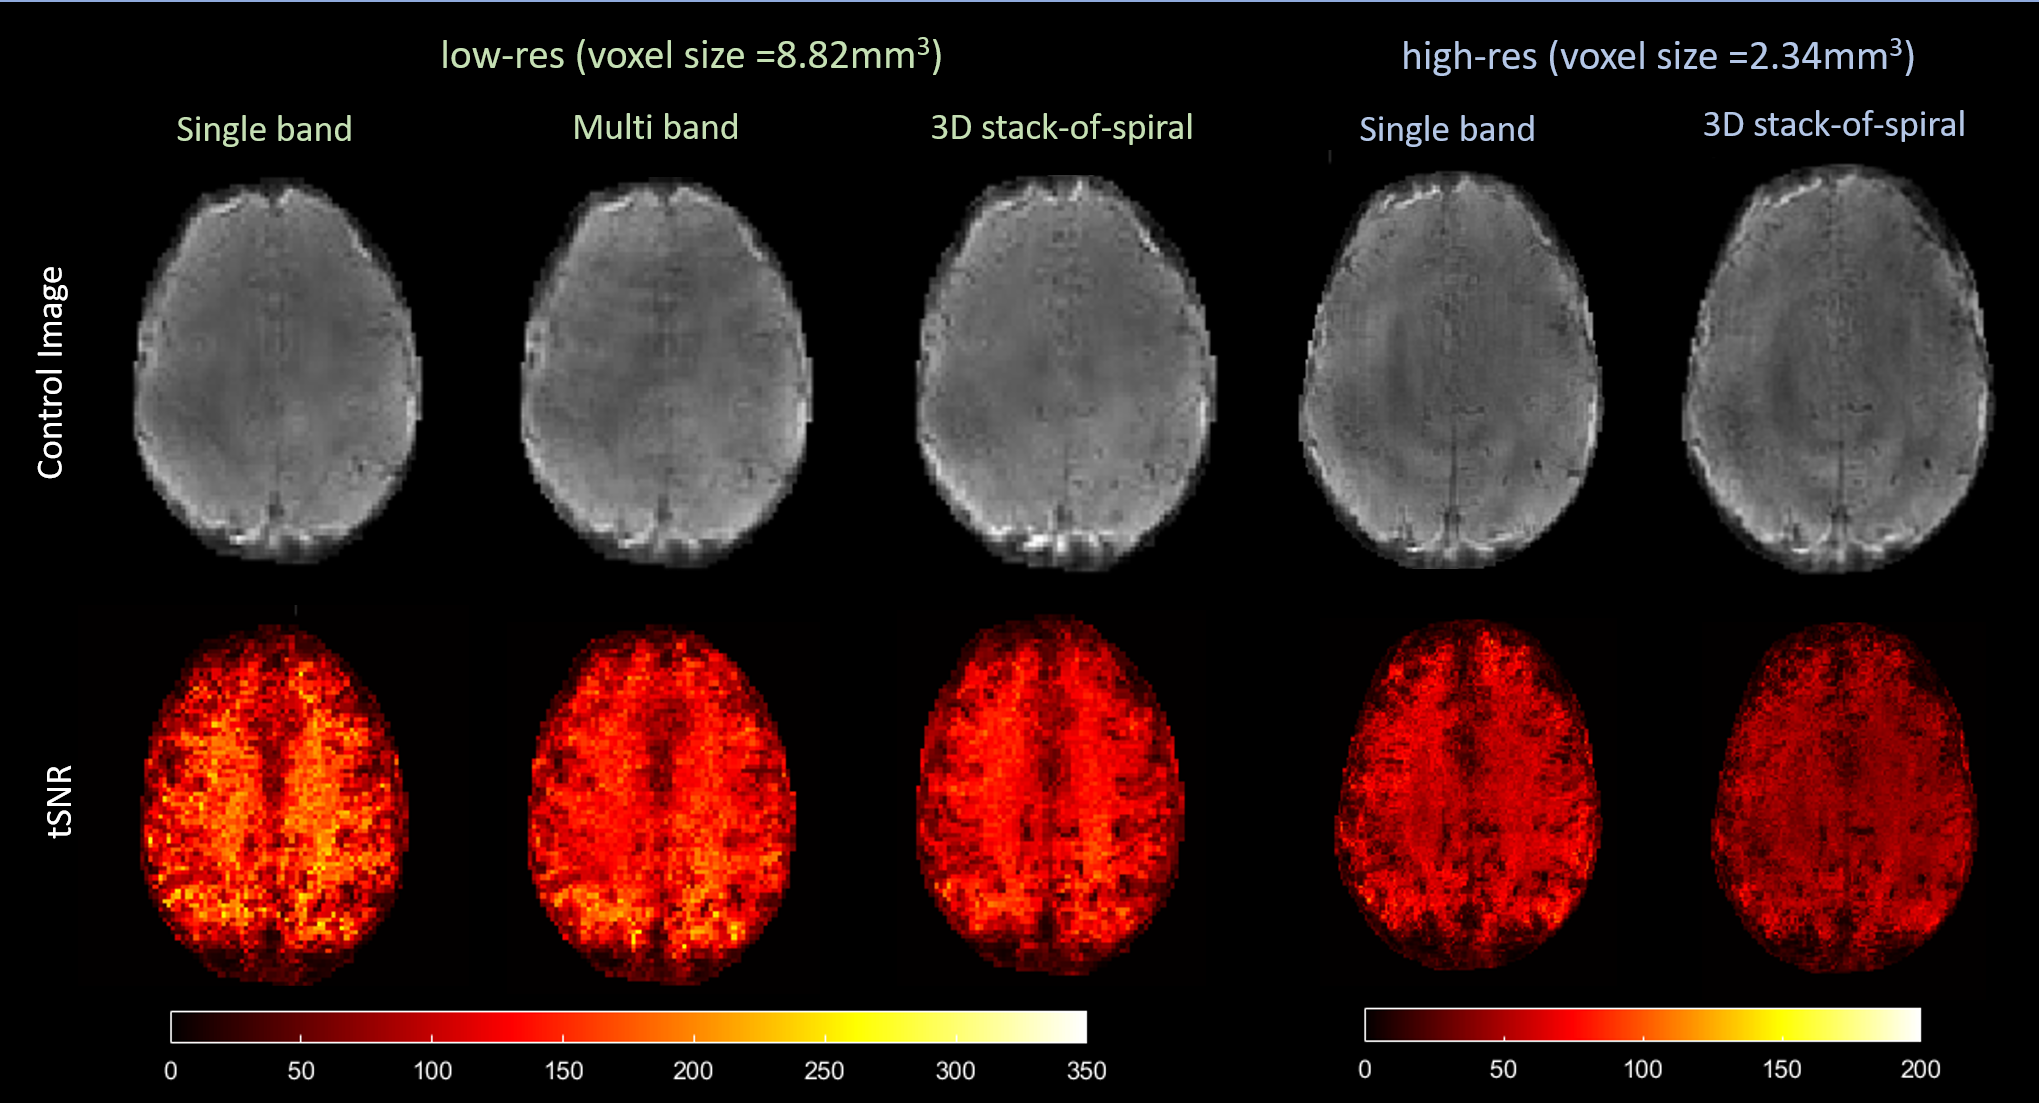
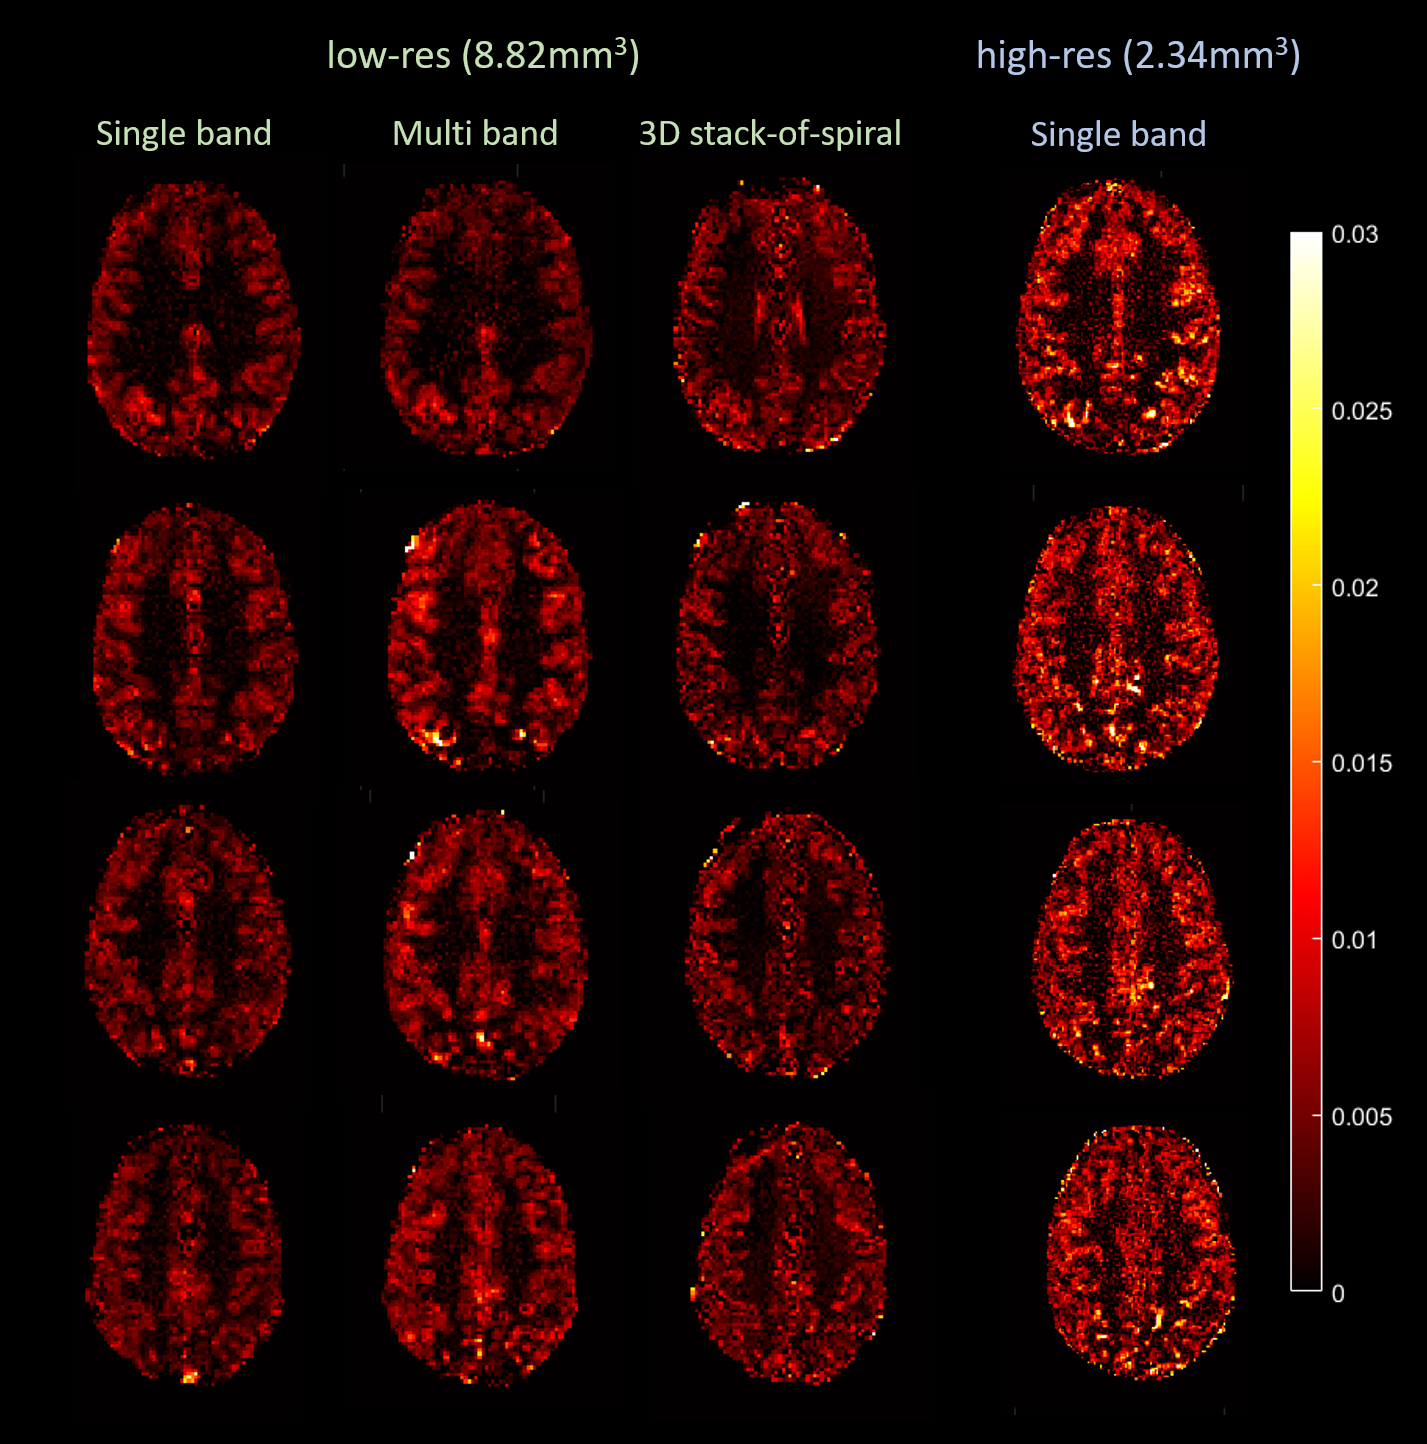
Examples of reconstructed control images from every acquisition scheme with the corresponding tSNR maps are shown in Fig.4. High-res acquisitions showed more clearly delineated tissue boundaries compared to the low-res acquisitions. 3D SOSP acquisitions showed lower tSNR compared to that of 2D. As expected, due to 74% decrease in voxel size and 56% increase in undersampling factor, the tSNR of the high-res acquisitions was significantly lower than that of low-res acquisitions.Fig.5 shows the relative PW images from various acquisitions. With our parameter settings, the 3D high-res acquisition showed very noisy perfusion signal without distinguishable difference between gray and white matter and was therefore not included in the figure. Low-res single-band and multi-band acquisitions both showed perfusion signal nicely following the gray matter. Higher contrast level was seen in the multi-band images. 3D low-res acquisitions yielded similar spatial distribution of perfusion signal but with slightly lower contrast level and less blurring. The advantage of high-res acquisition can be observed in the PW images from the 2D single-band acquisitions with spatially more clearly resolved perfusion signal, albeit with a higher noise level. In addition, the 2D high-res acquisition showed the highest contrast level among all examined cases.
Discussion and Conclusion
In this study, using Pulseq and field monitoring, we successfully implemented FAIR-QUIPSS II ASL acquisitions and reconstructions with spiral readouts. Different levels of resolution with 2D and 3D spiral sampling were investigated. High resolution perfusion-weighted signals were obtained with the 2D acquisition. Higher tSNR is seen in 2D acquisitions likely due to reduced physiological noise compared to the 3D scenario. The measured perfusion signal, however, showed a more complicated pattern following the change in acquisition scheme. The high perfusion signal in the 2D high-res acquisition could be linked to reduced partial volume effects. The very low contrast level in the high-res 3D acquisition compared to its 2D counterpart requires further investigation. The long readout time in the 3D approach, i.e., 24 times as long as the 2D acquisition for each slice with our parameters, could result in larger physiological noise and larger dynamic change of the local magnetic field during the imaging period. Future investigation on optimizing the 3D acquisitions shall include approaches such as reducing the imaging time per volume, flip angle optimization schemes and different sampling orders in the slice direction.Acknowledgements
The study was supported by funding from Dutch Research Council with NWO VIDI grant 16.Vidi.178.052 (REM, DK, BAP), NWO VENI project 016.Veni.198.032 (RH), and European Research Council H2020 FET-Open AROMA grant agreement no. 88587 (BAP). REM is grateful for the insightful discussions with Dr. Pierre-François Van de Moortele, Dr. Mehmet Açkakaya and Dr. Steen Moeller from University of Minnesota, USA, on the technical details of field correction implementationReferences
1, Layton KJ, Kroboth S, Jia F, et al. Pulseq: A rapid and hardware-independent pulse sequence prototyping framework. Magn Reson Med. 2016;77(4):1544-1552.
2, Barmet C, De Zanche N, Pruessmann KP. Spatiotemporal magnetic field monitoring for MR. Magn Reson Med. 2008;60:187-197.
3, Ivanov D, Poser BA, Huber L, et al. Optimization of simultaneous multislice EPI for concurrent functional perfusion and BOLD signal measurements at 7T. Magn Reson Med. 2017; 78(1): 121-129.
4, Ivanov D, Gardumi A, Haast RAM, et al. Comparison of 3T and 7T ASL techniques for concurrent functional perfusion and BOLD studies. NIMG. 2017;156:363-376
5, Zahneisen B, Poser BA, Ernst T, et al. Simultaneous multi-slice fMRI using spiral trajectories. NIMG. 2014; 92:8-18.
6, Wilm BJ, Barmet C, Pavan M, et al, Higher order reconstruction for MRI in the presence of spatiotemporal field perturbations. Magn Reson Med. 2011;65:1690-1701.
7, Hurley AC, Al-Radaideh A, Bai L, et al. Tailored RF pulse for magnetization inversion at ultrahigh field. Magn Reson Med. 2010;63(1):51-58.
8, Wong EC, Buxton RB, Frank LR. Quantitative imaging of perfusion using a single subtraction (QUIPSS and QUIPSS II). Magn Reson Med. 1998;39(5):702-708.
Figures