1032
SLOW-editing for GABA/GABA+ MRSI at 7T
Guodong Weng1,2, Piotr Radojewski1,2, and Johannes Slotboom1,2
1Institute for Diagnostic and Interventional Neuroradiology, Support Center for Advanced Neuroimaging (SCAN), University of Bern, Bern, Switzerland, 2Translational Imaging Center, sitem-insel AG, Bern, Switzerland
1Institute for Diagnostic and Interventional Neuroradiology, Support Center for Advanced Neuroimaging (SCAN), University of Bern, Bern, Switzerland, 2Translational Imaging Center, sitem-insel AG, Bern, Switzerland
Synopsis
Purpose: whole brain in vivo detection of GABA/GABA+ using SLOW-editing at 7T.
Methods: An EPSI-based B0/B1+ robust SLOW-editing was applied in four healthy subjects. Pure GABA was measured by two different macromolecular-nulling inversion recovery pulses, namely a broadband- and a narrowband-inversion pulse.
Results: the editing GABA/GABA+ signal at 3.01 ppm are presented. The signal intensity of GABA/GABA+ ratio is 40 – 60%.
Conclusions: whole-brain in vivo GABA/GABA+-editing can be performed using SLOW-EPSI in around 10 minutes measurement time and is therefore clinically applicable.
INTRODUCTION
Recently, SLOW-editing has been proposed as an alternative MEGA-editing at UHF1,2. The advantage of SLOW-editing compared to MEGA-editing is that it requires very low SAR, and, if combined with an EPSI readout 3, enables whole-brain coverage of GABA+ (i.e., GABA plus the coedited macromolecules (MM)) within a measurement of 10 minutes. Like MEGA-based GABA-editing 4, SLOW-editing as presented in 1, has the property that the MM at ~3 ppm is also refocussed. In this abstract we present two different methods to eliminate the MM-component, to measure GABA instead of GABA+.We compared (i.) the original SLOW-editing technique 1 (denoted by IR-off) for detecting GABA+, (ii.) with a broadband MM suppression adiabatic inversion recovery pulse 5 (denoted by IR-on), and (iii.) a narrowband MM suppression adiabatic inversion recovery (denoted by sIR-on). The three methods were tested and compared in vivo.
METHODS
The MRI and MRSI was performed on a Siemens 7T MR scanner in clinical mode (MAGNETOM Terra, Germany) using the Nova 1Tx 32Rx head coil.The SLOW-EPSI 1–3 (Figure 1A-B) was applied on a spherical GABA-phantom prepared in-house (~10 mmol/L of GABA, creatine, and glycine), and 4 healthy volunteers at 7T (TE = 68 ms, TR = 1500/1700 ms, matrix = 65 x 23 x 9, FOV = 280 x 180 x 70 mm, averages = 1, and TA = 9/10 min). The refocusing/editing chemical-selective adiabatic pulse (CSAP) for SLOW-editing has a 24 ms duration. The bandwidth (BW) of editing-full and editing-partial ranges from 1.6 – 4.2 ppm and 2.7 – 4.2 ppm, respectively (Figure 2A). The editing result was obtained by the subtraction of editing-full (acquisition #1) and editing-partial signal (acquisition #2). In SLOW-editing, the 2π-CSAP acts as a refocusing- and as well as an editing-pulse.
For GABA+ detection, no suppression pulse was applied to suppress the ~3.0 ppm MM-component (Figure 4A). For GABA detection, two types of suppressed pulses were used: a broadband (1.2-4.9 ppm) adiabatic inversion recovery (IR) pulse 5 (Figure 4B) and a narrowband (2.75 - 3.15 ppm) asymmetric adiabatic inversion recovery (sIR) pulse (Figure 4C). Note that the same sIR pulse was used to suppress lipid (1.45 – 1.85 ppm) instead of MM for GABA+ detection. The IR and sIR pulse have both complex secant hyperbolic B1(t) = Ω0·sech(βt)1+μt modulation6.
Simulations of spin system were performed using in-house MATLAB (R2019b) code, by solving relaxation-free Liouville-von Neumann Equation alike in reference7.
RESULTS
Figure 2A shows the pulse profiles of editing-full (1.6 – 4.2 ppm) and editing-partial (2.7 – 4.2 ppm). The corresponding in vitro measurement for GABA was shown in Figure 2B. Figure 2C-D shows the simulation of Glx (glutamate/glutamine = 2/1) at 3.76 ppm and GABA at 3.01 ppm using SLOW-editing.Figure 3A shows the in vivo measurement (spectral editing difference) of three healthy volunteers with baseline correction by splines. The GABA+ signal at 3.01 ppm is clearly present in both gray- and white-matter, as well as the co-edited Glx at 3.76 ppm. The GABA+ signal is higher in gray matter than in white matter, as expected. Figure 3B shows the results of SLOW/editing-full and -partial of subject 1. The black lines indicate the passband of the 2π-CSAP pulses. Due to the implicit water and lipid suppression of the 2π-CSAP pulses, no baseline correction was applied, and no water/lipid removal needed in this case.
Figure 4 shows the pulse sequences for GABA+ and GABA detection. The TIs used, are 234, 300 5 and 180 ms, respectively. The TI of sIR-on (Figure 4C) was experimentally determined such that the reduction of the signal at 3 ppm coincides with IR-on to obtain MM-nulling spectrum (Figure 4B)5.
Figure 5 shows the in vivo measurement to detect GABA+ and GABA in a healthy subject. The pulse sequences used to detect MM suppressed IR-off, IR-on and sIR-on spectra were shown in Figure 4A-C. Figure 5C-D show the SLOW/editing-full and -partial results in location 1 (indicated in Figure 4B), and the IR-on and sIR-on have the similar reduction (65 - 75%) of signal at 3 ppm. The spectral editing differences for GABA+ and GABA are illustrated in Figure 5A, E-F for three different locations (as displayed in Figure 5B). The peak intensity ratio of GABA/GABA+ signal at 3.01 ppm ranges from 40 - 60%, which is consistent with the reference5.
DISCUSSION
Both IR-on and sIR-on can eliminate the MM signal from the GABA+ signal, whereas broadband IR-on MM nulling can result in a flatter baseline due to better suppression of lipids and other MMs. However, sIR-on has the clear advantage of lower SAR requirement and high signal intensity of other metabolites. Since the sIR- and the IR-pulse are of adiabatic complex sech-type, their performance is robust to B1+-inhomogeneities as present in the 1Tx 32Rx head coil.CONCLUSION
SLOW-editing has successfully been combined with adiabatic IR-on and sIR-on MM-nulling RF-pulses enabling the unbiased measurement 3D spatial resolved editing of GABA at UHF within 10 minutes of measurement time. The GABA/GABA+ ratio at 3.01 ppm is consistent with values given in literature.Acknowledgements
The research is supported by the Swiss National Science Foundation (SNSF-182569).References
- Weng G, Kiefer C, Zubak I, Slotboom J. SLOW: Whole Brain Spectral Editing EPSI Based Technique using Chemical Selective Adiabatic2π-Refocusing Pulses applied to 2HG and GABA Editing. In: 2021 ISMRM & SMRT Annual Meeting & Exhibition 15-20 May 2021. ; 2021.
- Weng G, Sheriff S, Kiefer C, Zubak I, Maudsley AA, Slotboom J. Simultaneous Water and Lipid Suppression Using Chemical Selective Adiabatic RefocusingPulses Echo Planar Spectroscopic Imaging (EPSI) at 7T. In: 2021 ISMRM & SMRT Annual Meeting & Exhibition 15-20 May 2021. ; 2021.
- Ebel A, Maudsley AA. Improved spectral quality for 3D MR spectroscopic imaging using a high spatial resolution acquisition strategy. Magnetic Resonance Imaging. 2003;21(2):113-120.
- Choi IY, Andronesi OC, Barker P, et al. Spectral editing in 1H magnetic resonance spectroscopy: Experts’ consensus recommendations. NMR in Biomedicine. 2021;34(5):e4411.
- Moser P, Hingerl L, Strasser B, et al. Whole-slice mapping of GABA and GABA+ at 7T via adiabatic MEGA-editing, real-time instability correction, and concentric circle readout. NeuroImage. 2019;184:475-489.
- Conolly S, Nishimura D, Macovski A. A selective adiabatic spin-echo pulse. Journal of Magnetic Resonance (1969). 1989;83(2):324-334.
- Slotboom J, Mehlkopf AF, Bovee WMMJ. The Effects of Frequency-Selective RF Pulses on J-Coupled Spin-1/2 Systems. Journal of Magnetic Resonance, Series A. 1994;108(1):38-50.
- Slotboom J, Vogels BAPM, Dehaan JG, et al. Proton Resonance Spectroscopy Study of the Effects of L-Ornithine-L-Aspartate on the Development of Encephalopathy, Using Localization Pulses with Reduced Specific Absorption Rate. Journal of Magnetic Resonance, Series B. 1994;105(2).
- Ogg RJ, Kingsley RB, Taylor JS. WET, a T1- and B1-Insensitive Water-Suppression Method for in Vivo Localized 1H NMR Spectroscopy. Journal of Magnetic Resonance, Series B. 1994;104(1):1-10.
Figures
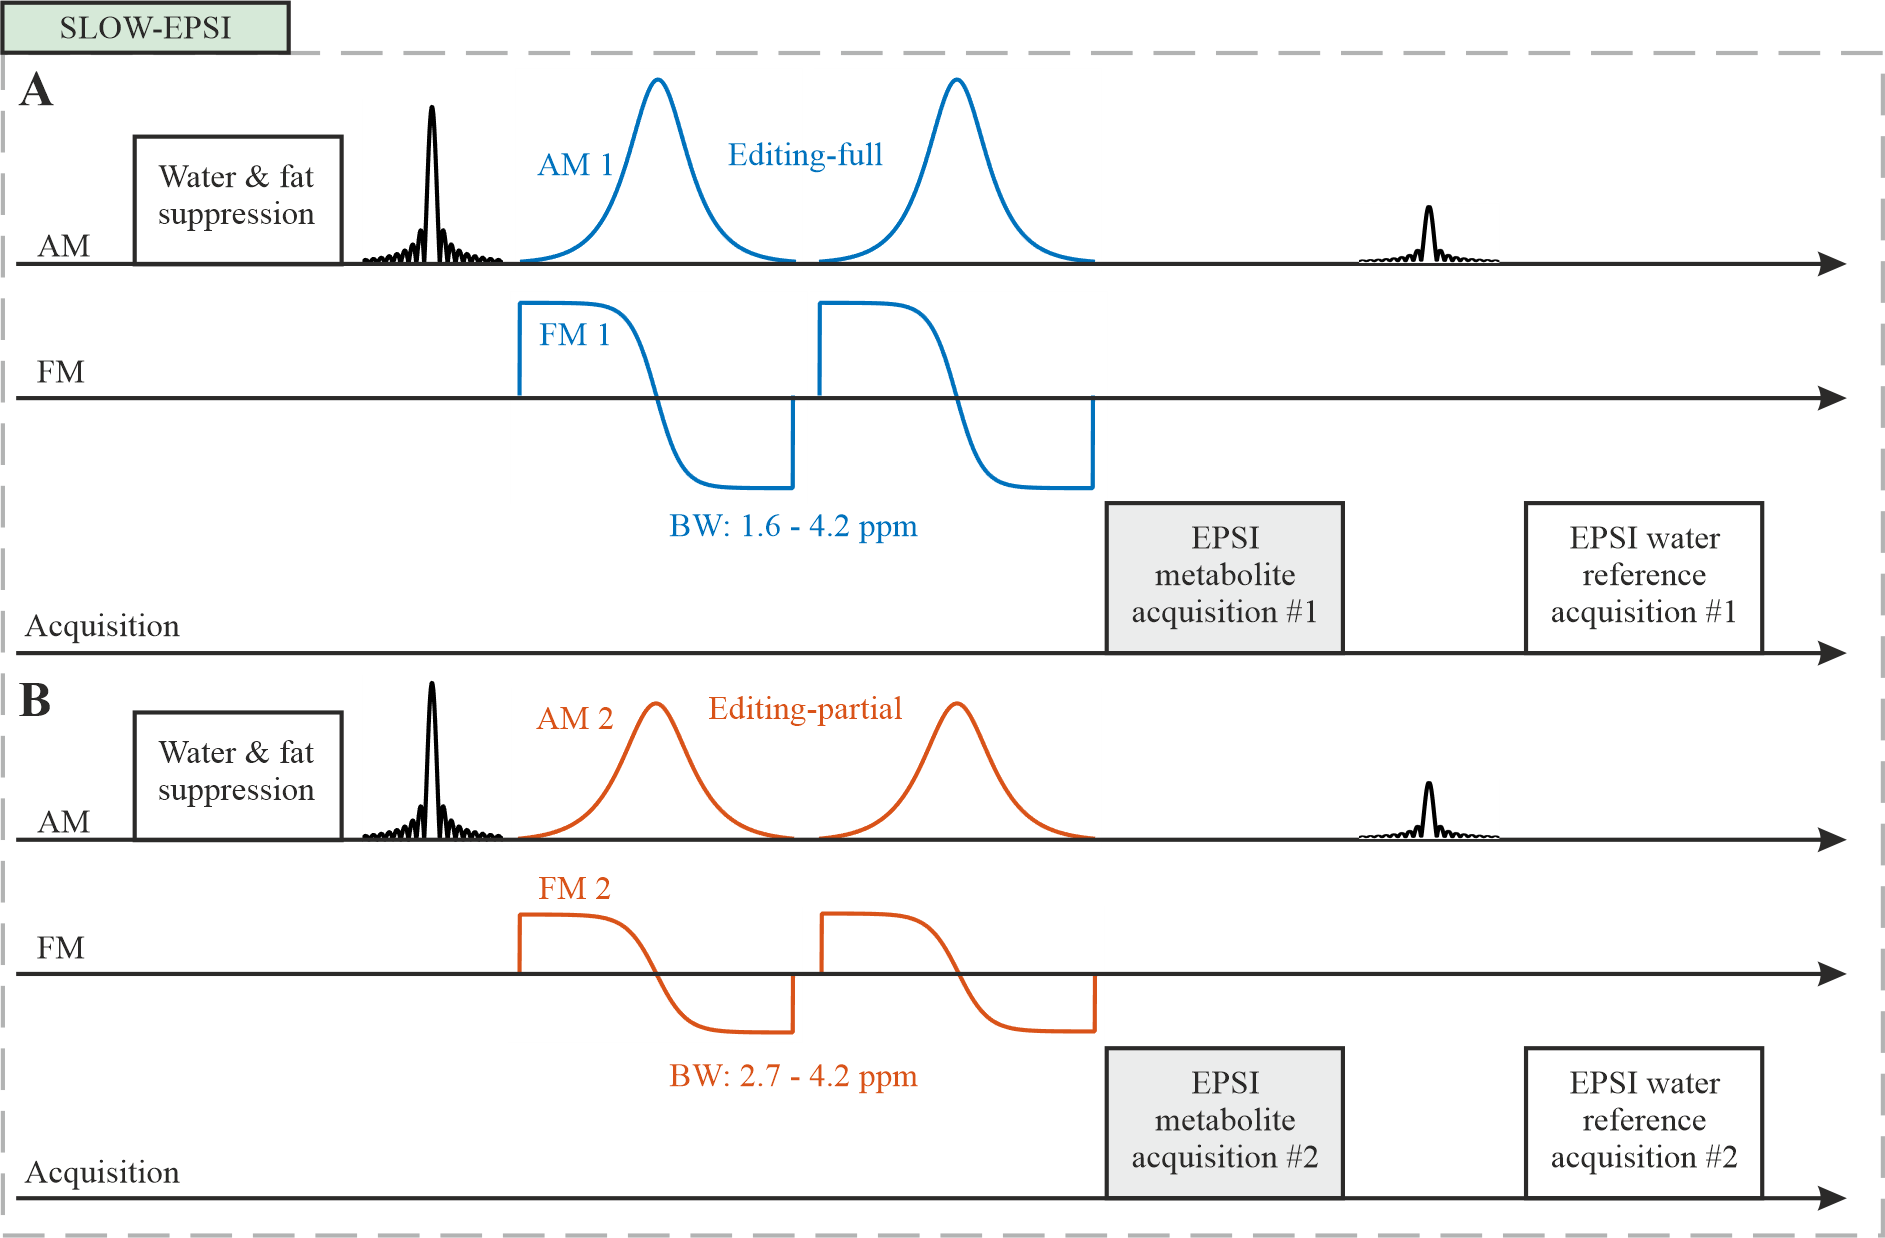
Figure 1: SLOW-EPSI sequence which makes
use of phase compensated adiabatic 2π-pulses with complex secant hyperbolic
modulation type (so called 2π-CSAP)8. A) Editing-full: the
refocusing/editing pulse BW ranges from 1.6 – 4.2 ppm. B)
Editing-partial: the refocusing/editing pulse BW ranges from 2.7 – 4.2 ppm. The
pulse duration of the 2π-CSAP pulses was 24 ms, enabling a very flat pass-band
and very steep transition bands, which simultaneously suppress water and lipid
signals as well. The results presented in this contribution used an EPSI
read-out as described by3.
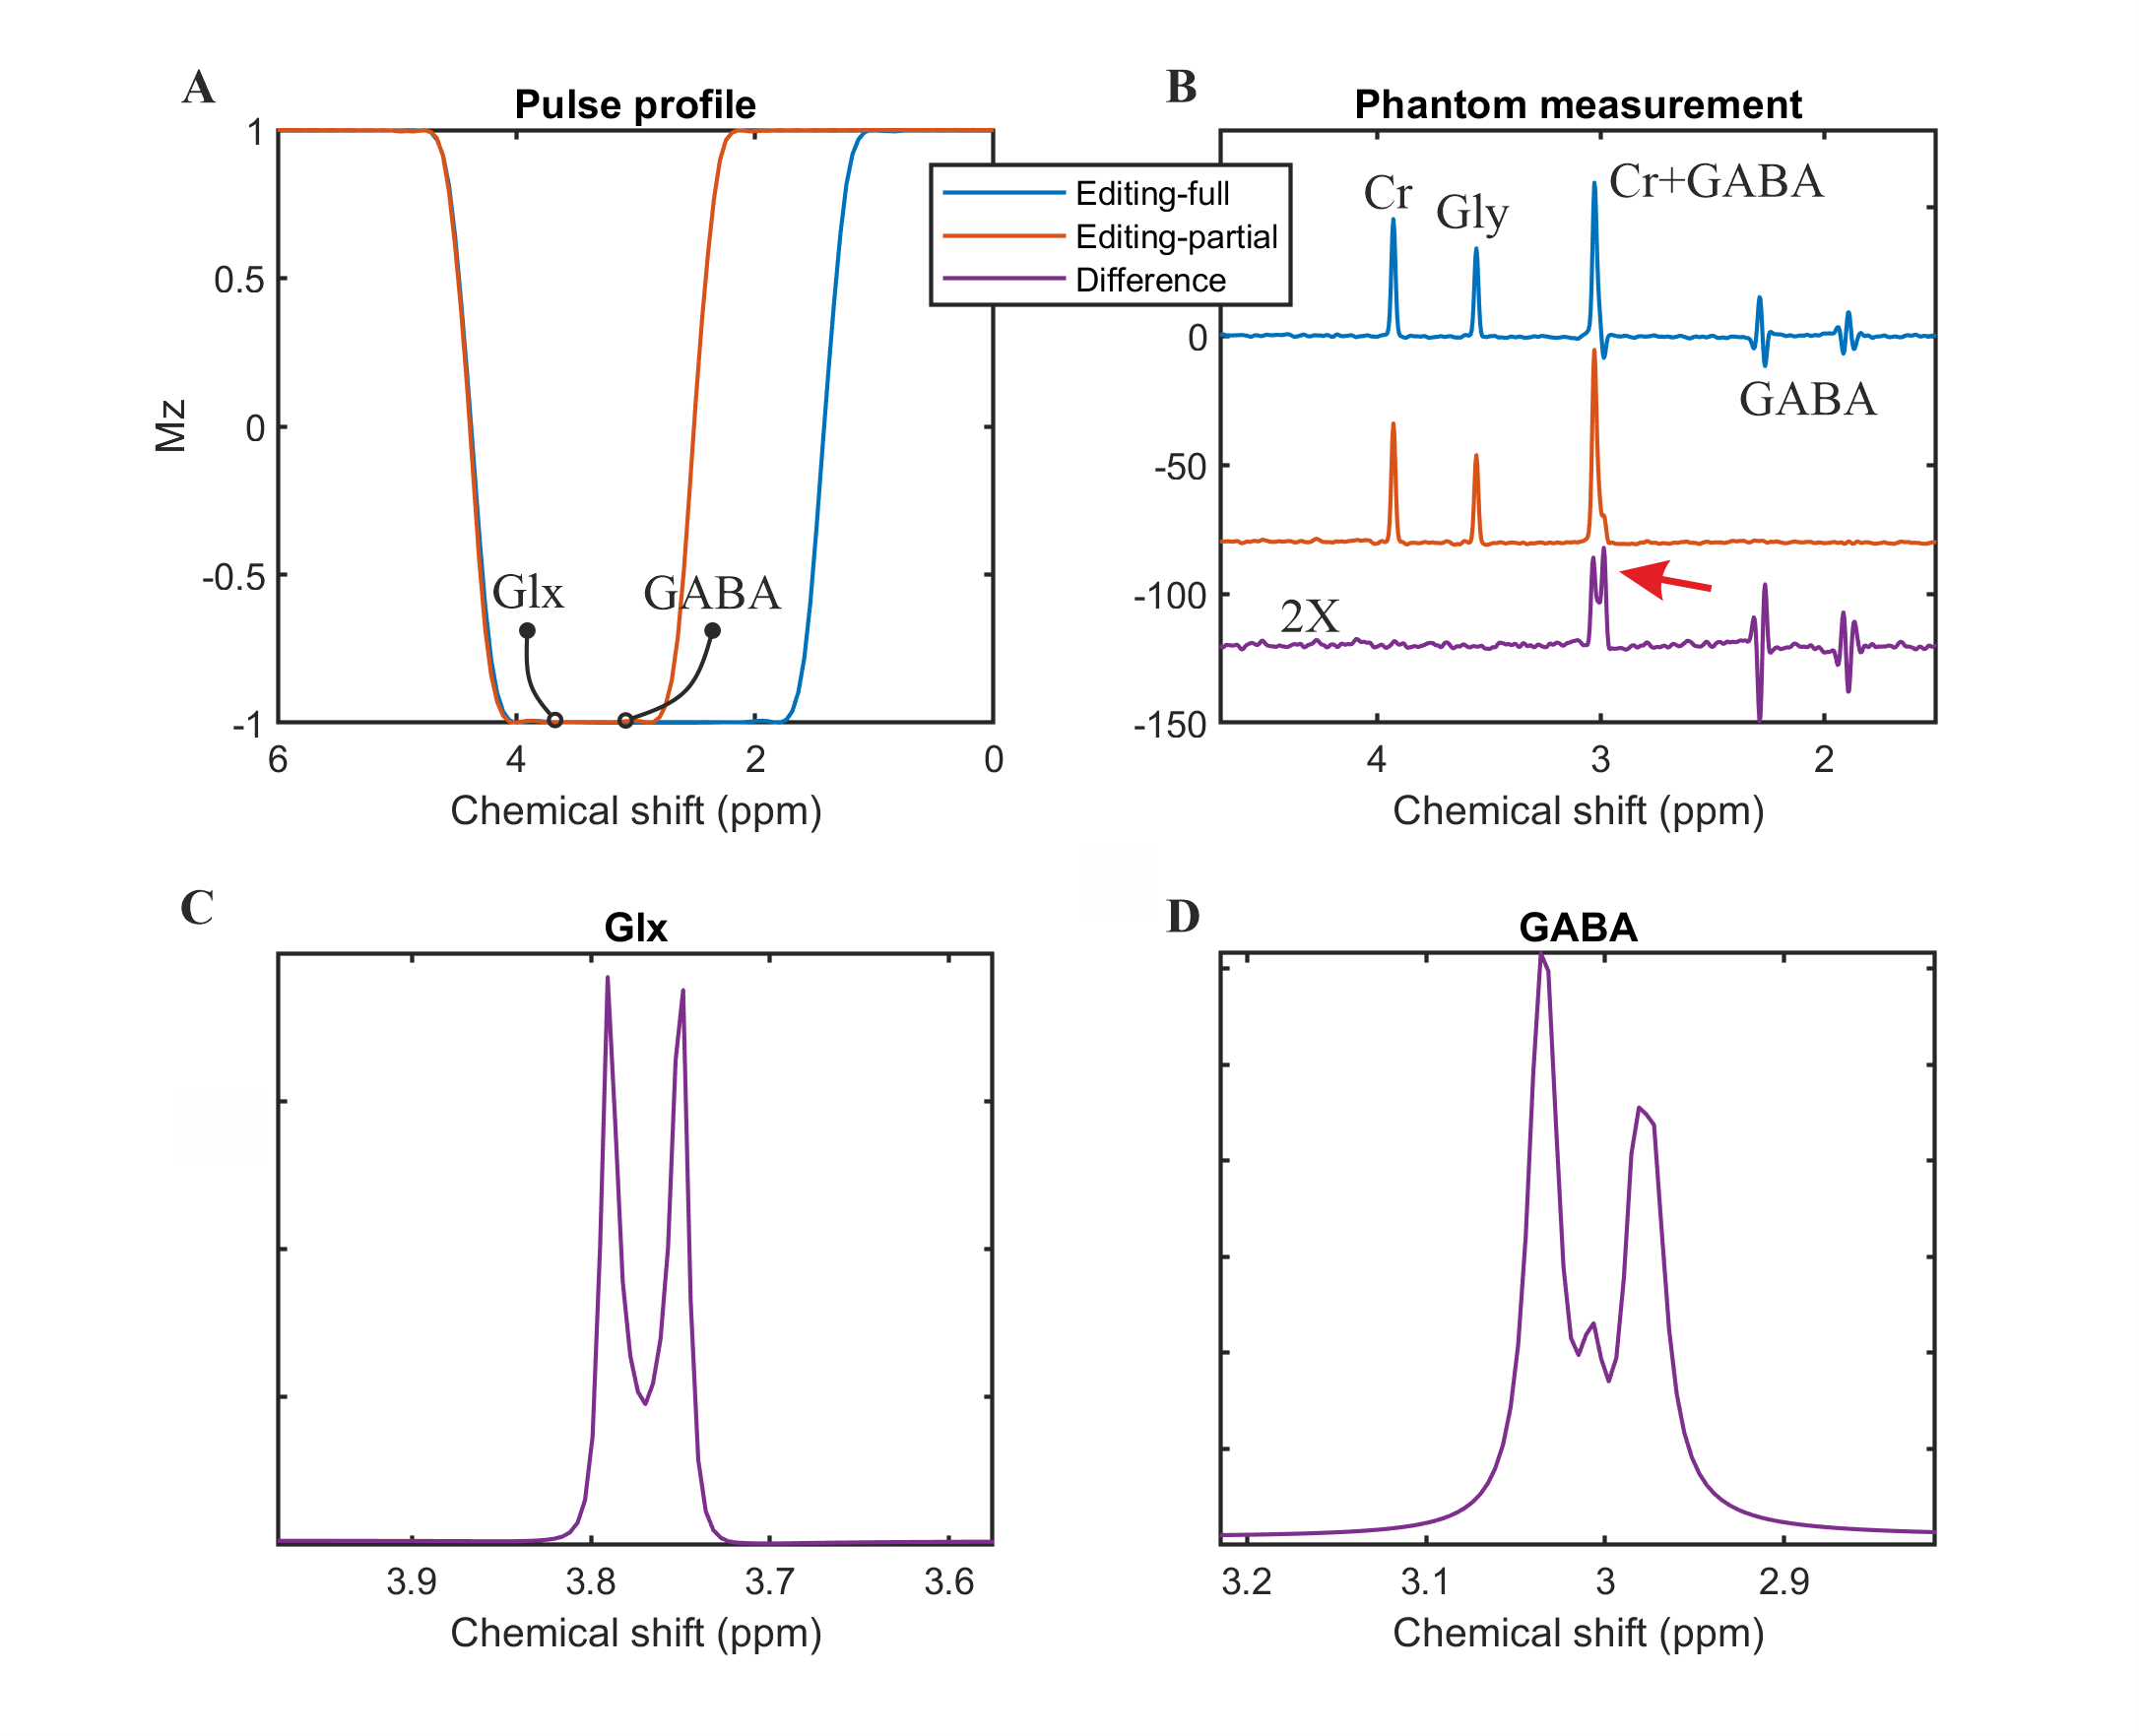
Figure 2: SLOW-editing for GABA+/GABA. A)
Pulse profiles of editing-full and -partial pulse. B) The phantom
measurement results: editing-full (blue), editing-partial (orange), and
difference (purple). C-D) The simulation of Glx (glutamate/glutamine =
2/1) and GABA under SLOW-editing, respectively. Note the striking resemblance
between simulation and phantom measurement (B, D). (TE = 68 ms, TR = 1500 ms,
matrix = 65 x 23 x 9, FOV = 280 x 100 x 70 mm, averages = 1, and TA = 9:04 min)
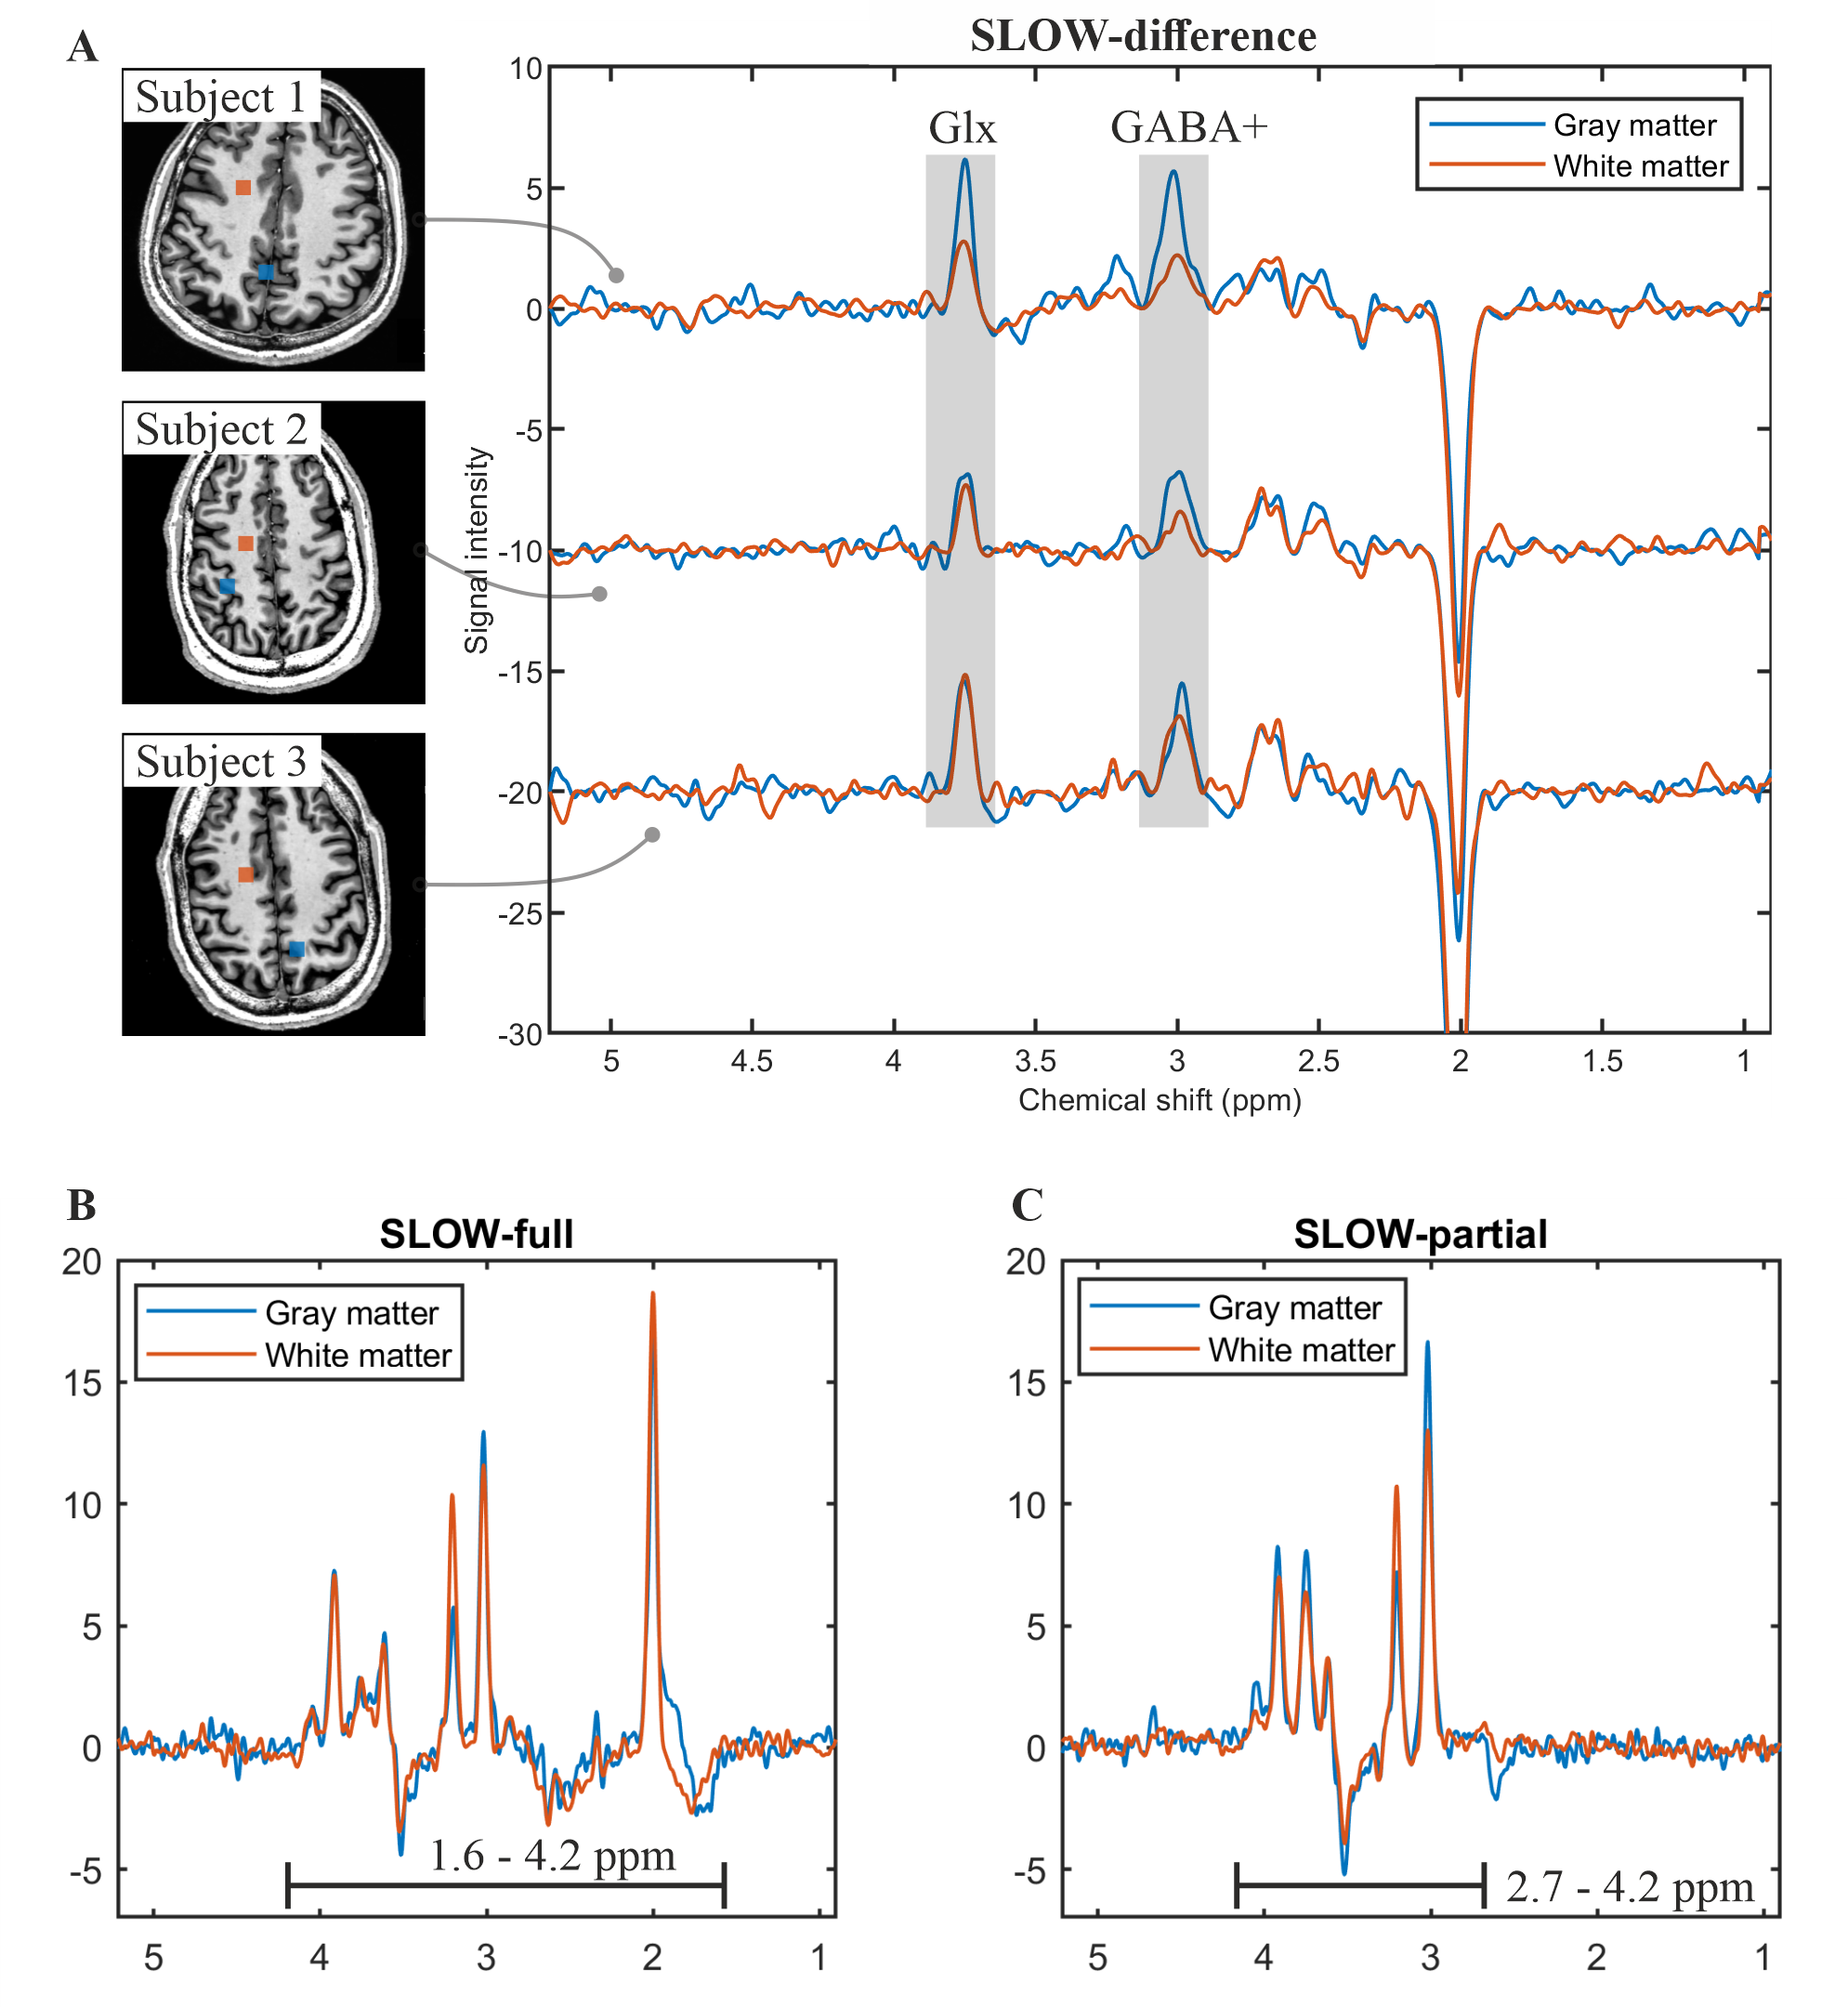
Figure 3: In vivo measurement of
SLOW-editing for GABA+. A) The spectral editing difference
(editing-partial minus editing-full) of SLOW-editing for three health subjects.
The displaced volumes (8.6 x 8.6 x 7 mm, i.e., 0.5 cm3) are
indicated by blue (gray matter) and orange (white matter) rectangular in the
MRI. B-C) The SLOW/editing-full and -partial results of subject 1,
respectively. TE = 68 ms, TR = 1500 ms, matrix = 65 x 23 x 9, FOV = 280 x 180 x
70 mm, and TA = 9:04 min.
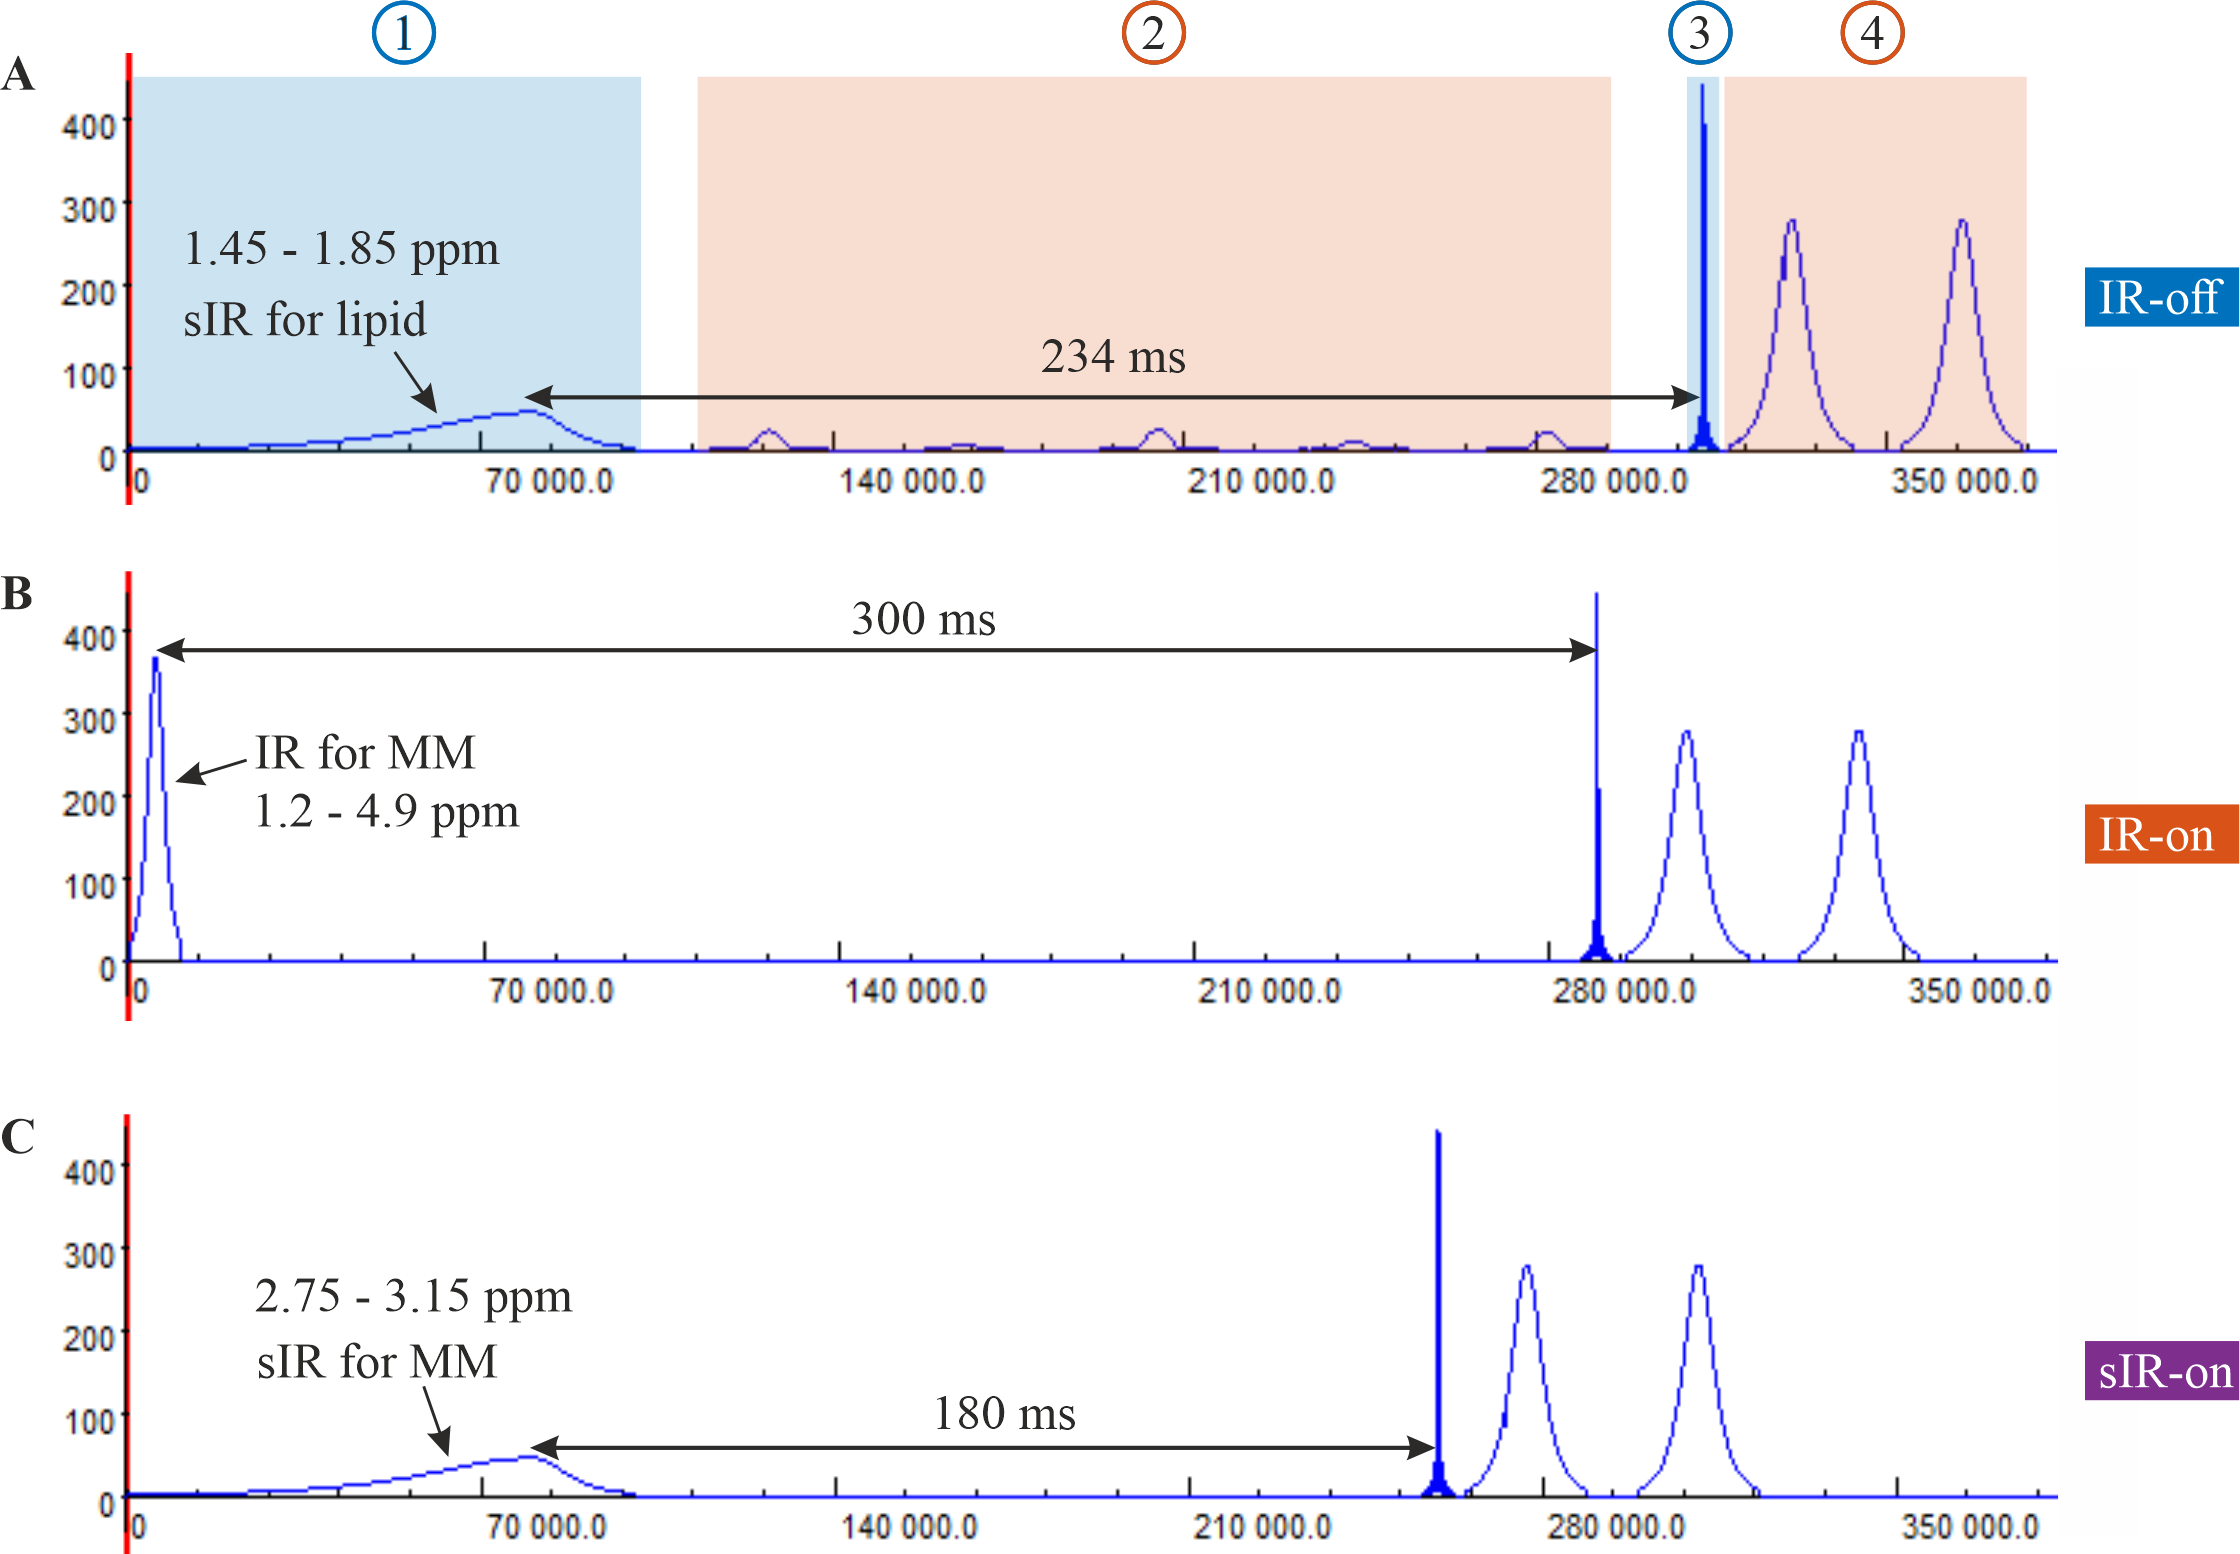
Figure 4: Pulse sequences for GABA+ and
GABA detection. A) MM suppressed IR-off pulse sequence: 1) asymmetric
adiabatic pulse for lipid suppression, 2) B1-insensitive water suppression (like the WET technique 9, but without the need of T1-insensitive
consideration), 3) sinc Gaussian excitation pulse, and 4) refocusing/editing
2π-CSAP pair. B) MM
suppressed IR-on pulse sequence: the IR pulse duration = 10 ms, BW =
1100 Hz and TI = 300 ms5. C) MM suppressed sIR-on pulse
sequence: the sIR pulse duration = 100 ms, BW = 120 Hz and TI = 180 ms.
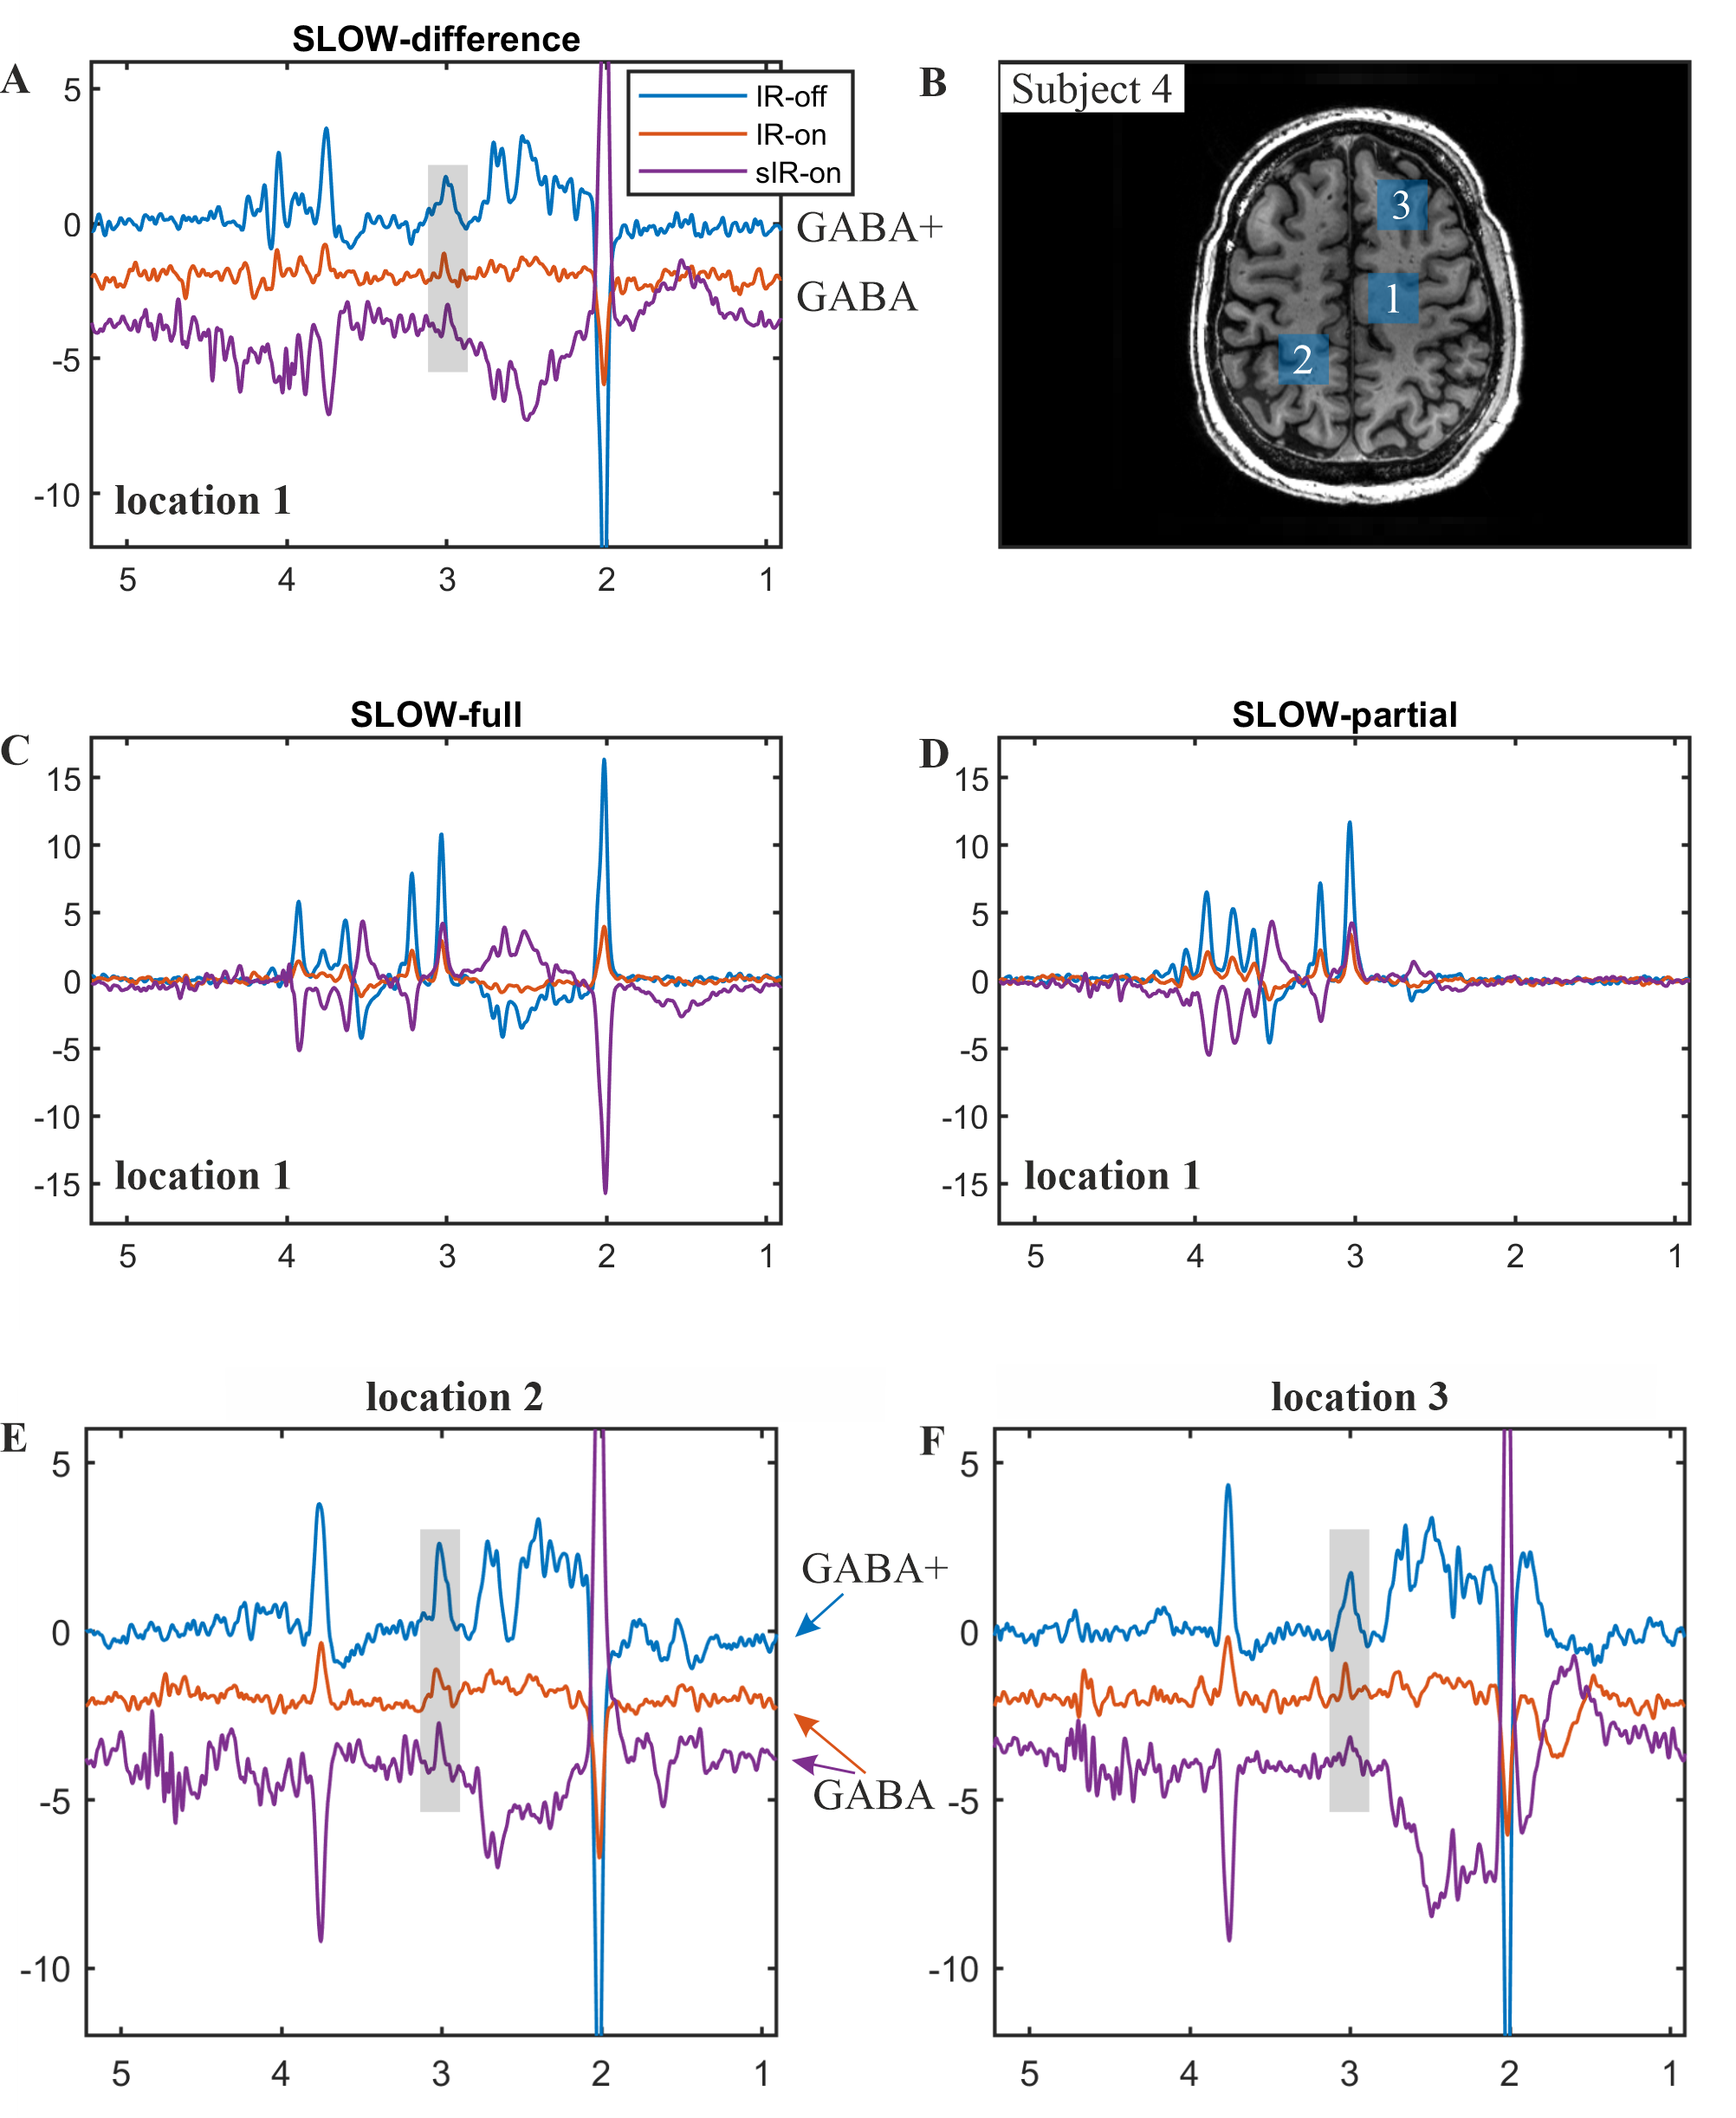
Figure 5: In vivo measurement of
SLOW-editing for GABA+ and GABA. A, E-F) The spectral editing difference
(editing-partial minus editing-full) of GABA+/GABA SLOW-editing at three
different locations (indicated in B). The sIR-on spectrum was inverted to obtain
positive GABA signal. C-D) The SLOW/editing-full and -partial results of
location 1, respectively. TE = 68 ms, TR = 1700 ms, matrix = 65 x 23 x 9, FOV =
280 x 180 x 70 mm, displaced volume = 2.15 x 2.15 x 2.1 cm (~10 cm3),
and TA = 10 min.
DOI: https://doi.org/10.58530/2022/1032