1031
Paraspinal muscles in low back pain: Comparison between standard parameters and chemical shift encoding-based water-fat MRI1Department of Radiology and Biomedical Imaging, University of California San Francisco, San Francisco, CA, United States, 2Department of Diagnostic and Interventional Radiology, University Hospital Ulm, Ulm, Germany, 3Department of Diagnostic and Interventional Neuroradiology, Technical University of Munich, Munich, Germany, 4Department of Orthopaedic Surgery, University of California San Francisco, San Francisco, CA, United States, 5Department of Epidemiology and Biostatistics, University of California San Francisco, San Francisco, CA, United States
Synopsis
Low back pain (LBP) is a global health burden, and up to 90% of affected patients are diagnosed with non-specific LBP. A structure increasingly recognized as a potential contributor to LBP is paraspinal musculature (PSM). In this study we revealed that the fat fraction (FF) of PSM derived from chemical shift encoding-based water-fat MRI (CSE-MRI) is associated with the Goutallier classification (GC) at each lumbar level as well as with self-reported pain. In contrast, other parameters (muscle volume, lumbar indentation value [LIV], muscle-fat index [MFI]) do not significantly correlate to the FF, despite being frequently used to evaluate PSM quality.
Introduction
Globally, LBP is the most common and costly musculoskeletal condition1. However, the clinical management of LBP is challenged by the fact that structural causes can be identified in just a minority of affected patients, while large numbers of patients are diagnosed with non-specific LBP2,3.A structure that is increasingly recognized as a potential contributor to LBP is PSM, but findings from imaging are inconclusive and the distinct role of PSM in LBP has not been well explored to date4,5. One potential reason is that conventional T1- and T2-weighted sequences limit analysis to mostly qualitative morphologic assessment and do not provide quantitative or objective information on PSM composition. A more robust characterization of PSM using advanced quantitative MRI could potentially help elucidate the role of PSM in LBP.
One promising technique to quantitatively and objectively assess tissue composition is CSE-MRI6,7. However, associations between the FF of PSM and parameters derived from conventional MRI remain unclear in patients with chronic LBP, obscuring our understanding of how alterations in PSM composition relate to LBP. The purpose of this study was to investigate the associations between parameters derived from conventional MRI and the FF of PSM from CSE-MRI, and to investigate which PSM parameters are associated with self-reported pain in patients with chronic LBP.
Methods
Eighty-four patients with chief complaint of chronic LBP (mean age±SD: 44.6±13.4 years, 36 females) were prospectively enrolled in this study, which was part of the Back Pain Consortium (BACPAC) Research Program, a translational effort to address the need for effective and personalized therapies for chronic LBP. Patients with disc herniation and pain on the Visual Analogue Scale (VAS) for leg pain ≥4 or ≥50% on the VAS for LBP, or a diagnosis of clinically relevant lumbar vertebral abnormalities (e.g., spondylolisthesis, spondylolysis, lumbar scoliosis) were not enrolled. Patients underwent 3-Tesla MRI of the lumbar spine, including T1-weighted FSE and iterative decomposition of water and fat with echo asymmetry and least-squares estimation (IDEAL) sequences (Table 1)7,8. IDEAL processing included phase error correction and a complex-based water-fat decomposition considering a pre-calibrated six-peak fat spectrum and a single T2*9. Axial FF maps were computed as the ratio of the fat signal over the sum of fat and water signals10.The axial T1-weighted FSE images were used to assess the GC (Figure 1)11,12 and LIV (Figure 2)11 per each spinal level (L1-S1). In addition, the co-lateral multifidus and erector spinae muscles were manually segmented13 (two consecutive slices per disc level spanning the L1-S1 levels; Figure 3) to calculate the muscle volume, FF (from IDEAL), and MFI (mean muscle signal intensity divided by mean subcutaneous fat signal intensity from T1-weighted FSE)14,15. Four randomly selected cases were segmented by four readers, and one reader performed two separate measurements in these selected patients. Mixed effects and linear regression models (adjusted for age, sex, and body mass index) were calculated to assess relationships between the different PSM parameters and with VAS scores.
Results
The FF of PSM was highest at levels L4/L5 and L5/S1 and showed excellent inter-rater (intra-class correlation coefficient [ICC]=0.92) and intra-rater agreement (ICC=0.98). The FF was statistically significantly associated with GC at all investigated levels (p<0.001 per level), but not with muscle volume, LIV, or MFI (Table 2). A subgroup analysis suggested that early and subtle changes in PSM composition are detectable with CSE-MRI but not with GC. Furthermore, averaged over all spinal levels, the FF (β coefficient: 0.09, 95%-confidence interval [95%-CI]: 0.003–0.17, p=0.042) and GC (β coefficient: 0.98, 95%-CI: 0.27–1.68, p=0.006) were statistically significantly associated with VAS scores for pain.Discussion
The FF provides a non-invasive, quantitative, and objective marker of a tissue’s relative fat content6,7,10. Recently, CSE-MRI has been applied to study the FF of PSM8,16,17, and, importantly, validated against tissue histopathology and magnetic resonance spectroscopy18,19. Yet, in chronic LBP, CSE-MRI has only been used in one small recent study to explore the FF related to pain, revealing that cartilage endplate damage at level L4/L5 was predictive of pain when adjacent to PSM that showed a high FF as a potential indicator of decreased muscle quality8. Our results indicate that in the absence of CSE-MRI (as a non-standard technique in LBP), the GC may be the most accurate method of assessing fatty infiltration of PSM, as the GC score significantly associated with the FF as well as VAS scores. Notably, subgroup analysis revealed that GC grades 0&1 were not statistically significantly associated with FF, suggesting that the GC may, however, fail to detect subtle changes at early stages of PSM degeneration. Yet, detection of such early degenerative changes in patients with chronic LBP may have important treatment implications, given that therapies targeting the PSM may provide clinical benefit and also affect other spinal pathologies8.Conclusion
In absence of CSE-MRI, GC grading may be the best and easy-to-apply measure for PSM quality. Given high sensitivity of CSE-MRI to fatty changes in the PSM and its ability to detect muscle alterations at early stages of degeneration, it may harbor great potential for further investigations of the role of PSM in chronic LBP.Acknowledgements
This research was supported by the National Institutes of Health through the NIH HEAL Initiative under award numbers U19-AR076737 and UH2-AR076719 as well as by the German Academic Exchange Service (Deutscher Akademischer Austauschdienst, DAAD: N.S.), the Joachim Herz Foundation (N.S.), and the Rolf W. Günther Foundation (N.S.).References
- Knezevic NN, Candido KD, Vlaeyen JWS, Van Zundert J, Cohen SP. Low back pain. Lancet 2021;398:78-92.
- Maher C, Underwood M, Buchbinder R. Non-specific low back pain. Lancet 2017;389:736-47.
- Koes BW, van Tulder MW, Thomas S. Diagnosis and treatment of low back pain. Bmj 2006;332:1430-4.
- Ranger TA, Cicuttini FM, Jensen TS, et al. Are the size and composition of the paraspinal muscles associated with low back pain? A systematic review. Spine J 2017;17:1729-48.
- Goubert D, Oosterwijck JV, Meeus M, Danneels L. Structural Changes of Lumbar Muscles in Non-specific Low Back Pain: A Systematic Review. Pain Physician 2016;19:E985-E1000.
- Dixon WT. Simple proton spectroscopic imaging. Radiology 1984;153:189-94.
- Reeder SB, Pineda AR, Wen Z, et al. Iterative decomposition of water and fat with echo asymmetry and least-squares estimation (IDEAL): application with fast spin-echo imaging. Magnetic resonance in medicine : official journal of the Society of Magnetic Resonance in Medicine / Society of Magnetic Resonance in Medicine 2005;54:636-44.
- Bailey JF, Fields AJ, Ballatori A, et al. The Relationship Between Endplate Pathology and Patient-reported Symptoms for Chronic Low Back Pain Depends on Lumbar Paraspinal Muscle Quality. Spine 2019;44:1010-7.
- Boehm C, Diefenbach MN, Makowski MR, Karampinos DC. Improved body quantitative susceptibility mapping by using a variable-layer single-min-cut graph-cut for field-mapping. Magnetic resonance in medicine : official journal of the Society of Magnetic Resonance in Medicine / Society of Magnetic Resonance in Medicine 2021;85:1697-712.
- Reeder SB, Hu HH, Sirlin CB. Proton density fat-fraction: a standardized MR-based biomarker of tissue fat concentration. Journal of magnetic resonance imaging : JMRI 2012;36:1011-4.
- Tamai K, Chen J, Stone M, et al. The evaluation of lumbar paraspinal muscle quantity and quality using the Goutallier classification and lumbar indentation value. European spine journal : official publication of the European Spine Society, the European Spinal Deformity Society, and the European Section of the Cervical Spine Research Society 2018;27:1005-12.
- Battaglia PJ, Maeda Y, Welk A, Hough B, Kettner N. Reliability of the Goutallier classification in quantifying muscle fatty degeneration in the lumbar multifidus using magnetic resonance imaging. J Manipulative Physiol Ther 2014;37:190-7.
- Crawford RJ, Cornwall J, Abbott R, Elliott JM. Manually defining regions of interest when quantifying paravertebral muscles fatty infiltration from axial magnetic resonance imaging: a proposed method for the lumbar spine with anatomical cross-reference. BMC Musculoskelet Disord 2017;18:25.
- D'Hooge R, Cagnie B, Crombez G, Vanderstraeten G, Dolphens M, Danneels L. Increased intramuscular fatty infiltration without differences in lumbar muscle cross-sectional area during remission of unilateral recurrent low back pain. Man Ther 2012;17:584-8.
- Goubert D, De Pauw R, Meeus M, et al. Lumbar muscle structure and function in chronic versus recurrent low back pain: a cross-sectional study. Spine J 2017;17:1285-96.
- Sollmann N, Dieckmeyer M, Schlaeger S, et al. Associations Between Lumbar Vertebral Bone Marrow and Paraspinal Muscle Fat Compositions-An Investigation by Chemical Shift Encoding-Based Water-Fat MRI. Front Endocrinol (Lausanne) 2018;9:563.
- Dieckmeyer M, Inhuber S, Schlaeger S, et al. Texture Features of Proton Density Fat Fraction Maps from Chemical Shift Encoding-Based MRI Predict Paraspinal Muscle Strength. Diagnostics (Basel) 2021;11.
- Fischer MA, Nanz D, Shimakawa A, et al. Quantification of muscle fat in patients with low back pain: comparison of multi-echo MR imaging with single-voxel MR spectroscopy. Radiology 2013;266:555-63.
- Guttsches AK, Rehmann R, Schreiner A, et al. Quantitative Muscle-MRI Correlates with Histopathology in Skeletal Muscle Biopsies. J Neuromuscul Dis 2021;8:669-78.
Figures
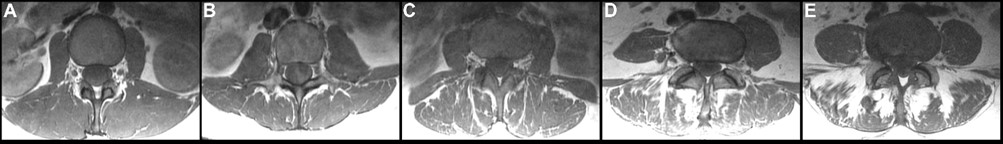
Figure 1: Goutallier classification (GC) for paraspinal musculature (PSM)
Representative axial T1-weighted FSE images for the different GC scores: 0–normal muscle (A); 1–some fatty streaks (B); 2–less than 50% fatty muscle atrophy (C); 3–50% fatty muscle atrophy (D); and 4–greater than 50% fatty muscle atrophy (E).
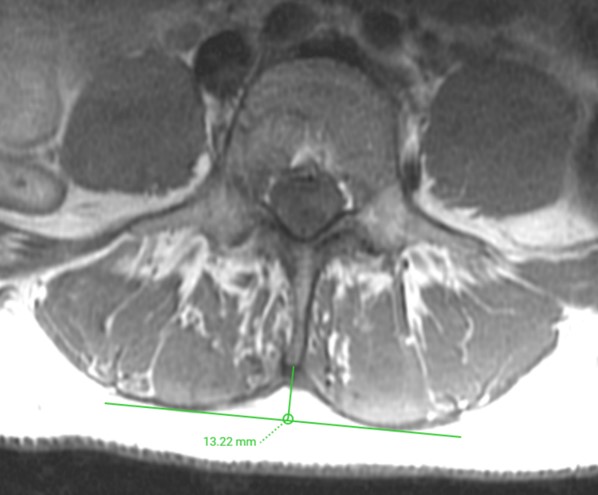
Figure 2: Determination of the lumbar indentation value (LIV)
Representative axial T1-weighted FSE images demonstrating measurement of the LIV at the level of L3/L4, which amounted to 13.22 mm. The LIV is measured as the distance equal to the length of the bulge of the muscle to the attachment of the spinous process.
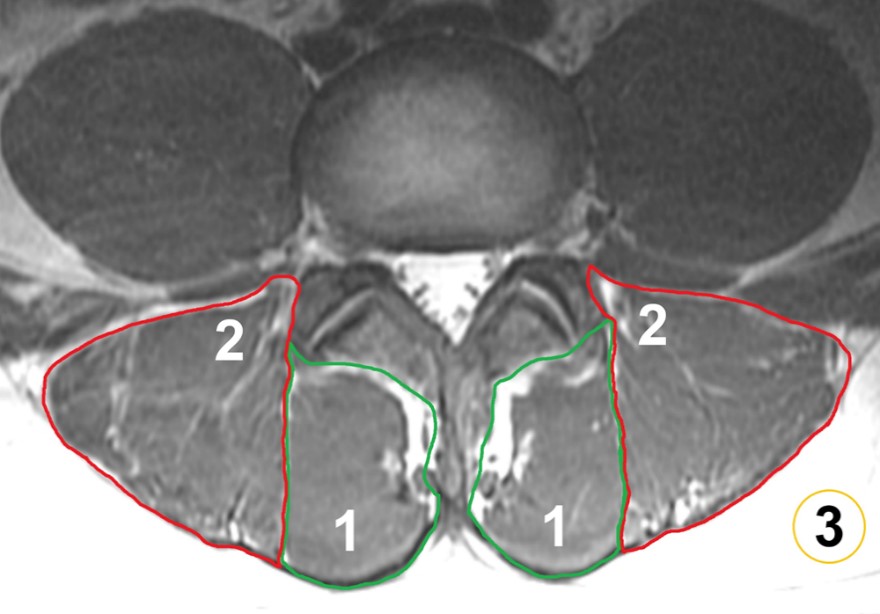
Figure 3: Segmentation of paraspinal musculature (PSM) and subcutaneous fat
Segmentations of the multifidus muscles (1), erector spinae muscles (2), and subcutaneous fat (3). The segmentations of the multifidus and erector spinae muscles were used for extraction of the level-wise fat fraction (FF) of PSM (using IDEAL) and to calculate the muscle-fat index (MFI) as the mean signal intensity of PSM divided by the mean signal intensity of homogeneous subcutaneous fat (using T1-weighted FSE sequences).

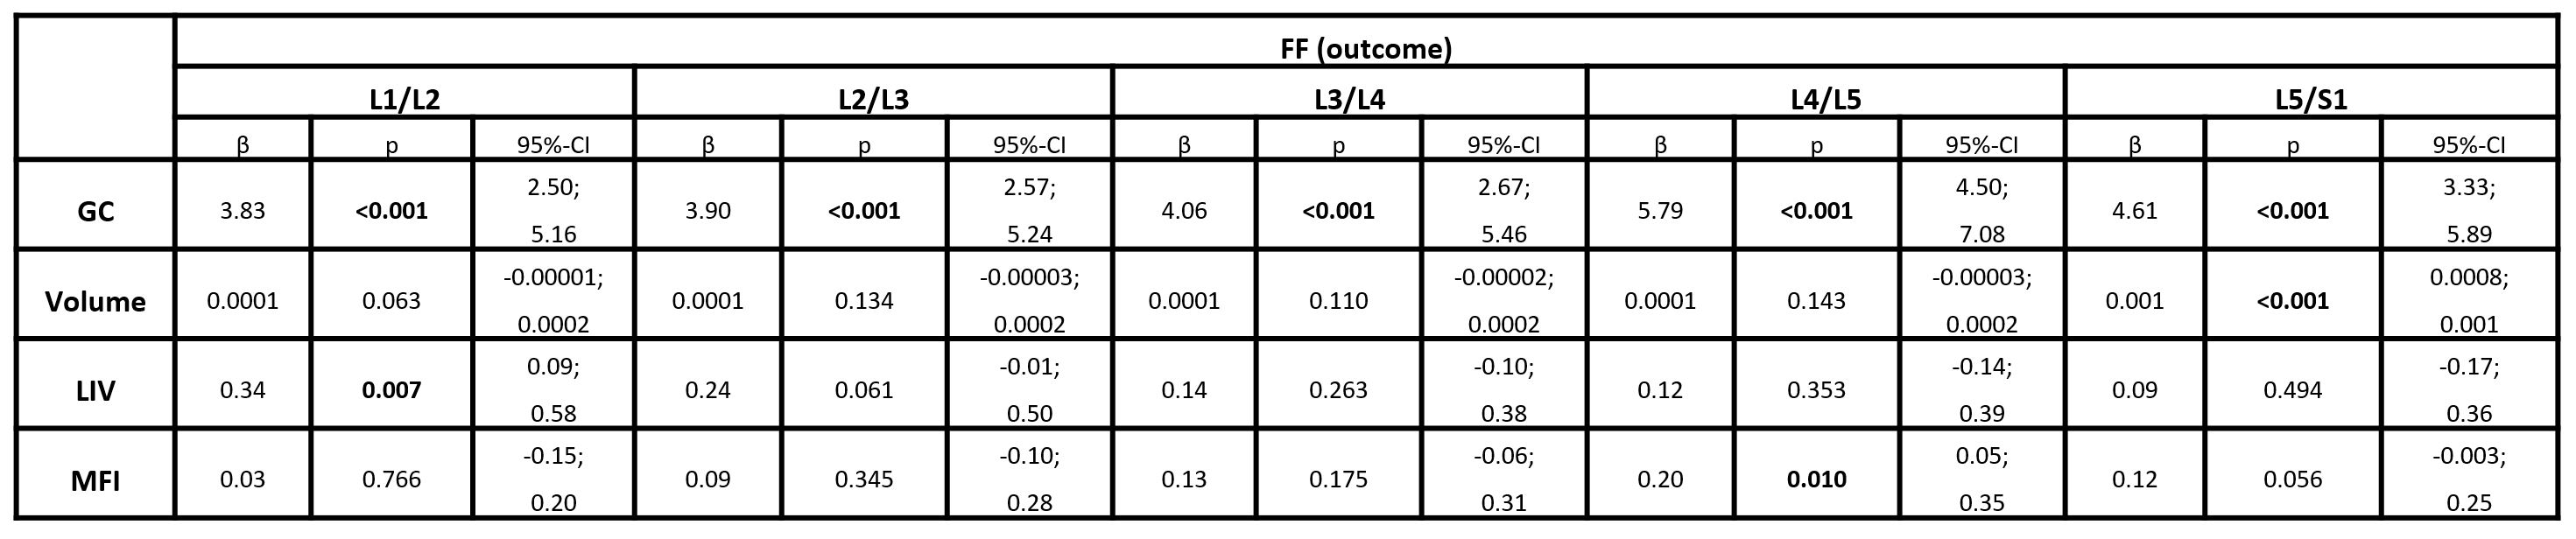
Table 2: Associations between the fat fraction (FF) of paraspinal musculature (PSM) and standard parameters
This table lists the β coefficients, p-values, and 95%-confidence intervals (95%-CIs) for the associations between the FF and the Goutallier classification (GC), muscle volume, lumbar indentation value (LIV), and muscle-fat index (MFI) by spinal level (mixed-effects regression models adjusted for age, sex, and body mass index).