1030
Assessing Semi-Automatic processing of Muscle Mass and Fat Fractions from mDIXON whole body MRI
Rosemary Nicholas1, Paul Greenhaff1, and Susan Francis1
1UNIVERSITY OF NOTTINGHAM, Nottingham, United Kingdom
1UNIVERSITY OF NOTTINGHAM, Nottingham, United Kingdom
Synopsis
Muscle volume and fat fraction can be quantified from mDIXON scans either manually or using automated processes. Here we compare manual volumes of thigh and calf muscle ROIs with an automated pipeline created using FSL’s FAST segmentation, to compare muscle volume and fat fraction across subject groups and with their DXA values. Automatic volume segmentations correlated highly with manually drawn measures (r=.975) as well as DXA (r=0.840). Group comparisons show COPD and post-COVID patients had significantly lower muscle mass and higher fat fraction. Automatic segmentation performs well compared to manually derived volumes and is more time efficient.
Introduction
Skeletal muscle atrophy is common in ageing and various pathologies. A DXA scan is currently the most commonly used measure to quantify lean mass. MRI provides more detailed analysis and flexibility in the approach to the data. Here we quantify muscle volume and fat fractions in the thigh and calf of the lower limb using automated analysis of mDIXON images. We compare results to quantify muscle volume and fat fraction between highly active volunteers and participant groups who experience fatigue, including COPD and COVID-19.Methods
Data were collected in healthy volunteers (n=16), a highly physically active older group (n=9), patients with Chronic Obstructive Pulmonary Disease (COPD) (n=10) or Inflammatory Bowel Disease (IBD) (n=12), patients in Post-COVID recovery (n=21,) and patients diagnosed as Pre-Frail (n=3), Table 1. Whole body mDIXON Quant data were collected on a Philips 3T Ingenia. mDIXON scans were collected coronally in 6 stacks using a six-echo 3D gradient echo sequence with a flip angle of 3o, Repetition Time (TR) 10 ms, initial echo time (TE1) 0.95 ms and echo spacing (ΔTE) 0.7 ms, reconstructed to 3 mm slice thickness with pixel size of either 1.9231×1.9231 mm2 (or 1.7241×1.7241 mm2 in the COPD scans). An automatic pipeline was developed using FSL (FMRIB Software Library) FAST to extract all muscles on the mDIXON scan within the calf and thigh (Fig.1). First, a crop around the limb was performed on the images to establish a smaller area of interest. This cropped region was then fed into FAST to segment three tissue types. The segmentation was then cleaned of any extraneous regions with a perimeter removal and an Euclidian distance transform, and the fat fraction map was used to remove high intensity fat regions. From this, muscle volume and fat fraction within the muscle was extracted. Manual ROIs were drawn using Horos by a single rater on all data sets (except the 3 Pre-Frail), and two raters segmented the COPD subset. Raters segmented the muscle tissue on coronal slices, every 5 slices (Fig.2). Volume measures for the whole calf/thigh was estimated by interpolating muscle area in the missing slices. Dice coefficients were run on the manually derived regions of interest and their corresponding automatically derived slices.Results
Interrater correlations on the manually drawn masks was good, r(42) = 0.992, p<.001 (Fig.3a), a T-Test showed that Rater 1 yielding higher muscle mass than Rater 2 (p<.001) (Fig.2). On comparison the manually masks in the subset of volunteers that also had DXA scans showed a good correlation, r(30) = 0.942, p<.001 (Fig.3b), with automatic segmentations correlations being slightly lower r(40) = 0.840, p<.001 (Fig.3d). The automatic segmentation was compared with manually derived volumes for each limb (right and left for calf and thigh) of 35 participants and highly correlated, r(140) = 0.975, p<0.001 (Fig.3c and Fig.2). The weighted mean Dice value was 0.831±.047 for the calf and 0.821±.042 for the thigh.Comparing results across participant groups, automatically segmented lower limb muscle volumes (normalised for body surface area (BSA)) revealed significant differences between groups when co-varying for age and gender in the calf, (F(7,62) = 8.585, p<0.001), and thigh ((F(7,59) = 3.377, p<0.01) (Fig.4a). Bonferroni corrected pairwise tests showed the COPD group had significantly lower calf and thigh muscle mass than the Post-COVID (p<.001 and p<.05) and older active groups (p<.005 and p<.01), and lower calf mass than healthy volunteers (p<.005). The IBD group also had significantly lower muscle mass than the Post-COVID group in the calf, p<.01. Fat fraction values were found to be significantly different in the calf and the thigh (F(7,62) = 5.347, p<.001 and F(7, 59) = 4.272, p<.005) Fig.4b. The older active group had significantly lower fat fraction than the COPD group (p<.001) in the thigh, and strong trend for differences in the calf (p=0.52). In the Post-COVID group, the older active group had significantly lower fat fraction in the calf (p<.001) and strong trend level differences in the thigh (p=.06). The Post-COVD group also had higher fat fraction values than the healthy volunteers at trend level (p=0.57).
Discussion
The proposed automatic segmentation method allows for rapid analysis and greater consistency between raters. While correlations were high between raters, absolute values differed due to inclusion versus exclusion of intermuscular spaces when drawing around muscle groups. The automatic method removes manual choices to improve consistency across raters. Methodological differences are expected to yield somewhat different final muscle masks and there for differences in volume and Dice coefficients , as the automatic segmentation tends to exclude more areas that are muscle that could not be excluded in the manual drawing without highly detailed, precise, drawing. DXA values are not separated into smaller sections and are a single value for the lower limb including hips and glutes, also accounting for some discrepancy.Conclusion
Automatic segmentation provides more consistent results than manual, as well as being much less labour intensive.Acknowledgements
No acknowledgement found.References
No reference found.Figures
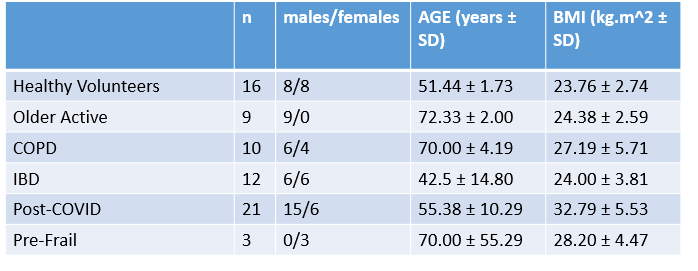
Table 1: Participant demographics
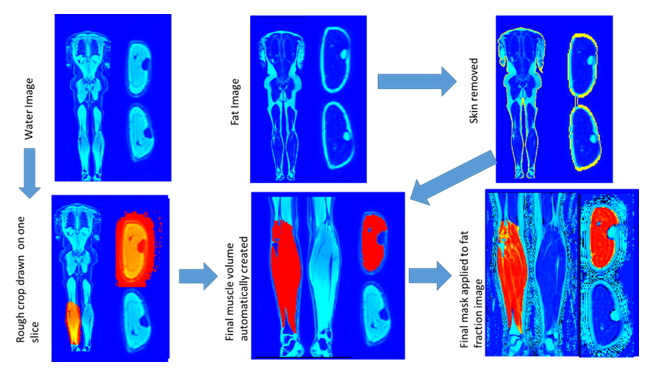
Figure 1: Automatic segmentation
pipeline, showing stitched water image cropped to rough area then fed through
FSL’s FAST and refined using a combination of Euclidian distance transforms and
the fat map to create a final muscle mask and derive fat fractions
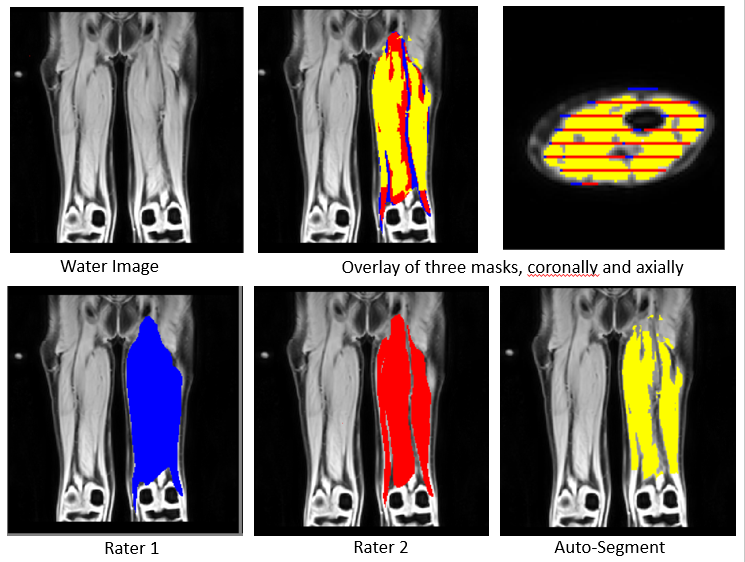
Figure 2: Example images of thigh muscle
volume masks created by: two separate manual raters (bottom left) or
auto-segmentation (bottom right). The
overlay of all three is visible in the top middle and right, where the slices
selected for manual drawing are also visible.
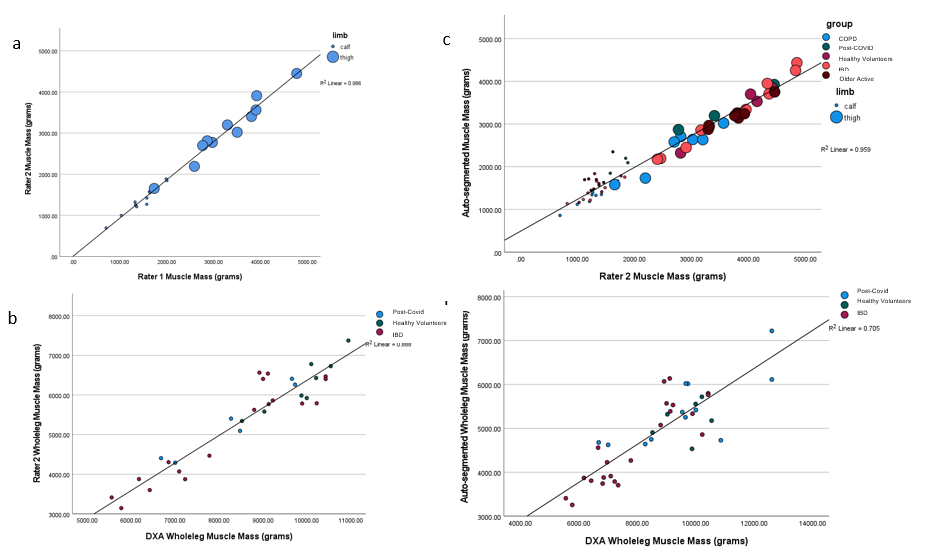
Figure 3: Comparisons of muscle mass
assessments. A) Interrater correlations
on manually
drawn
segments,
r(42) =
0.992, p<.001. B) Manually segmented versus DXA scans r(30)
= 0.942, p<.001. C) The final volumes calculated in the
automatic segmentation compared in each limb with manually derived volumes,
r(140) = 0.975, p<0.001. D) Automatic
segmentations
versus
DXA, r(40)
= 0.840, p<.001.
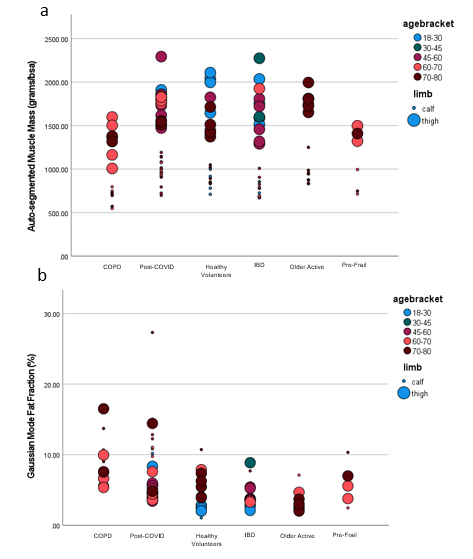
Figure
4: A) BSA-corrected Automatic
segmentations across groups and age bracket, in calf and thigh. COPD calf and thigh muscle mass less than
Post-COVID and older active groups, and lower calf mass than healthy
volunteers. IBD muscle mass less than Post-COVID in calf. B) Gaussian derived fat fraction values
across groups, in calf and thigh. Older
active fat fraction lower than COPD in thigh, and calf*. Post-COVID fat fraction higher than older
active in calf and thigh*. Post-COVD fat
fraction higher than healthy volunteers*.
*Indicates trend level, all others significant.
DOI: https://doi.org/10.58530/2022/1030