1029
Multi-modal MR in the upper arm muscles of patients with Spinal Muscular Atrophy1Department of Radiology and Nuclear Medicine, Amsterdam Movement Sciences, Amsterdam University Medical Center, Amsterdam, Netherlands, 2Center for Child Development, Exercise and Physical Literacy, Wilhelmina Children’s Hospital, University Medical Center Utrecht, Utrecht, Netherlands, 3Department of Radiology, University Medical Center Utrecht, Utrecht, Netherlands, 4Department of Biomedical Engineering & Physics, Amsterdam Movement Sciences, Amsterdam University Medical Center, Amsterdam, Netherlands, 5Department of Neurology and Neurosurgery, UMC Utrecht Brain Center, University Medical Center Utrecht, Utrecht, Netherlands
Synopsis
With upcoming therapeutic developments, quantitative MR is increasingly used to assess disease state and progression in neuromuscular disorders, including SMA. Yet, little is known about the disease state in the arm muscles in SMA. A multi-modal MR approach was used to examine fat fraction (FF), T2-relaxation time and diffusion properties, in the arm muscles of SMA patients and controls. Our results showed higher FF in the arm muscles of SMA patients which were negatively associated with the level of muscle strength. No clear changes were observed for qT2 while diffusion indices showed potential for mapping changes in muscle tissue itself.
Introduction
Spinal Muscular Atrophy (SMA) is characterized by loss/degeneration of motor neurons resulting in proximal muscle weakness, muscle atrophy and eventually the progressive replacement of muscle tissue by fat1-3. An increasing number of genetic therapies that increase cellular SMN protein levels have obtained market authorization4-5. With these available strategies and upcoming therapeutic developments, objective and quantitative outcome measures are of increasing importance6. Quantitative Magnetic Resonance Imaging (qMRI) is frequently used to map disease state and disease progression in lower-extremity muscles of patients with SMA7-9. This is in stark contrast with the almost complete lack of data on the upper-extremity muscles which are essential for meaningful activities of daily living and remain preserved longer over time compared to leg muscles10-11. The aim of this study was therefore to assess disease state in upper-arm muscles of patients with SMA in comparison to controls by quantitative assessment of fat fraction, diffusion indices and water T2 relaxation times and to relate these measures to maximal voluntary muscle force.Methods
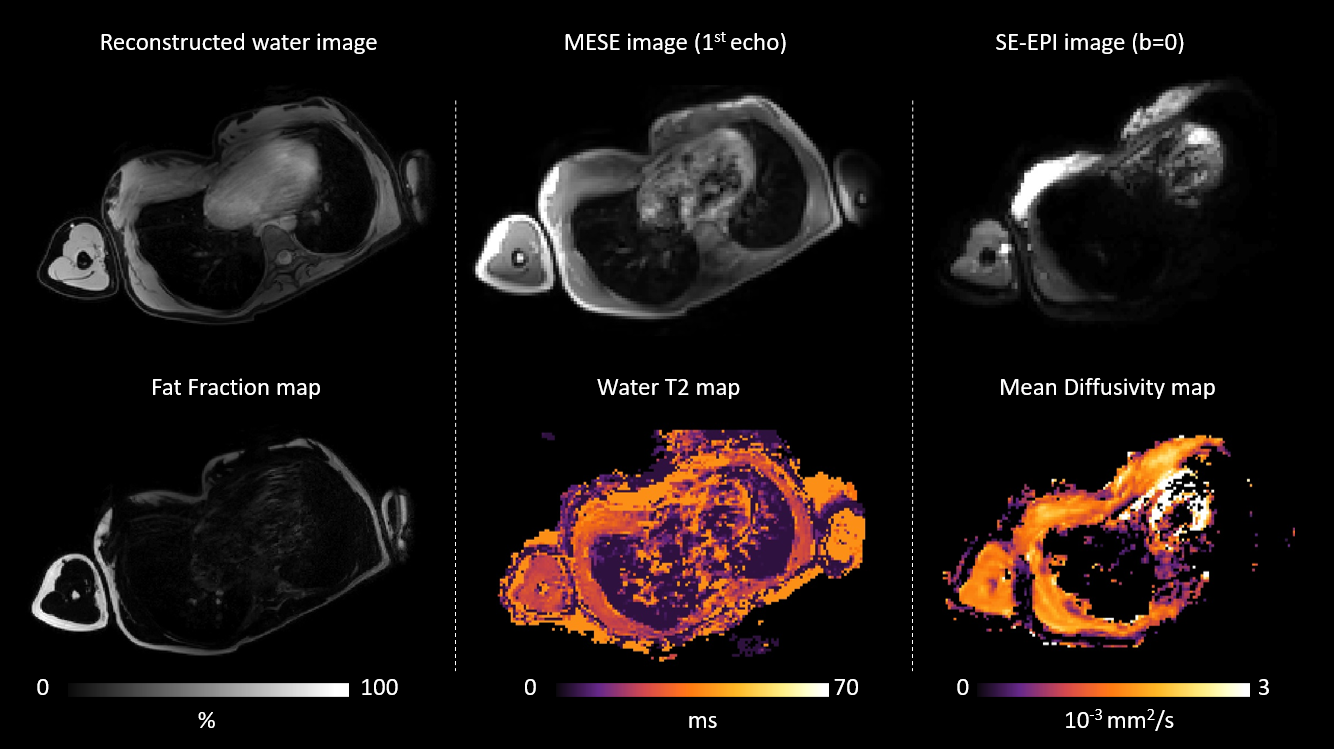
MRI datasets were acquired in the upper arm of 13 SMA patients (age: 40.2 ±16.02 years; m/f:5/8; subtype 3a, 3b and 4) and 15 controls (age: 41.9±17.1 years; m/f:6/9) on a 3 Tesla MR System (Philips, Ingenia, Best, The Netherlands) using a 16-element anterior coil. The protocol consisted of a diffusion weighted sequence (SE-EPI; TR/TE 6600/57ms; b-values: 0(1), 1(8), 5(3), 10(3), 20(3), 50(3), 100(3), 200(10), 400(10), 600(12) s/mm2; voxel size 3x3x6mm; 33 slices; SSGR, SPAIR and selective suppression of the olefinic fat) to estimate diffusion indices, a 4-point Dixon (TR/TE/∆TE 210/2.3/0.76; voxel size 1.5x1.5x6mm; 33 slices) for fat quantification and a multi-echo spin-echo (MESE) sequence (17echoes; TR/TE/∆TE 4000/7.6/7.6ms; voxel size 3x3x6mm; gap 6mm; 17 slices) to measure water T2 relaxation times. Prior to MR examination maximal voluntary contraction force (MVCF) was measured with a handheld dynamometer in the Biceps Brachii (BB), Brachialis (BR) and Triceps Brachii (TB) muscle.Data-analysis
MR datasets were processed using QMRITools (https://github.com/mfroeling/QMRITools). Fat fraction (FF) maps were reconstructed using IDEAL with a 8-peak fat model11,12. Diffusion data were denoised, registered to correct for motion and eddy currents13. The eigenvalues were estimated using an Intra Voxel Incoherent Motion (IVIM) based iWLLS algorithm and Mean Diffusivity (MD) and Fractional Anisotropy (FA) were obtained14. T2 relaxation time (qT2) maps were calculated using an EPG algorithm15. All outcome parameters were determined in the ROIs drawn for the individual muscles and reported as their mean value over the full segmented volume. Additionally, the three upper arm muscles were divided into a distal, middle and proximal segment (according to an equal number of slices) to assess any potential differences in fat fraction within the individual muscles. Differences between groups and muscle segments were assessed using a Mann-Whitney U test (p≤0.0071; 7 measures; 0.05/7=0.0071). In addition, in the SMA patients, the relation between MVCF and FF, qT2, MD and FA was explored using Kendall tau’s correlation (p≤0.05).Results
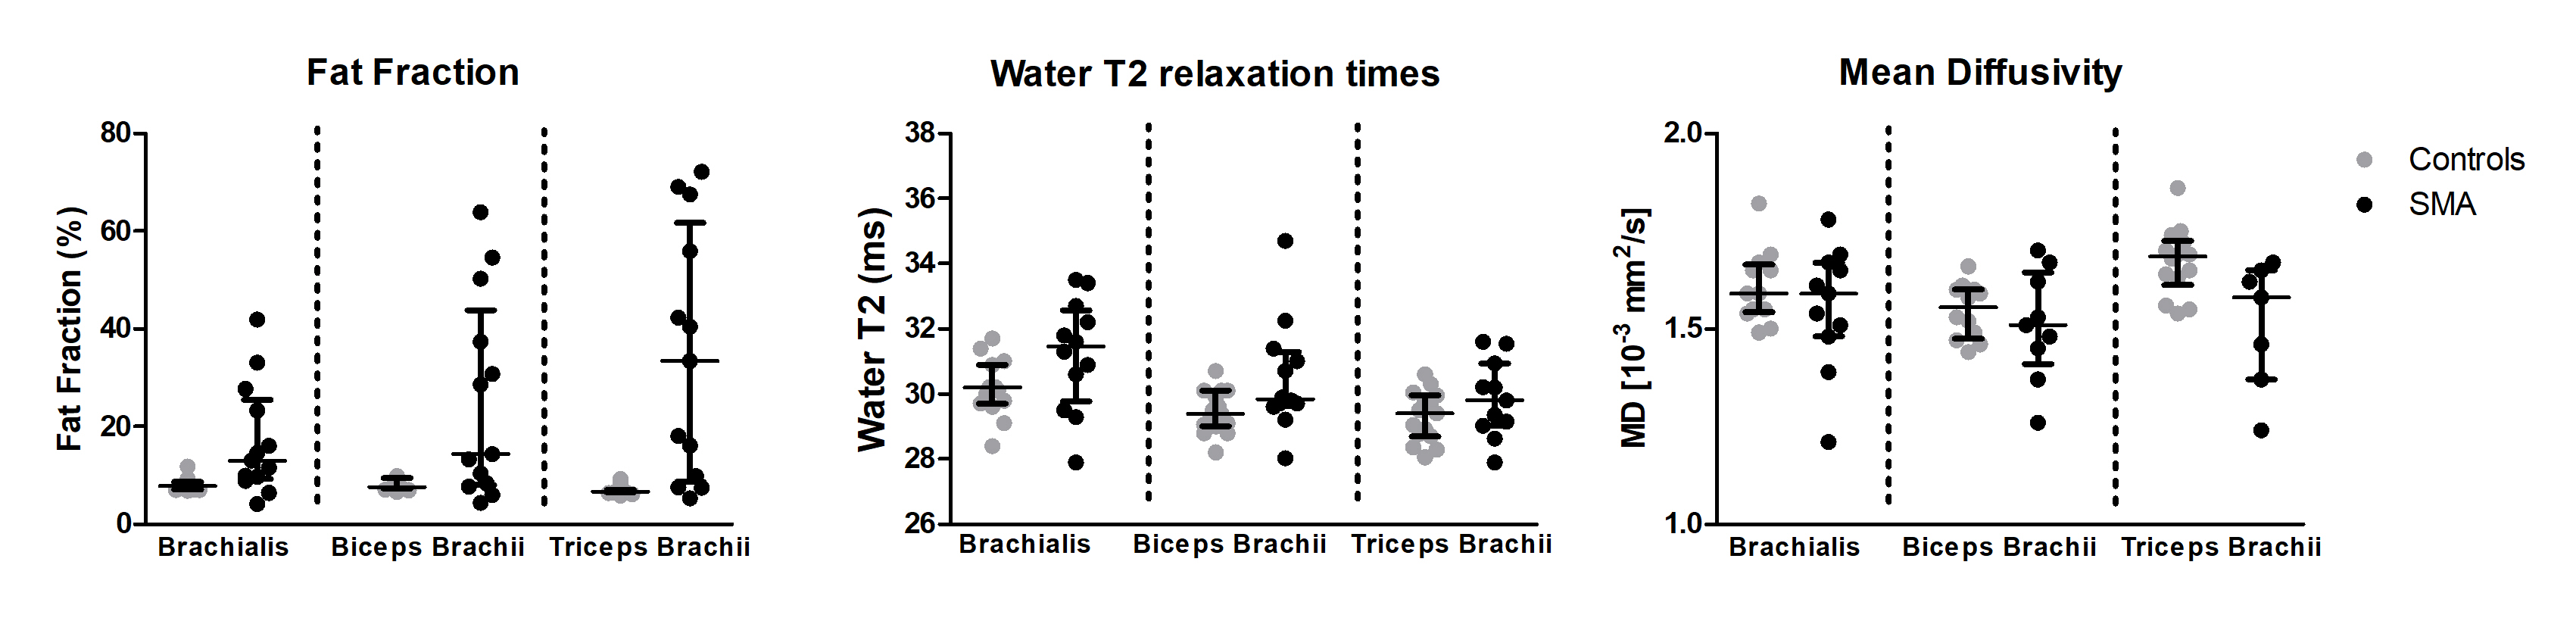
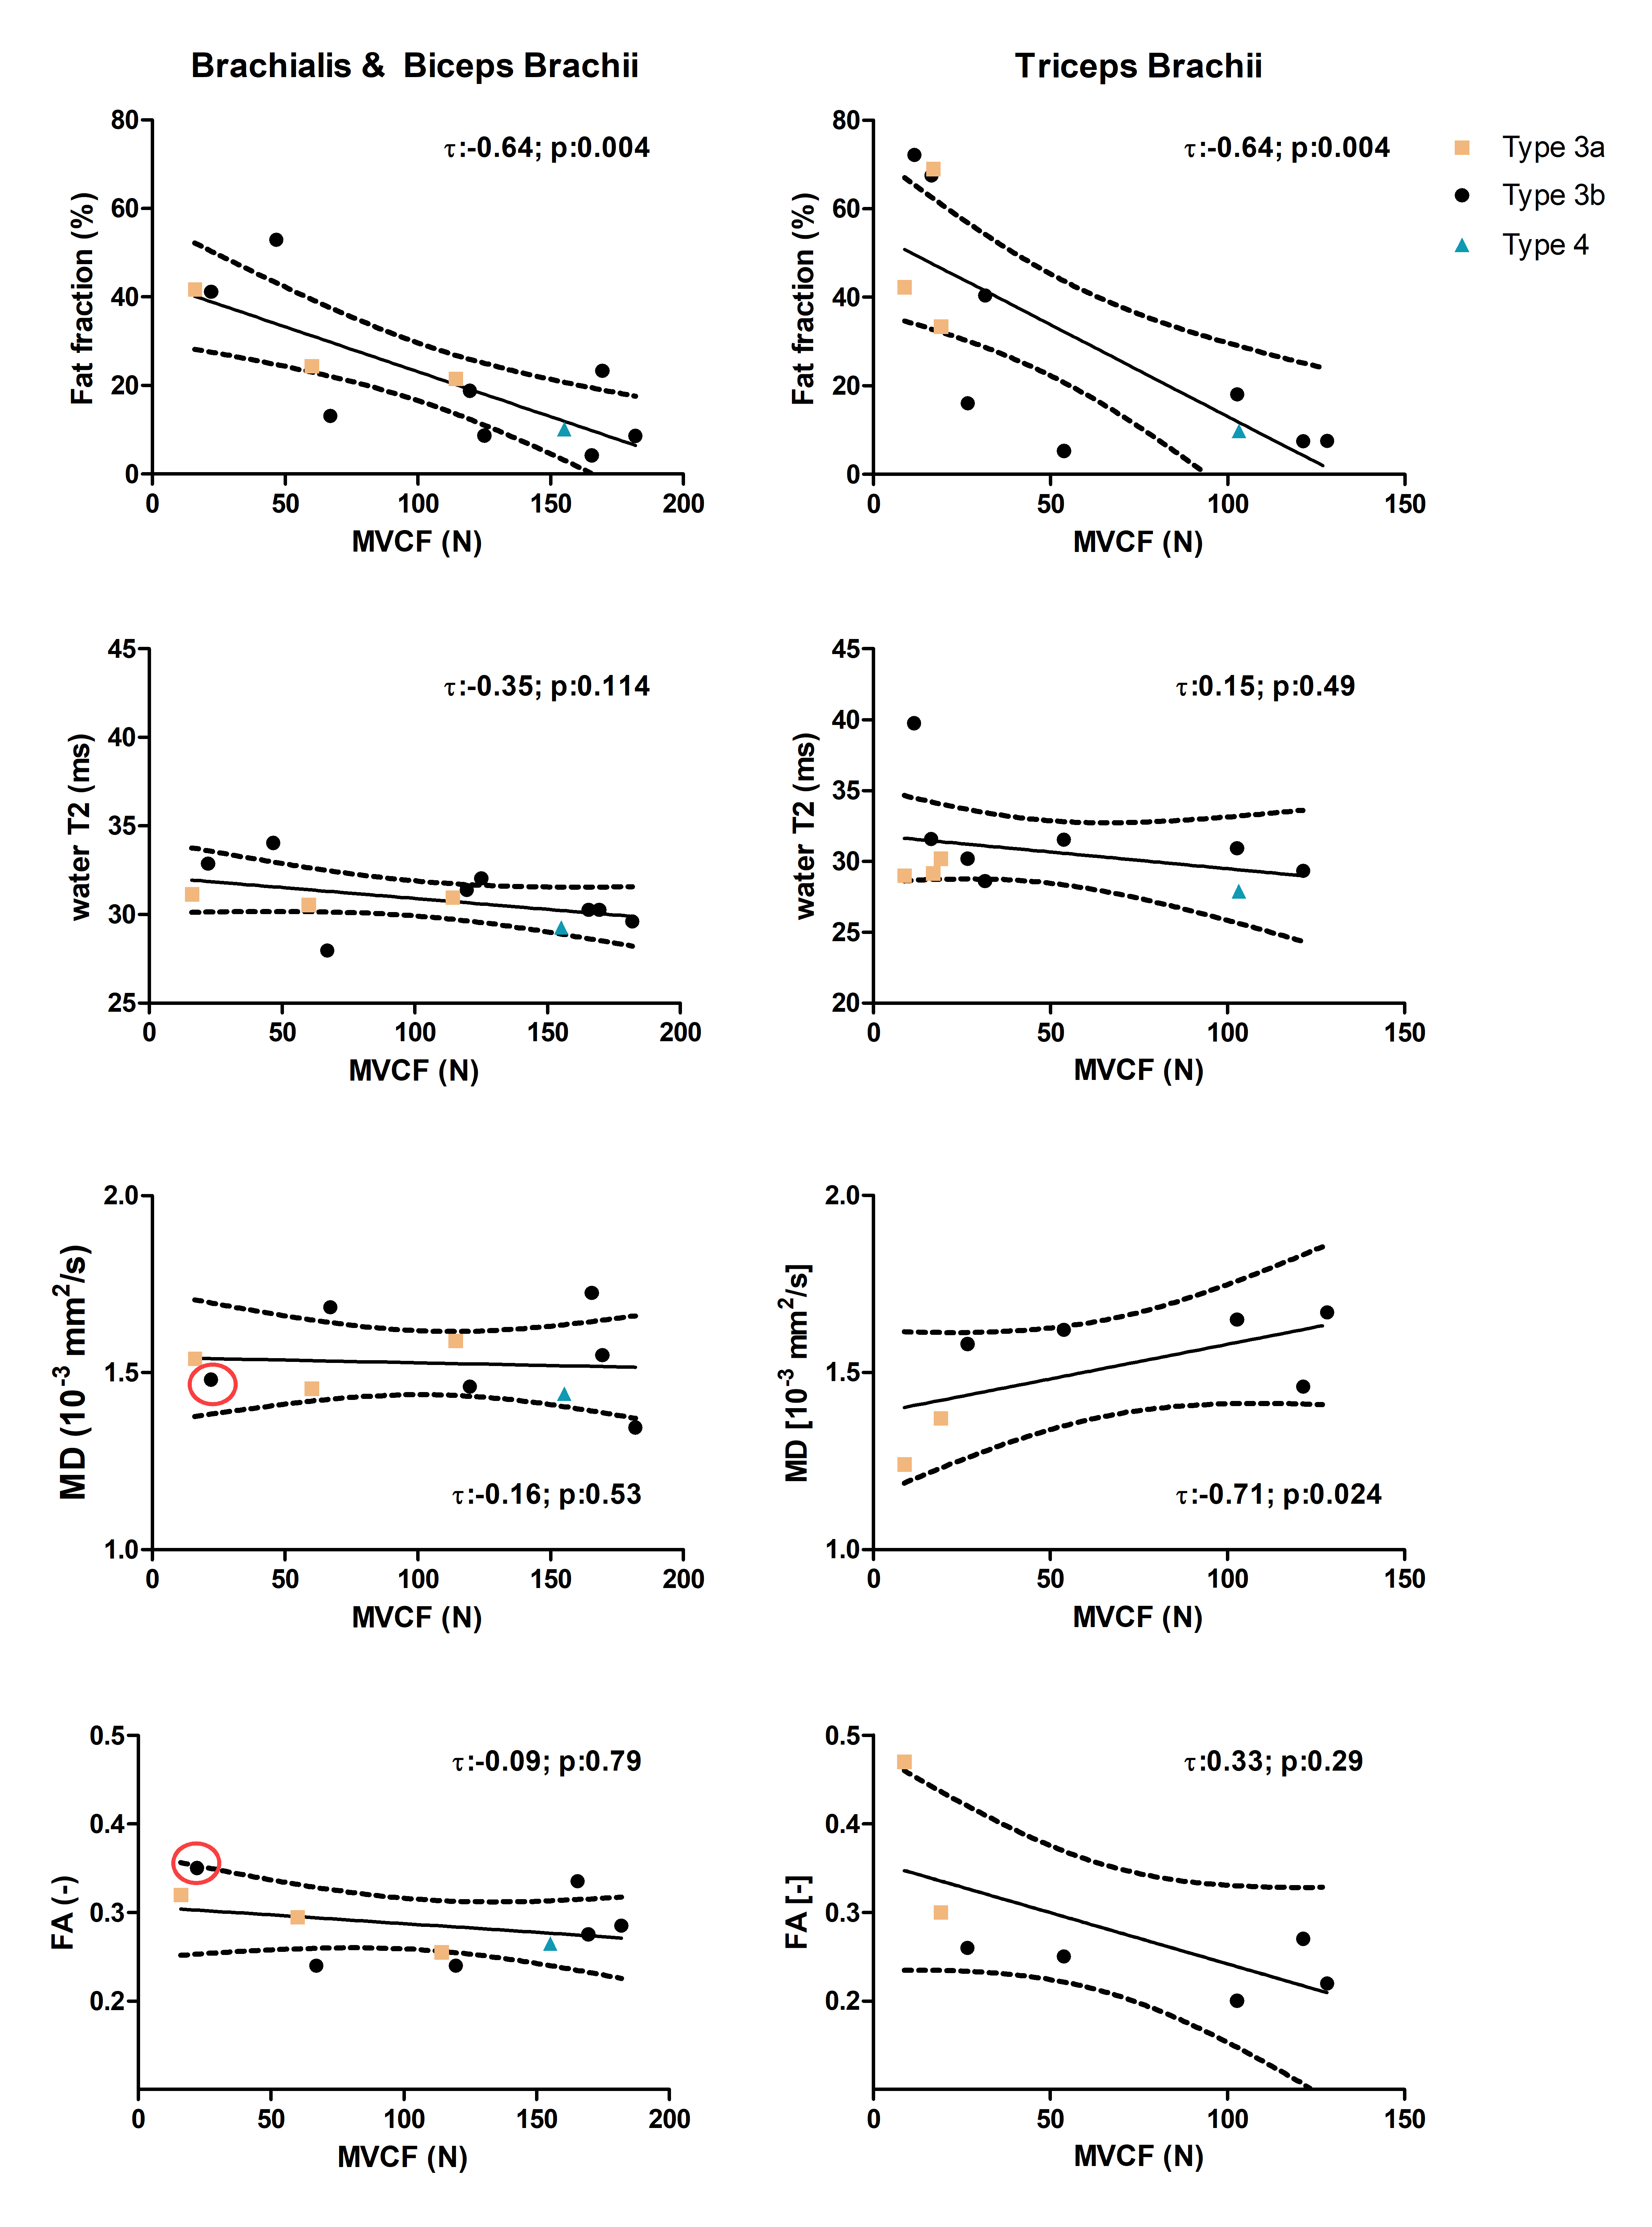
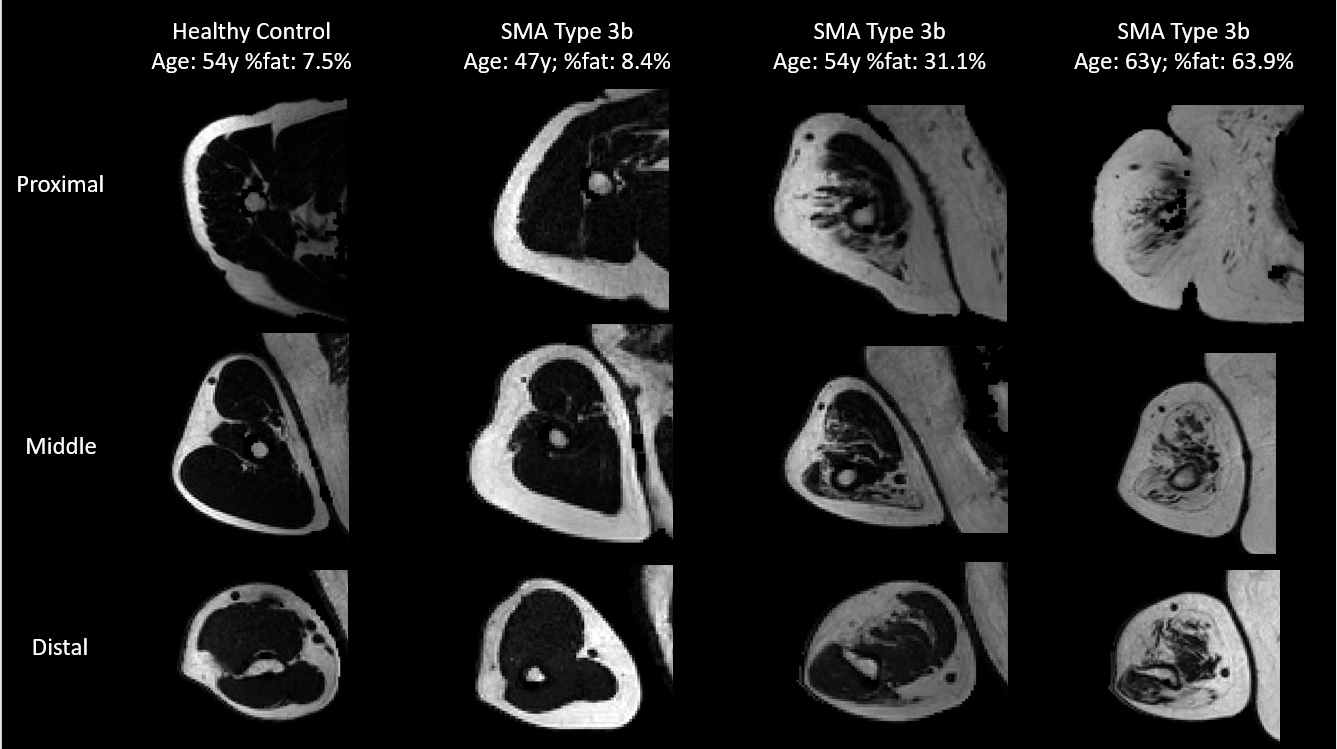
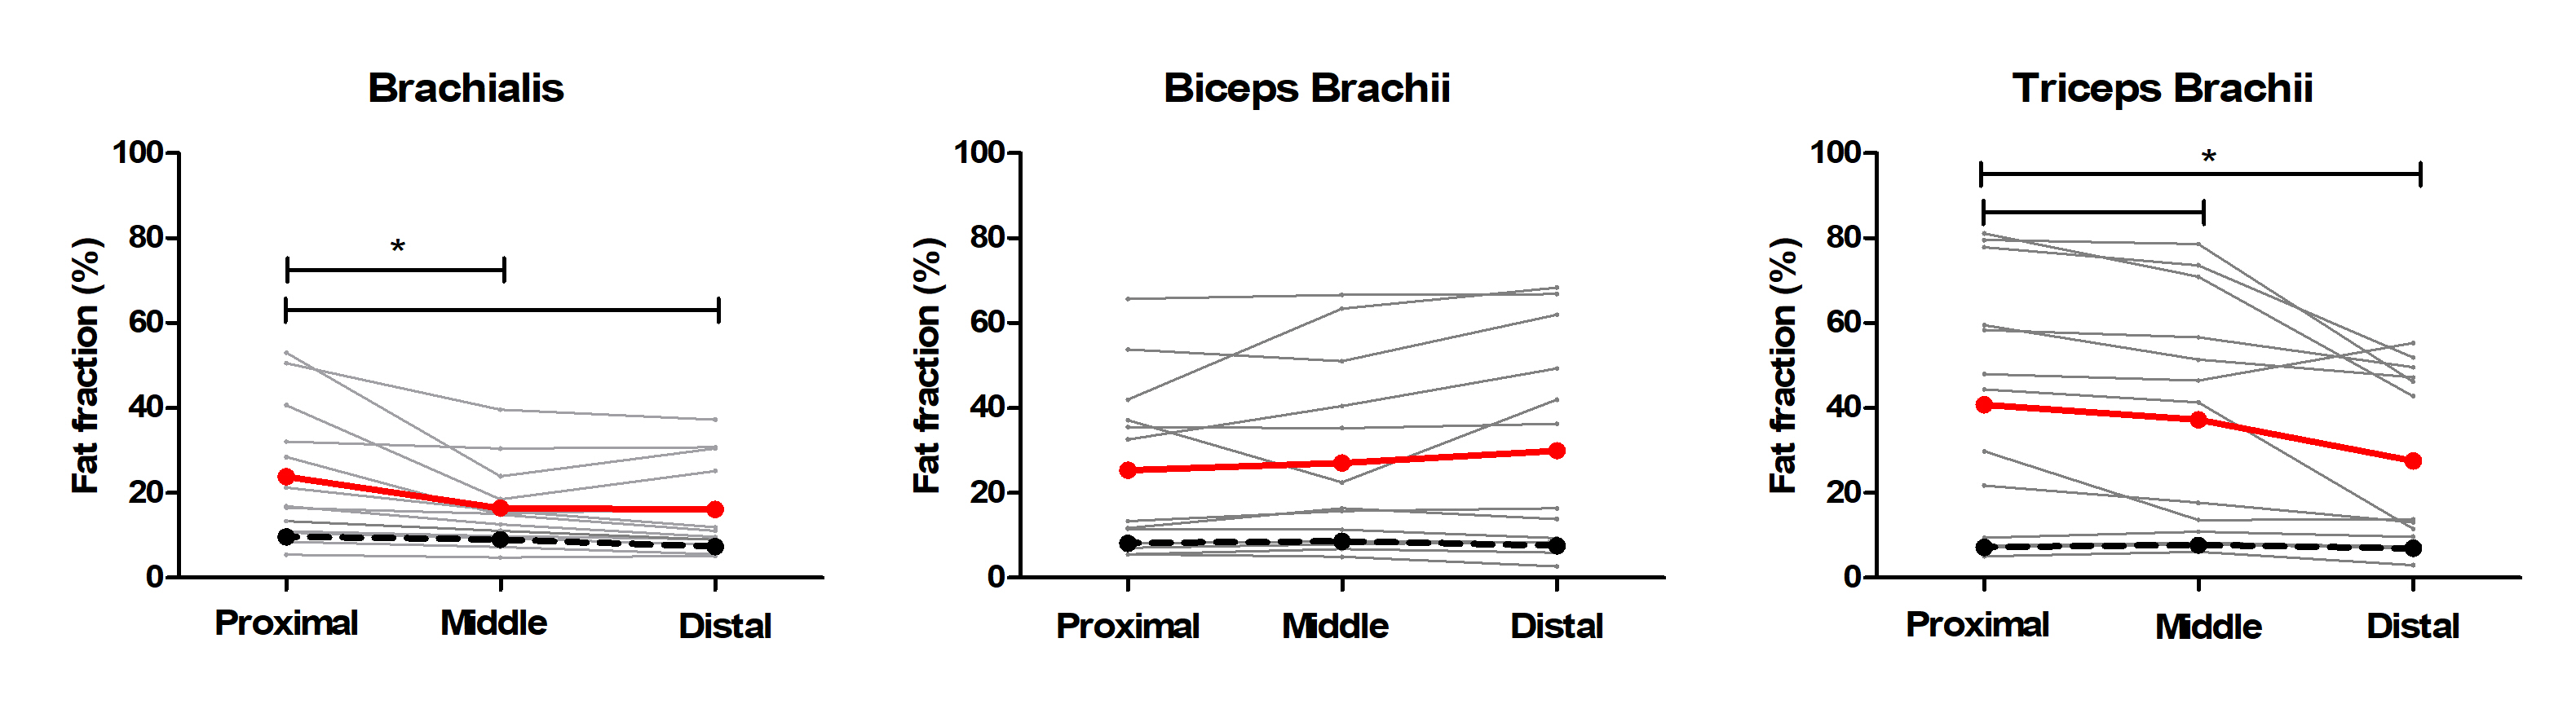
Multi-parametric axial images of a representative SMA patient are shown in Figure 1. FF was significantly increased (Z> -2.76; p-value≤0.006) in all upper arm muscles of the patients with SMA compared to controls (Fig.2) and correlated negatively with MVCF (Fig.3). Additionally, FF was heterogeneously distributed within the TB and BR muscle but not in the BB muscle (Fig.4-5). Diffusion indices and water T2 relaxation times were similar between patients with SMA and controls but we did find a slightly reduced MD (Z= ‑2.35; p=0.016), λ1 (Z= -2.5; p=0.01) and λ3 (Z= -2.14; p=0.031) in the TB of patients with SMA (Fig.2). Furthermore, MD positively correlated with MVCF in the TB of patients with SMA(Fig.3).Discussion
Our multi-modal MR approach showed that FFs were significantly higher in all upper arm muscles of the patients with SMA compared to controls and were negatively associated with MVCF. The observed pattern of selective involvement of individual upper arm muscles is in agreement with previous observations16-19. Additionally, in patients with SMA FFs were heterogeneously distributed (higher fat fractions proximally) within the TB and BR muscle but not in the BB muscle. This phenomenon has not been reported before in SMA, but different heterogeneous distributions have been described in Duchenne Muscular Dystrophy 20,21 and Facio Scapula Humeral Muscular Dystrophy 22. As a next step, it would be of interest to investigate whether this distribution of the fat fractions is also visible in other muscles and ultimately to investigate the underlying mechanism. We did not find differences between patients with SMA and controls based on the DTI indices or water T2 relaxation times. Nonetheless, lower diffusion indices were seen in the TB muscle of the patients with SMA. This is partly in line with recent work in the upper leg muscles of patients with SMA where changes in diffusion indices were attributed to atrophy of the muscle fibers 7,8. Our results suggest convergence with previous findings in thigh muscles and underline the potential of DTI for mapping disease progression in muscle tissue.Conclusion
Our multi-modal MR approach showed two- to fivefold higher fat fractions in the upper arm muscles of SMA patients. No clear changes were observed for water T2 while DTI indices showed potential for mapping of changes in muscle tissue itself.Acknowledgements
No acknowledgement found.References
1. Lefebvre S, Burglen L, Reboullet S, et al. Identification and characterization of a spinal muscular atrophy-determining gene. Cell. 1995;80(1):155-165.
2. D'Amico A, Mercuri E, Tiziano FD, Bertini E. Spinal muscular atrophy. Orphanet J Rare Dis. 2011;6:71.
3. Goulet BB, Kothary R, Parks RJ. At the "junction" of spinal muscular atrophy pathogenesis: the role of neuromuscular junction dysfunction in SMA disease progression. Curr Mol Med. 2013;13(7):1160-1174.
4. Mercuri E, Darras BT, Chiriboga CA, et al. Nusinersen versus Sham Control in Later-Onset Spinal Muscular Atrophy. N Engl J Med. 2018;378(7):625-635.
5. Groen EJN, Talbot K, Gillingwater TH. Advances in therapy for spinal muscular atrophy: promises and challenges. Nat Rev Neurol. 2018;14(4):214-224.
Yeo CJJ, Darras BT. Yeo and Darras: Extraneuronal Phenotypes of Spinal Muscular Atrophy. Ann Neurol. 2021;89(1):24-26.
6. Strijkers GJ, Araujo ECA, Azzabou N, et al. Exploration of New Contrasts, Targets, and MR Imaging and Spectroscopy Techniques for Neuromuscular Disease - A Workshop Report of Working Group 3 of the Biomedicine and Molecular Biosciences COST Action BM1304 MYO-MRI. J Neuromuscul Dis. 2019;6(1):1-30.
7. Otto LAM, Froeling M, van Eijk RPA, et al. Quantification of disease progression in spinal muscular atrophy with muscle MRI-a pilot study. NMR Biomed. 2021:e4473.
8. Otto LAM, van der Pol WL, Schlaffke L, et al. Quantitative MRI of skeletal muscle in a cross-sectional cohort of patients with spinal muscular atrophy types 2 and 3. NMR Biomed. 2020;33(10):e4357.
9. Kruitwagen-van Reenen ET, van der Pol L, Schroder C, et al. Social participation of adult patients with spinal muscular atrophy: Frequency, restrictions, satisfaction, and correlates. Muscle Nerve. 2018;58(6):805-811.
10. Kruitwagen-Van Reenen ET, Wadman RI, Visser-Meily JM, van den Berg LH, Schroder C, van der Pol WL. Correlates of health related quality of life in adult patients with spinal muscular atrophy. Muscle Nerve. 2016;54(5):850-855.
11. Reeder SB, Pineda AR, Wen Z, et al. Iterative decomposition of water and fat with echo asymmetry and least-squares estimation (IDEAL): application with fast spin-echo imaging. Magn Reson Med. 2005;54(3):636-644.
12. William WT, Baligand C, Forbes SC et al. Chemical shift-based MRI to measure fat fractions in dystrophic skeletal muscle. Magn Reson Med. 2014 Jul;72(1):8-19.
13. Klein S, Staring M, Murphy K, Viergever MA, Pluim JP. elastix: a toolbox for intensity-based medical image registration. IEEE Trans Med Imaging. 2010;29(1):196-205.
14. De Luca A, Bertoldo A, Froeling M. Effects of perfusion on DTI and DKI estimates in the skeletal muscle. Magn Reson Med. 2017;78(1):233-246.
15. Keene KR, Beenakker JWM, Hooijmans MT, et al. T-2 relaxation-time mapping in healthy and diseased skeletal muscle using extended phase graph algorithms. Magn Reson Med. 2020.
16. Brogna C, Cristiano L, Verdolotti T, et al. MRI patterns of muscle involvement in type 2 and 3 spinal muscular atrophy patients. J Neurol. 2020;267(4):898-912.
17. Durmus H, Yilmaz R, Gulsen-Parman Y, et al. Muscle magnetic resonance imaging in spinal muscular atrophy type 3: Selective and progressive involvement. Muscle Nerve. 2017;55(5):651-656.
18. Liu GC, Jong YJ, Chiang CH, Yang CW. Spinal muscular atrophy: MR evaluation. Pediatr Radiol. 1992;22(8):584-586.
19. Quijano-Roy S, Avila-Smirnow D, Carlier RY, group W-Mms. Whole body muscle MRI protocol: pattern recognition in early onset NM disorders. Neuromuscul Disord. 2012;22 Suppl 2:S68-84.
20. Hooijmans MT, Niks EH, Burakiewicz J, et al. Non-uniform muscle fat replacement along the proximodistal axis in Duchenne muscular dystrophy. Neuromuscul Disord. 2017;27(5):458-464.
21. Chrzanowski SM, Baligand C, Willcocks RJ, et al. Multi-slice MRI reveals heterogeneity in disease distribution along the length of muscle in Duchenne muscular dystrophy. Acta Myol. 2017;36(3):151-162.
22. Janssen BH, Voet NB, Nabuurs CI, et al. Distinct disease phases in muscles of facioscapulohumeral dystrophy patients identified by MR detected fat infiltration. PLoS One. 2014;9(1):e85416.
Figures