1028
Capability of Diffusion-Weighted Stimulated-Echo Imaging to Visualize Spontaneous Muscular Activities in Resting Musculature1Section on Experimental Radiology, University Hospital of Tuebingen, Tuebingen, Germany, 2Institute of Signal Processing and System Theory, University of Stuttgart, Stuttgart, Germany, 3Siemens Healthcare GmbH, Erlangen, Germany
Synopsis
Visualization of spontaneous mechanical activities in resting musculature using diffusion-weighted stimulated-echo imaging is highly depending on the sequence parameter settings as well as on the physiological parameters of the muscular contraction. Therefore, a concept for estimation of the visualization probability by using two contraction models is given in this work. Furthermore, the proposed concept is validated using diffusion-weighted measurements with varying diffusion-sensitizing times. The determined visualization probability is in good accordance to the relative number of visible spontaneous mechanical activities in the resting lower leg musculature.
Introduction
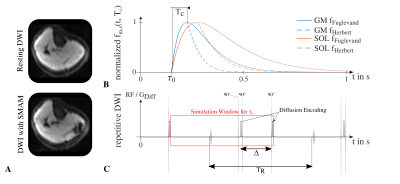
The MR imaging process using diffusion-weighted stimulated-echo imaging (DW-STE) for detection of spontaneous mechanical activities in musculature (SMAM)1, visible as signal voids (Fig.1A), is asynchronous to the onset of the muscular twitch contraction.2 Whether spontaneous muscular activities are leading to signal voids in DWI or not mainly depends on the point in time of the onset of muscular contraction in relation to the diffusion-encoding gradients as well as the duration of the incoherent motion.3 It is assumed that muscular contractions starting directly after a motion-sensitive interval in DWI are possibly relaxed before the next motion-sensitive period starts, and therefore are not visible in DWI. Thus, the imaging parameters of the DW-STE sequence, mainly the diffusion-sensitizing time $$$\Delta$$$ in conjunction with the mixing time $$$T_M$$$, have large effects on the capability of the DW-STE sequence to visualize SMAMs.Therefore, a simulation using two different muscular twitch models is introduced and subsequently validated by DW-STE measurements from healthy subjects.
Material & Methods:
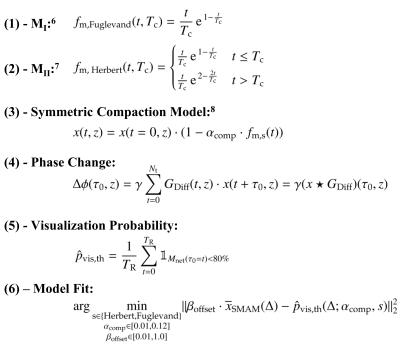
Estimation of the theoretical visualization probability: The visualization probability $$$p_{vis,th}$$$ can be modeled in a theoretical approach by determining the signal reduction from the contraction-induced intra-voxel phase changes $$$\Delta\phi$$$ in relation to the starting point of muscular contraction $$$\tau_0$$$. The intra-voxel phase change $$$\Delta\phi$$$ depends on the fiber displacement during muscular twitch contraction which can be derived from the muscle twitch model $$$f_{m,s}(t,T_c)$$$ with $$$T_c$$$ being the contraction time. Two models were utilized for the muscles GM (m. gastrocnemius medialis) with $$$T_c=75.5\pm21.4\,$$$ms4 and SOL (m. soleus) with $$$T_c=127\pm6\,$$$ms5. Models are depicted in Fig.1B calculated with Eq.(1)6 (MI) and Eq.(2)7 (MII) in Fig.2. Contraction displacements of the muscle fiber within a voxel are simulated using the model from Heskamp et al.8 with the same simplification to consider only displacement contributions in slice direction. In this model, the change in phase is calculated for equidistant locations within the imaging slice $$$z$$$ to determine the resulting net magnetization $$$M_{Net}$$$. The difference of the displacement-dependent spin position is calculated following the symmetric compaction model (Eq.(3)8) with $$$\alpha_{comp}$$$ being the compaction rate of the muscle fiber. Assuming that $$$\tau_0$$$ is the starting point in time of the muscular contraction within the time period between rephasing gradients of two consecutive DWI measurements (Fig.1C), the change of the intra-voxel phase $$$\Delta\phi(\tau_0,z)$$$ is the discrete signal correlation of the spin location $$$x(t,z)$$$ with the diffusion gradient $$$G_{Diff}(t,z)$$$ (Eq.(4)). For determination of the visualization probability $$$\hat{p}_{vis,th}$$$ of a DW-STE sequence (Eq.(5)), a SMAM is indicated as a signal intensity drop, i.e., proportional to $$$M_{Net}$$$, larger than 20%1.DW-STE measurements: By variation of the diffusion-sensitizing time $$$\Delta$$$ in multiple DWI measurements, its influence can be indirectly assessed based on the number of visible SMAMs in DWI data sets.3 Therefore, DW-STE measurements were conducted with varying $$$\Delta$$$ starting from 25 ms to 250 ms (step: 25 ms). In order to avoid a systematic bias, e.g., higher amount of SMAMs caused by an increasingly uncomfortable position for the subject under examination, five measurement cycles with a lower amount of repetitions (number of DWI per sub-measurement of 100) and randomly selected $$$\Delta$$$ were conducted. Each set of DWI measurements was normalized to the maximum number of visible SMAMs within the same subject. Only relative differences in the number of SMAMs are measurable by this approach. Thus, an offset factor $$$\beta_{offset}$$$ has to be determined by fitting the visualization probability model to the mean relative amount of visible SMAMs, i.e., $$$\overline{x}_{SMAM}(\Delta)$$$, following Eq.(6). DWI were conducted with a prototype DW-STE sequence from five healthy subjects (age: 33±11 years) on a 3T MR system (MAGNETOM Prismafit, Siemens Healthcare, Erlangen, Germany) with following parameterization: $$$b=100\frac{s}{mm²}$$$, slice thickness of 6 mm, $$$T_R=500\,$$$ms. SMAMs in DWI were detected and segmented using a neural network approach9 from previous works.
Results & Discussion
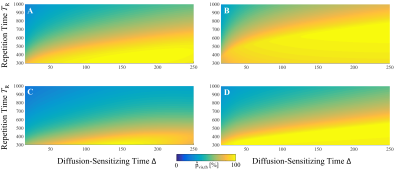
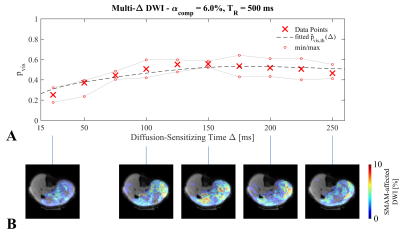
In Fig.3, the estimated theoretical visualization probability $$$\hat{p}_{vis,th}$$$ is given for the two contraction models MI and MII and for the muscles GM ($$$\alpha_{comp}=9.72\%$$$)10 and SOL ($$$\alpha_{comp}=11.78\%$$$)10. It can be seen that the contraction model has a high influence on $$$\hat{p}_{vis,th}$$$ of the DW-STE sequence. The shortened period of muscular relaxation in MII leads to a reduction due to the overall shorter period of muscular contraction. This holds also true for a shorter contraction time $$$T_c$$$. SMAM data points for $$$\Delta=25-250\,$$$ms are given in Fig.4A with exemplary event count maps in Fig.4B. For the given data set, model MII resulted in a better fit than MI (model parameters: $$$\alpha_{comp}=6.0\%$$$ and $$$\beta_{offset}=0.61$$$). Highest visualization probability is in the range of $$$\Delta=125-200\,$$$ms.Conclusion
It is shown that the characteristics of muscular twitch contraction highly influence the possible number of visible SMAMs in conjunction with the parameterization of the DW-STE sequence. It is concluded that DW-STE with a $$$\Delta$$$ in the range of 125-200 ms for a repetition time $$$T_R=500\,$$$ms exhibits the highest sensitivity for imaging SMAMs in the lower leg of healthy subjects for this specific contraction model. Large-scale studies using the proposed approach should investigate the generalizability of the models used and might enable indirect measurements of the contraction time of individual muscle groups. This might lead to a better understanding of spatio-temporal differences between SMAMs in varying DWI settings.Acknowledgements
This work was supported and funded by the German Research Foundation (DFG) under Grants SCHI 498/11‐2 and YA 28/16‐2.References
[1]: G. Steidle and F. Schick. Addressing spontaneous signal voids in repetitive single-shot DWI of musculature: spatial and temporal patterns in the calves of healthy volunteers and consideration of unintended muscle activities as underlying mechanism. NMR in Biomedicine, 28:801–810, July 2015. ISSN 1099-1492. doi: 10.1002/nbm.3311.
[2]: M. Schwartz, G. Steidle, P. Martirosian, A. Ramos-Murguialday, H. Preissl, A. Stemmer, B. Yang, and F. Schick. Spontaneous mechanical and electrical activities of human calf musculature at rest assessed by repetitive single-shot diffusion-weighted MRI and simultaneous surface electromyography. Magnetic Resonance in Medicine, 9:2784–2794, May 2018. ISSN 1522-2594. doi: 10.1002/mrm.26921.
[3]: M. Schwartz, G. Steidle, P. Martirosian, A. Ramos-Murguialday, A. Stemmer, B. Yang, and F. Schick. Estimation of the Sensitivity Characteristics and Detection Capability of Diffusion-Weighted MR Sequences in Imaging Spontaneous Mechanical Activity in Musculature. In Proceedings of the Annual Meeting International Society for Magnetic Resonance in Medicine (ISMRM), 2017.
[4]: R. A. Garnett, M. J. O’Donovan, J. A. Stephens, and A. Taylor. Motor unit organization of human medial gastrocnemius. The Journal of Physiology, 287:33–43, Feb. 1979. ISSN 0022-3751. doi: 10.1113/jphysiol.1979.sp012643.
[5]: G. N. Sanchez, S. Sinha, H. Liske, X. Chen, V. Nguyen, S. L. Delp, and M. J. Schnitzer. In Vivo Imaging of Human Sarcomere Twitch Dynamics in Individual Motor Units. Neuron: Cell Press, 88(6):1109–1120, 2015.
[6]: A. J. Fuglevand, D. A. Winter, and A. E. Patla. Models of recruitment and rate coding organization in motor-unit pools. Journal of Neurophysiology, 70:2470–2488, Dec. 1993. ISSN 0022-3077. doi: 10.1152/jn.1993.70.6.2470.
[7]: R. D. Herbert and S. C. Gandevia. Twitch interpolation in human muscles: mechanisms and implications for measurement of voluntary activation. Journal of Neurophysiology, 82:2271–2283, Nov. 1999. ISSN 0022-3077. doi: 10.1152/jn.1999.82.5.2271.
[8]: L. Heskamp, M. G. Birkbeck, R. G. Whittaker, I. S. Schofield, and A. M. Blamire. The muscle twitch profile assessed with motor unit magnetic resonance imaging. NMR inBiomedicine, 34:e4466, Mar. 2021. ISSN 1099-1492. doi: 10.1002/nbm.4466.
[9]: M. Schwartz, T. Küstner, P. Martirosian, J. Machann, G. Steidle, B. Yang, and F. Schick. Robust Quantification of Spontaneous Muscular Activities by Simultaneous Interpretation of sEMG Data. In Proceedings of the 36th Annual Scientific Meeting European Society for Magnetic Resonance in Medicine and Biology (ESMRMB), 2019.
[10]: T. Oda, H. Kanehisa, K. Chino, T. Kurihara, T. Nagayoshi, T. Fukunaga, and Y. Kawakami. In vivo behavior of muscle fascicles and tendinous tissues of human gastrocnemius and soleus muscles during twitch contraction. Journal of Electromyography and Kinesiology, 17:587–595, Oct. 2007. ISSN 1050-6411. doi: 10.1016/j.jelekin.2006.04.013.
Figures

Figure 1: A: Exemplary DWI without and with visible SMAM. B: Radial displacement of muscular twitch contraction (Tc: contraction time) over time for two different models6,7 and muscles (GM and SOL). C: Repetitive DWI with simulation window for τ0 between rephasing gradients of two consecutive DWI measurements.

Figure 2: Equations for the simulation and estimation of the visualization probability pvis,th of a DW-STE sequence.

Figure 3: Estimated theoretical visualization probability pvis,th depending on TR and Δ for (A) the SOL with MII, (B) the SOL with MI, (C) the GM with MII and (D) the GM with MI. Simulation parameters: slice thickness of 6 mm, b = 100 s/mm², Δ=15-250 ms and TR=300-1000 ms.
