1027
Spontaneous motor unit activity in a healthy ageing population measured using motor unit MRI (MUMRI)1Translational and Clinical Research Institute, Newcastle University, Newcastle upon Tyne, United Kingdom, 2Northern Medical Physics and Clinical Engineering, Newcastle upon Tyne NHS FT, Newcastle upon Tyne, United Kingdom, 3NIHR Newcastle Biomedical Research Centre, Newcastle University, Newcastle upon Tyne, United Kingdom, 4Department of Neuroradiology, Newcastle Upon Tyne NHS FT, Newcastle upon Tyne, United Kingdom, 5Department of Neurophysiology, Newcastle upon Tyne NHS FT, Newcastle upon Tyne, United Kingdom
Synopsis
Sarcopenia is commonly associated with ageing, whereby individuals lose muscle mass and strength. One potential contributor to sarcopenia is the degeneration of motor units (MU), defined as a single motor neuron and the muscle fibres it innervates. We used motor unit MRI (MUMRI) to investigate changes to spontaneous MU activity and morphology in a cohort of healthy ageing adults. We found that MU activity and morphology did not appear to change with healthy ageing. We next aim to apply the MUMRI technique in patients with sarcopenia to look for evidence of accelerated MU loss compared to these healthy controls.
Introduction
Sarcopenia is the loss of skeletal muscle strength and mass and is commonly associated with ageing.1 One potential contributor to the pathophysiology of sarcopenia is accelerated degeneration of motor units (MUs).2 A MU is defined as a single motor neuron and all muscle fibres it innervates. MU degeneration may manifest both as an increase in the spontaneous MU activity (fasciculation) and a change in their morphology (re-innervation).Motor unit MRI (MUMRI) employs a pulsed gradient spin echo (PGSE) diffusion weighted (DW) sequence to image spontaneous MU activity.3 The re-ordering of water protons caused by muscle fibre contraction manifests as transient signal voids in MUMRI images.4 Therefore, MUMRI offers a promising way to help understand MU activity in sarcopenia. We first aimed to investigate how spontaneous MU activity presents during healthy ageing.
Methods
Subjects: We included 37 healthy volunteers aged 45 to 85 years split into four age groups (45–54 years, n=7; 55–64 years n=12; 65–74 years, n=10; 75-85 years, n=8).Data acquisition: We acquired 200 repetitions of four axial DW slices (1 image/second) of the lower leg using on a 3T Philips Achieva using a pair of elliptical surface coils (in-plane resolution=1.5x1.5mm, slice thickness=8mm, TR/TE=1075/44ms, b-value=200s/mm2, Δ/δ=19.4/6.5ms, fat suppression: SPAIR, SSGR & olefinic fat suppression).
Data processing: Images were processed to identify the number and size of signal voids as measures of spontaneous MU activity and size. Images were registered to the first dynamic of the time-series using rigid registration. Voxel wise linear detrending was applied to compensate for signal loss due to B1 inhomogeneity. Seven lower leg muscles were segmented in ITKSnap. Segmented images were passed through a custom written Matlab algorithm to detect transient signal voids. A signal void was defined as a group of connected voxels whose signal intensities dropped below a threshold level, defined as:
$$S_{d}<S_{75}-(n_{m}\times c)$$
Where Sd is the signal in the detrended image, S75 the 75th percentile across the 200 dynamics, nm the noise level, and c a constant. The noise level nm was estimated by taking the difference image between each subsequent dynamic and then using the median value of the difference images (Figure1).
To be labelled as an MU, the signal void needed to be at least 10mm2, the minimum MU cross sectional area found in previous work.5
Algorithm optimization and verification: We validated our algorithm against multi-observer consensus manual data before applying to the wider cohort. Three independent observers manually delineated signal voids on four data sets and created four consensus data sets (Figure 2). Each set was compared to the algorithm output for different integer values of c ranging from 1-15. The mean DICE coefficient was calculated as a measure of agreement between algorithm and consensus data.
Outcome and statistics: The number of signal voids detected with the optimised algorithm were normalised to the cross sectional area of the muscle (in cm2). The rate of spontaneous activity was calculated in (cm-2min-1). The normalised number of signal voids were compared between age groups on a whole leg and individual muscle basis analysed using one and two way ANOVA respectively. The cross sectional area and maximum and minimum diameter of the signal voids were logarithmically transformed to remove skew and compared between age groups using a general estimating equation (GEE) accounting for clustered data.
Results
Algorithm verification: A value of c=6 was chosen as the optimal threshold as the differences between the algorithm and consensus were minimal and the DICE coefficient was maximum (DICE=0.52). At c=6, there was no significant difference in the cross sectional area and maximum and minimum diameters of the detected signal voids between the algorithm and the consensus data sets (pCSA=0.96, pFeret-max=0.63, pFeret-min=0.81) (Figure 3).Effect of ageing: The number of signal voids per cm2 of muscle tissue was comparable between age groups (mean±std: 45-54 years: 0.29±0.25cm-2; 55-64 years: 0.79±1.59cm-2; 65-74 years: 0.55±0.89cm-2; 75-85 years: 0.36±0.21cm-2; (p=0.71). The fasciculation rate for each age group was (45-54 years: 0.08±0.07cm-2min-1; 55-64 years: 0.22±0.44cm-2 min-1; 65-74 years: 0.15±0.25cm-2 min-1; 75-85 years: 0.10±0.06cm-2 min-1; (p=0.71) (Figure 4).
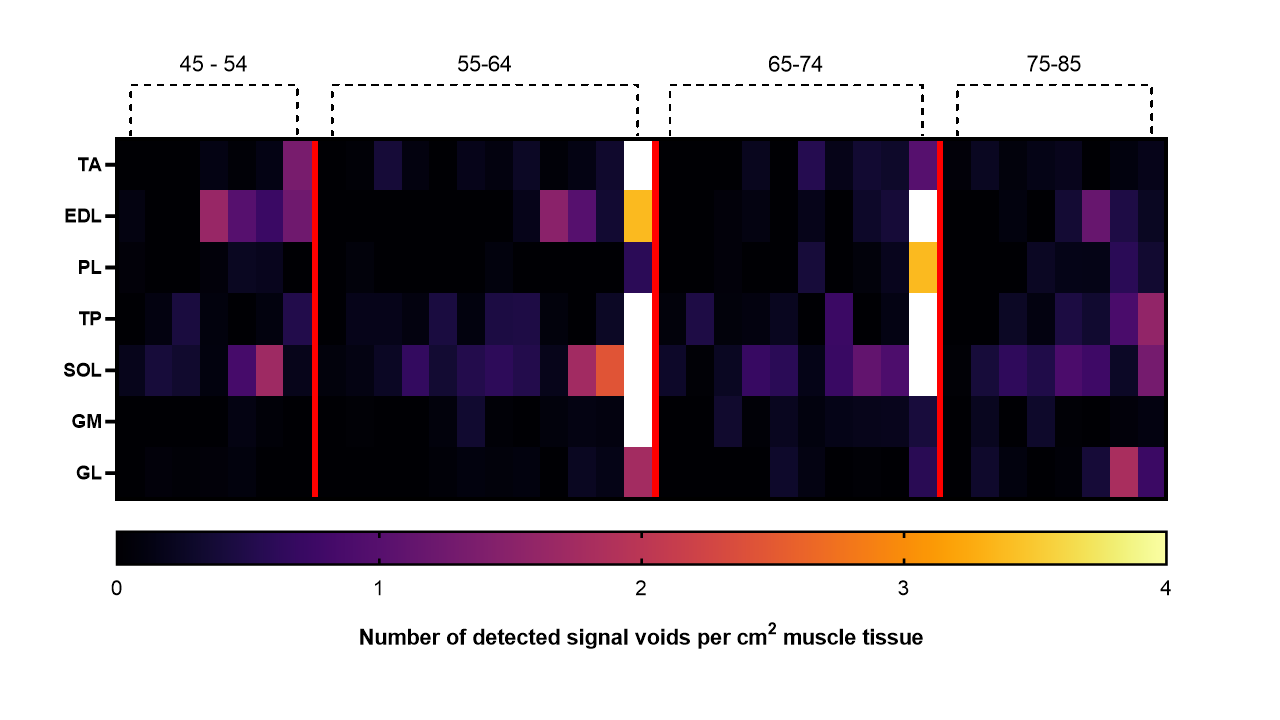
The cross sectional area and maximum and minimum Feret diameters of the signal voids did not differ between age groups when analysed with a GEE (mean over age groups±std: CSA: 41.4±6.3mm2; Feret max: 11.2±0.8mm; Feret min: 5.8±0.4mm, (pCSA=0.27, pFeret-max=0.48, pFeret-min=0.08) (Figure 4). The soleus muscle demonstrated the highest number of voids compared between muscles for each age group (Figure 5).
Discussion & Conclusions
To our knowledge this is the first assessment of spontaneous MU activity in healthy ageing. No differences in MUMRI derived metrics of spontaneous MU activity were observed with age, suggesting that MU activity rate and MU morphology does not appear to change during the process of healthy ageing. Two participants demonstrated a much larger number of signal voids on the MUMRI images. The reason for this is unknown, but for example could indicate that the participant was not fully relaxed during the scan. We have also developed an algorithm capable of detecting MU activity in DW acquisitions of skeletal muscle.The next steps are to study a cohort of patients with a diagnosis of sarcopenia and compare the derived MUMRI metrics with age matched healthy controls.
Acknowledgements
The authors would like to thank Dr Susan Hillman for assistance with statistical analyses.
The NIHR Newcastle Biomedical Research Centre (BRC) is a partnership between Newcastle Hospitals NHS Foundation Trust and Newcastle University, funded by the National Institute for Health Research (NIHR). This paper presents independent research funded and supported by the NIHR Newcastle BRC. The views expressed are those of the author(s) and not necessarily those of the NIHR or the Department of Health and Social Care.
References
1) Cruz-Jentoft, AJ. Sayer, AA. Sarcopenia. Lancet, 2019. 393(10191): p. 2636-2646.
2) Sayer AA. et al., New horizons in the pathogenesis, diagnosis and management of sarcopenia. Age Ageing, 2013. 42(2): p. 145-503)
3) Whittaker, RG. et al., Functional magnetic resonance imaging of human motor unit fasciculation in amyotrophic lateral sclerosis. Ann Neurol, 2019. 85(3): p 455-459.
4) Heskamp, L. et al. The muscle twitch profile assessed with motor unit magnetic resonance imaging. NMR in Biomedicine, 2021, e4466.
5) Birkbeck, MG. et al. Non-invasive imaging of single human motor units. Clinical Neurophysiology, 2020. 131(6): p. 1399-1406.
Figures
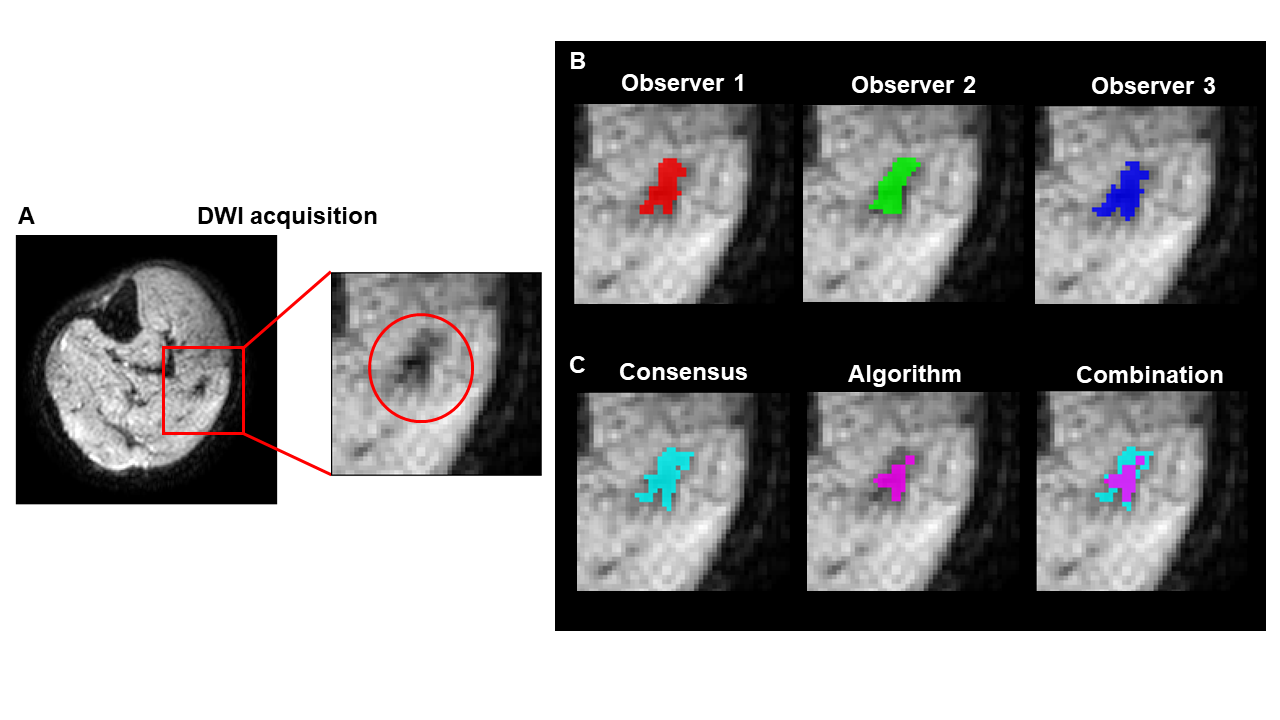
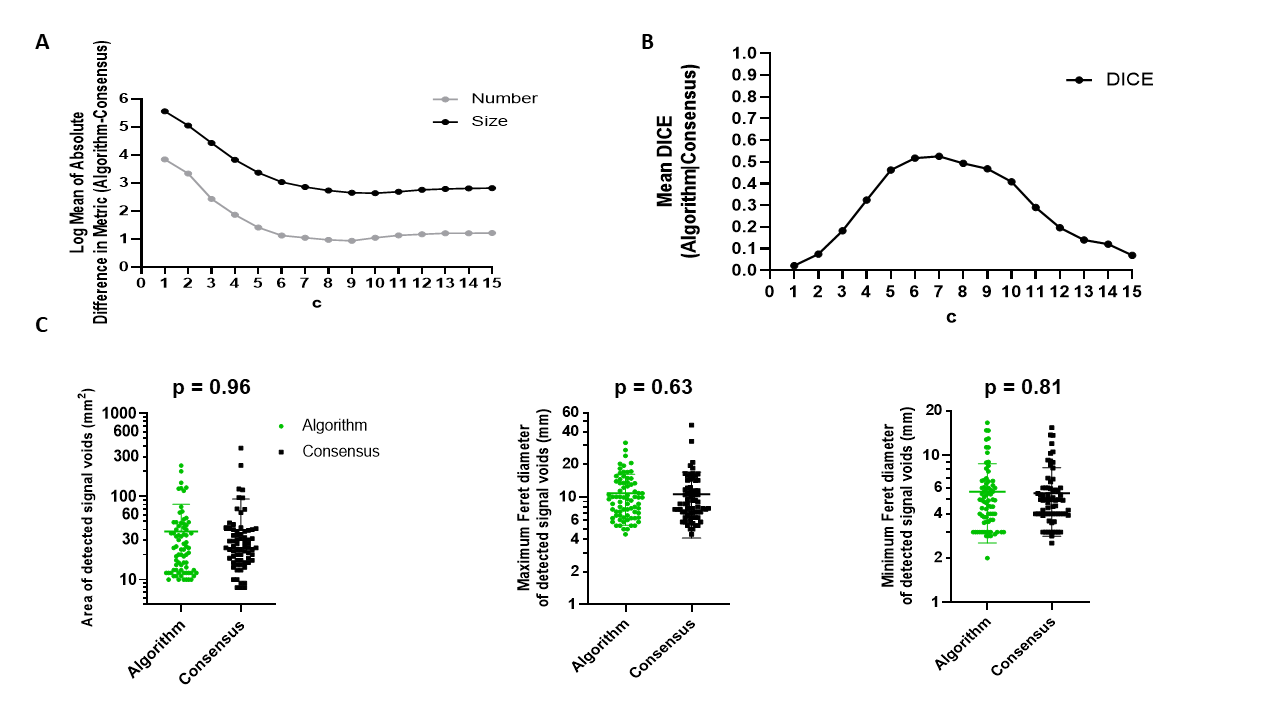
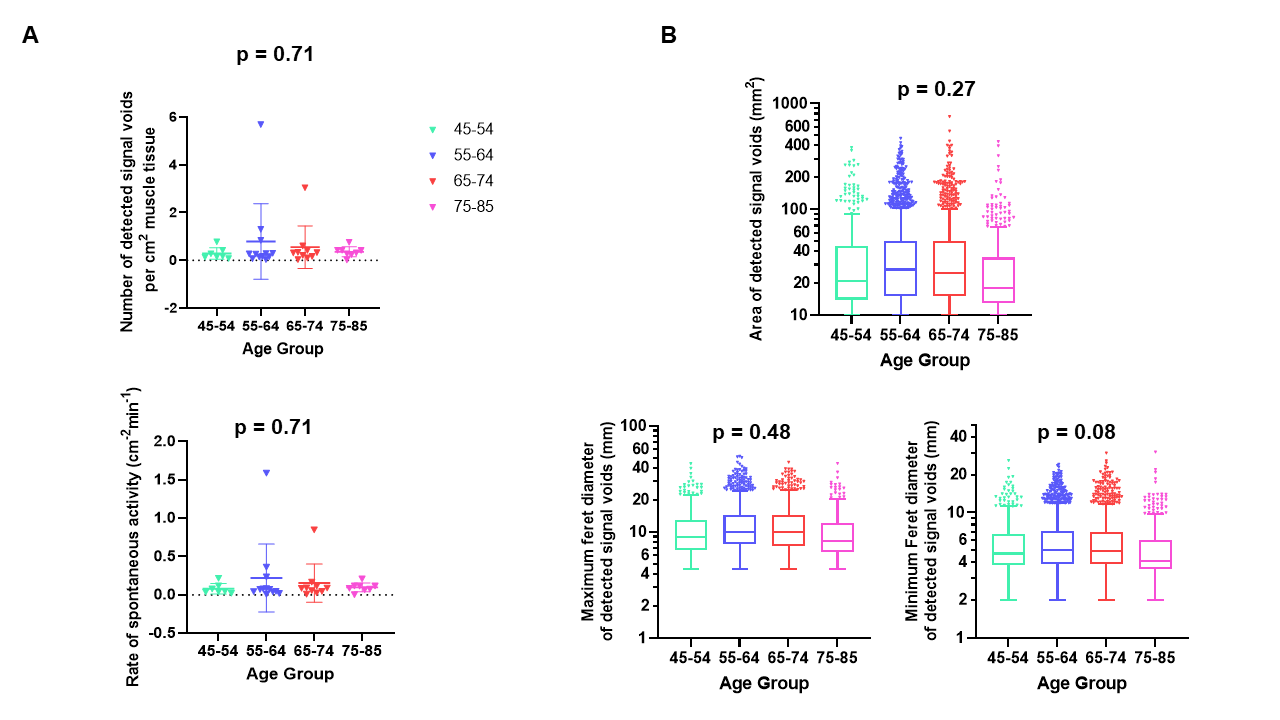
Figure 4: A) Scatter dot plot showing the number of detected signal voids per cm2 of muscle tissue for each age group (above) and rate of spontaneous activity (below), p-values of the one-way-ANOVAs indicated above graph. B) Tukey box plots of the logarithmic transform of the area and maximum and minimum Feret diameters of each signal void in each age group, p-values from GEE analysis above respective graphs.