1025
Assessment of skeletal muscle extracellular volume fraction in Becker Muscular Dystrophy using MR fingerprinting with water and fat separation1NMR Laboratory, Institute of Myology, Neuromuscular Investigation Center, Paris, France, 2NMR Laboratory, CEA, DRF, IBFJ, MIRCen, Paris, France, 3Reference Center for Muscle Diseases Paris-Est, Institute of Myology, Paris, France
Synopsis
Becker muscular dystrophy (BMD) is a genetic neuromuscular disorder leading to muscle weakness and degeneration. Quantitative MRI has been widely proposed to characterize skeletal muscle tissue structure of BMD and revealed increased intramuscular fat fraction associated with functional decline. In this study, we measured the extracellular volume fraction (ECV) of skeletal muscle tissues using MR fingerprinting with water and fat separation. We evaluated this variable as an early imaging biomarker of skeletal muscle tissue alterations. Compared to healthy controls, we showed that the muscles of BMD subjects present elevated ECV before fatty replacement occurs.
INTRODUCTION
Becker muscular dystrophy (BMD) is a genetic neuromuscular disorder (NMD) caused by an X-linked recessive mutation leading to a defective dystrophin expression. Skeletal muscle fibers undergo a cycle of degeneration and regeneration leading to progressive muscle replacement by adipose tissue and an increase of endomysial fibrosis. Quantitative MRI has been widely proposed to characterize skeletal muscle tissue structure of dystrophic patients, including BMD. In this pathology, increased intramuscular fat fraction (FF) measured with Dixon is associated with functional decline1. Water T2 (T2H2O), an imaging biomarker related to disease activity processes in NMDs (necrosis, inflammation …) is unchanged or slightly increased compared to healthy controls2,3. Diffusion tensor imaging parameters (mean diffusivity, fractional anisotropy) do not show any alterations in the lower limbs compared to healthy controls4. Extracellular volume fraction (ECV) can be used to characterize the myocardium of dystrophic patients5,6 but has not been quantified so far in skeletal muscles. ECV quantification is derived from the alteration of T1 values following administration of an extracellular contrast agent. Lately, an MR fingerprinting sequence with water and fat separation (MRF T1-FF) was proposed for an accurate quantification of water T1 (T1H2O) in fatty replaced muscles7 and represents a good candidate for precise assessment of ECV in skeletal muscles of BMD patients. In this study, we evaluated ECV quantification with MRF T1-FF as an early imaging biomarker of skeletal muscle tissue alterations in BMD.METHODS
We scanned the thighs of 28 patients with BMD and 8 healthy controls at 3T (PrismaFit, Siemens). Fat fraction maps were obtained using a 3-pt Dixon method8. A multi-spin echo sequence was acquired (17 echoes from 9.5 ms to 165.5 ms) from which T2H2O maps were obtained by fitting the signal decay with a 3-exponential model9. An MRF T1-FF sequence was acquired before and 15 minutes following an intravenous Dotarem injection (0.2mmol/kg) with the following parameters: 1400 spokes, varying TE, TR and FA, 5 slices, Tacq = 10s/slice and a bi-component signal model was fit to generate T1H2O,preGd and T1H2O,postGd maps7. We measured FF, T2H2O, T1H2O,preGd and T1H2O,postGd in each muscle of the thigh. Blood T1 was also measured before and after the contrast agent injection (T1blood,preGd and T1blood,postGd, respectively) in the left ventricle using a modified look-locker inversion recovery sequence (MOLLI)10 and we calculated the extracellular volume fraction with the following formula11:$$ECV = (1-HCT)\times\frac{\frac{1}{T1_{H2O,postGd}} - \frac{1}{T1_{H2O,preGd}}}{\frac{1}{T1_{blood,postGd}} - \frac{1}{T1_{blood,preGd}}}$$
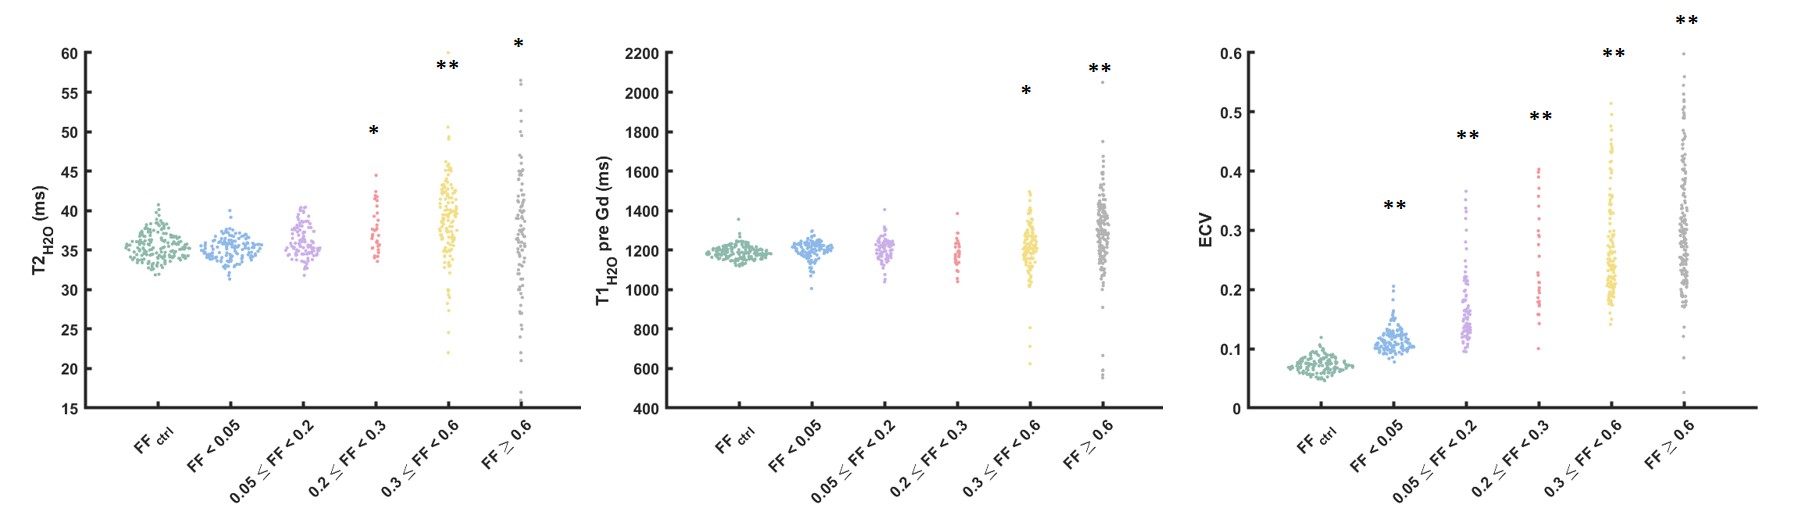
Median thigh FF, T2H2O, T1H2O, ECV were compared between healthy controls and BMD patients using Wilcoxon tests. Muscle of BMD patients were gathered in different groups according to their FF values (Group 1: FF < 0.05; Group 2: 0.05 < FF < 0.2; Group 3: 0.2 < FF < 0.3; Group 4: 0.3 < FF < 0.6; Group 4: FF > 0.6) and compared to healthy muscles using Kruskal-Wallis tests. Serum hematocrit (HCT), creatine kinase (CK) and cardiac troponin-T (TnT) levels were assessed in patients.
RESULTS
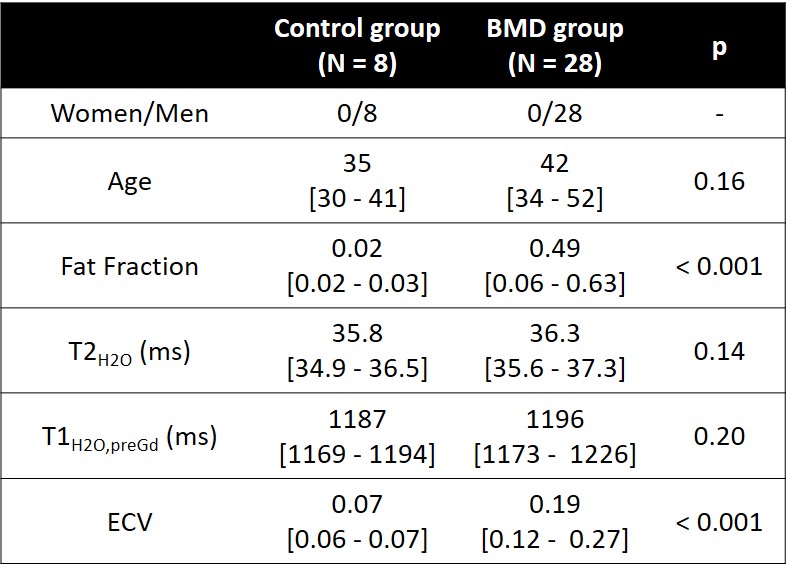
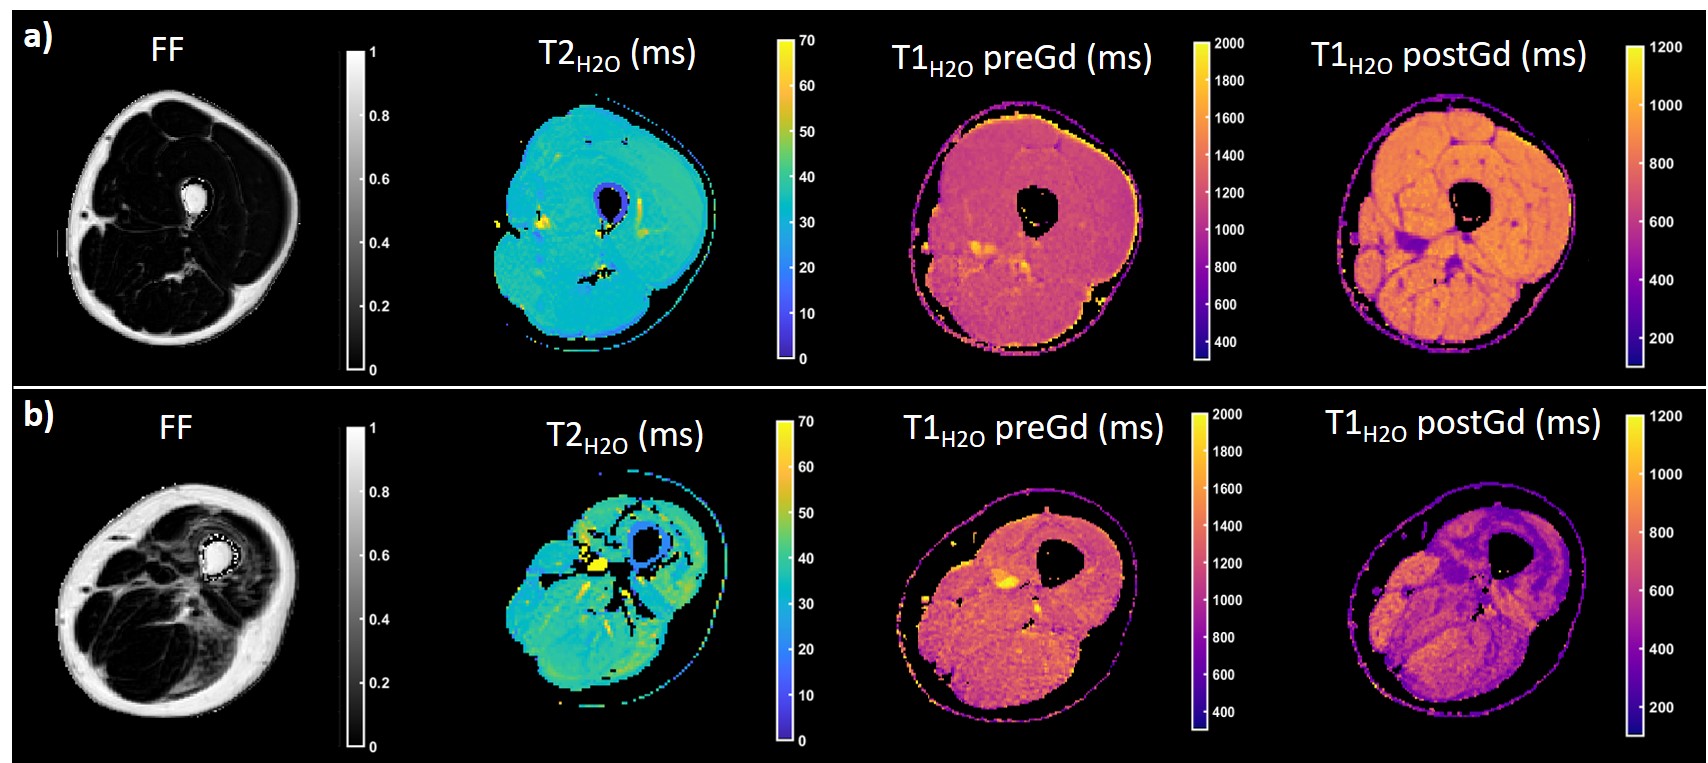
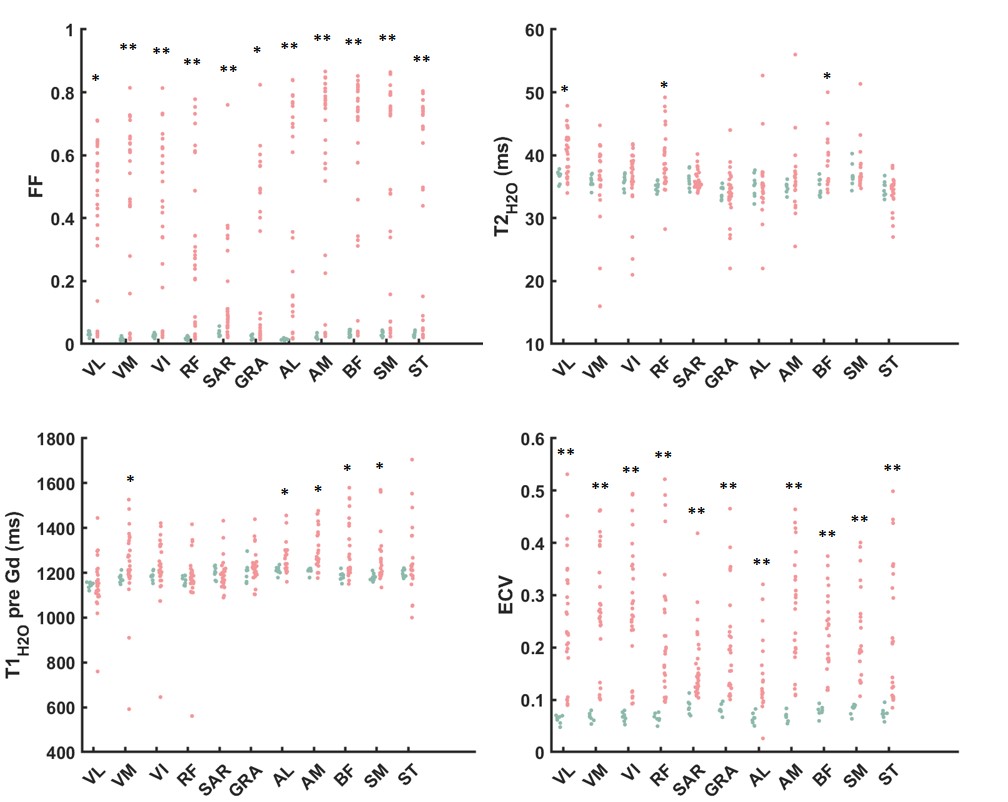
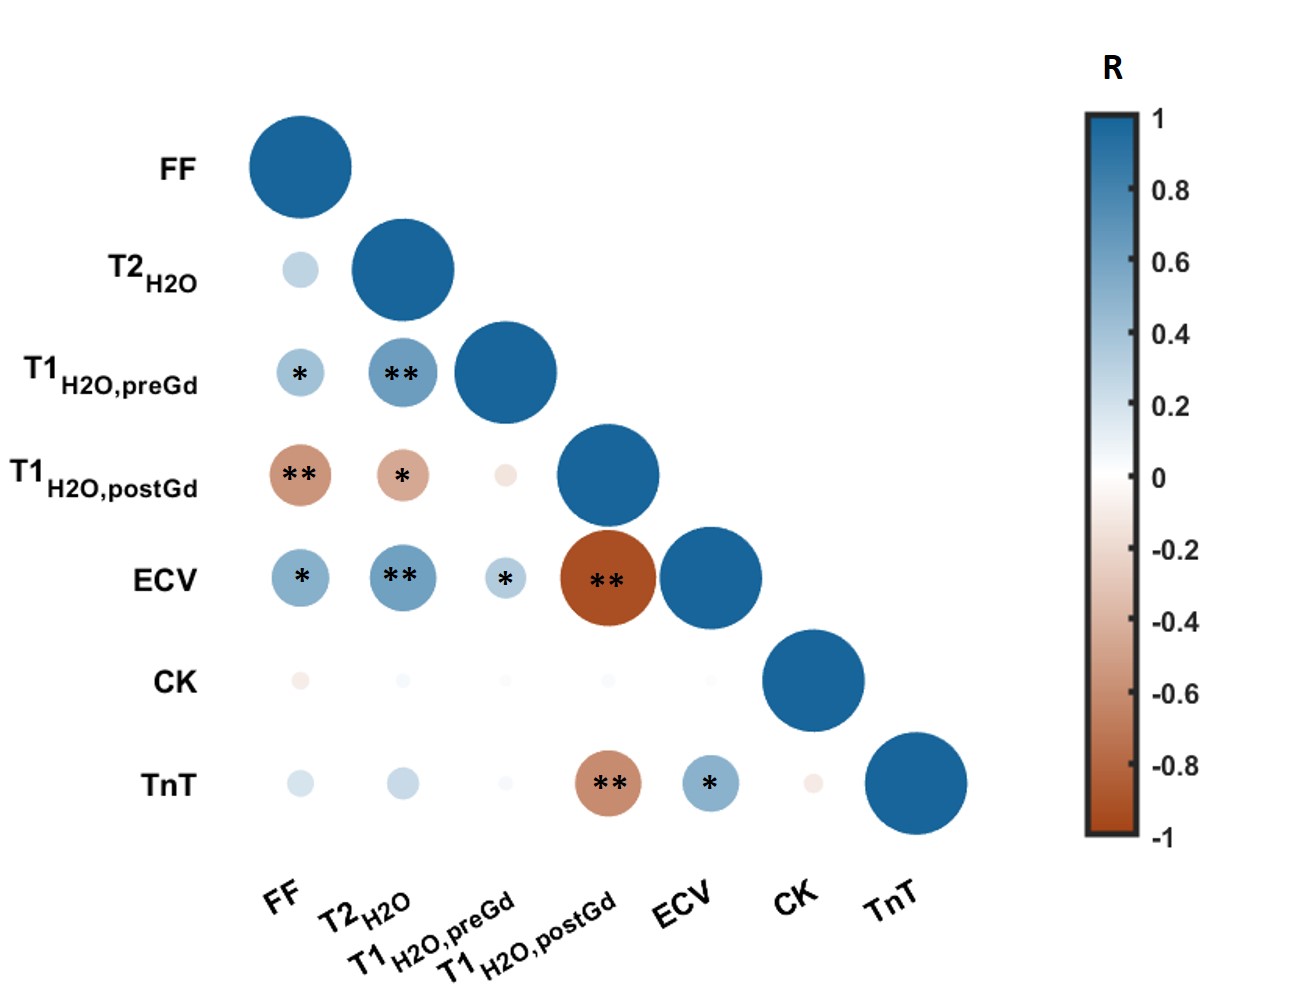
Figure 1 represents the FF, T2H2O, T1H2O,preGd and T1H2O,postGd maps obtained on a 31 year-old healthy control and a 26 year-old patient with BMD. Compared to the healthy control, the BMD patient presented drastically reduced T1H2O,postGd values in fatty replaced muscles (vasti lateralis/intermedialis, biceps femoris muscles) but also in some muscles with normal FF (semi-membranosus and semi-tendinosus muscles). Globally, BMD patients exhibited higher FF and ECV values compared to healthy volunteers, while T1H2O,preGd and T2H2O did not show significant variations (Table 1). The segmental analysis shows that all the muscles of BMD subjects presented elevated FF and ECV (figure 2). To a lesser extent, some muscles also presented increased T1H2O,preGd and T2H2O values. Interestingly, figure 3 indicates that the muscles of patients that did not present any fatty replacement (FF < 0.05) had an increased ECV compared to the muscles of healthy controls (p < 0.001), which was not the case for T1H2O,preGd nor T2H2O. In BMD patients, significant correlations were found between the different imaging biomarkers and between ECV (and T1H2O,postGd) and cardiac TnT (figure 4).DISCUSSION & CONCLUSION
We applied quantitative MRI in the skeletal muscle of subjects with Becker muscular dystrophy. Like others, we found that most patients experience muscle fatty replacement in the thigh muscles1 but that T2H2O was not globally increased compared to healthy controls, although individual muscles may have elevated values2,3. Using MR fingerprinting with water and fat separation, we found that T1H2O,preGd correlated well with T2H2O, as observed in a previous study on a more general NMD population12 and was not able to differentiate both groups. On the other hand, the estimation of the distribution volume of an extracellular contrast agent revealed that the ECV increases significantly in the BMD group compared to healthy controls and is already elevated in non-fatty replaced muscles. Finally, ECV significantly correlated with cardiac TnT levels. TnT is a complex regulating actin and myosin cross-bridge cycling in striated muscles which is often elevated in patients with neuromuscular diseases without cardiac involvement13. In conclusion, the measure of muscle ECV with MRF T1-FF represents a promising imaging biomarker for the early detection of skeletal muscle involvement in the dystrophic patients.Acknowledgements
This study was partly funded by ANR-20-CE19-0004References
1. Fischer D, Hafner P, Rubino D, et al. The 6‐minute walk test, motor function measure and quantitative thigh muscle MRI in Becker muscular dystrophy: a cross‐sectional study. Neuromuscul Disord. 2016;26(7):414‐422. 10.1016/j.nmd.2016.04.009
2. Wokke BH, Van Den Bergen JC, Hooijmans MT, Verschuuren JJ, Niks EH, Kan HE. T2 relaxation times are increased in skeletal muscle of DMD but not BMD patients. Muscle Nerve. 2016;53(1):38‐43. 10.1002/mus.24679
3. Marty B, Toussaint M, Gilles R, Wahbi K, Carlier P. Skeletal muscle tissue characterization of a large cohort of patients with Becker muscular dystrophy using quantitative NMR imaging. Neuromuscul Disord. 2017;27:S126‐S126. 10.1016/j.nmd.2017.06.125
4. Hooijmans MT, Froeling M, Koeks Z, et al. Multi-parametric MR in Becker muscular dystrophy patients. NMR Biomed. 2020:e4385.
5. Soslow JH, Damon SM, Crum K, et al. Increased myocardial native T1 and extracellular volume in patients with Duchenne muscular dystrophy. J Cardiovasc Magn Reson. 2016;18:5.
6. Marty B, Gilles R, Toussaint M, Béhin A, et al. Comprehensive evaluation of structural and functional myocardial impairments in Becker muscular dystrophy using quantitative cardiac magnetic resonance imaging. Eur Heart J Cardiovasc Imaging. 2019 Aug 1;20(8):906-915. doi: 10.1093/ehjci/jey209. PMID: 30590561.
7. Marty B, Carlier PG. MR fingerprinting for water T1 and fat fraction quantification in fat infiltrated skeletal muscles. Magn Reson Med. 2020 Feb;83(2):621-634. doi: 10.1002/mrm.27960. Epub 2019 Sep 10. PMID: 31502715.
8. Glover GH, Schneider E. Three-point Dixon technique for true water/fat decomposition with B0 inhomogeneity correction. Magn Reson Med. 1991 Apr;18(2):371-83. doi: 10.1002/mrm.1910180211. PMID: 2046518.
9. Azzabou N, Loureiro de Sousa P, Caldas E, Carlier PG. Validation of a generic approach to muscle water T2 determination at 3T in fat-infiltrated skeletal muscle. J Magn Reson Imaging. 2015 Mar;41(3):645-53. doi: 10.1002/jmri.24613. Epub 2014 Mar 3. PMID: 24590466.
10. Messroghli DR, Radjenovic A, Kozerke S, Higgins DM, et al. Modified Look-Locker inversion recovery (MOLLI) for high-resolution T1 mapping of the heart. Magn Reson Med. 2004 Jul;52(1):141-6. doi: 10.1002/mrm.20110. PMID: 15236377.
11. Arheden H, Saeed M, Higgins CB, Gao DW, et al. Measurement of the distribution volume of gadopentetate dimeglumine at echo-planar MR imaging to quantify myocardial infarction: comparison with 99mTc-DTPA autoradiography in rats. Radiology. 1999 Jun;211(3):698-708. doi: 10.1148/radiology.211.3.r99jn41698. PMID: 10352594.
12. Marty B, Reyngoudt H, Boisserie JM, Le Louër J, et al. Water-Fat Separation in MR Fingerprinting for Quantitative Monitoring of the Skeletal Muscle in Neuromuscular Disorders. Radiology. 2021 Sep;300(3):652-660. doi: 10.1148/radiol.2021204028.
13. Schmid J, Liesinger L, Birner-Gruenberger R, Stojakovic T, et al. Elevated Cardiac Troponin T in Patients With Skeletal Myopathies. J Am Coll Cardiol. 2018 Apr 10;71(14):1540-1549. doi: 10.1016/j.jacc.2018.01.070. PMID: 29622161.
Figures