1024
31P-MRS reveals oxidative capacities of red and white fibers in human muscle differ 7-fold in vivo1Child Health, University Medical Center Utrecht, Utrecht, Netherlands, 2Radiology and Nuclear Medicine, Amsterdam University Medical Center|location AMC, Amsterdam, Netherlands, 3Neurology and Neurosurgery, University Medical Center Utrecht, Utrecht, Netherlands
Synopsis
31P MRS has been used to non-invasively diagnose muscular mitochondrial dysfunction in disease. However, shifts in muscle fiber type composition due to muscle disuse are potential confounders since mitochondrial and capillary densities differ between fiber types. We obtained new quantitative information on this subject matter on basis of dynamic in vivo 31P MRS recordings from upper arm muscle of fourteen healthy subjects performing a maximal arm-cycling test. Analysis of the post-exercise time course of Pi in red and white myofiber pools distinguished by myoplasmic pH revealed a sevenfold difference in oxidative capacity between these fiber types in vivo.
Introduction
31P MRS has been used to non-invasively diagnose muscular mitochondrial dysfunction in primary and secondary myopathy (e.g. type 2 diabetes and heart failure)1. However, shifts in muscle fiber type composition due to muscle disuse are potential confounders2: large differences in both mitochondrial density as well as capillary embedding between red and white fiber types have been documented in rodent muscle3. Yet, only sparse quantitative information exists on differences in integrative oxidative capacity between these fiber types in human muscle in vivo. Specifically, Vandenborne et al reported a fivefold range in initial rate of post-exercise metabolism of inorganic phosphate (Pi) among distinct pools of fibers in calf muscle of healthy subjects with discrete myoplasmic pH values presumably corresponding to red, intermediate (IM) or white fiber types4. However, reproduction of this observation has proven difficult1. Here, we present novel in vivo 31P MRS observations on Pi metabolism in human biceps muscle of healthy individuals in response to a high-intensity arm-cycling test that afford revisiting this subject matter.Methods
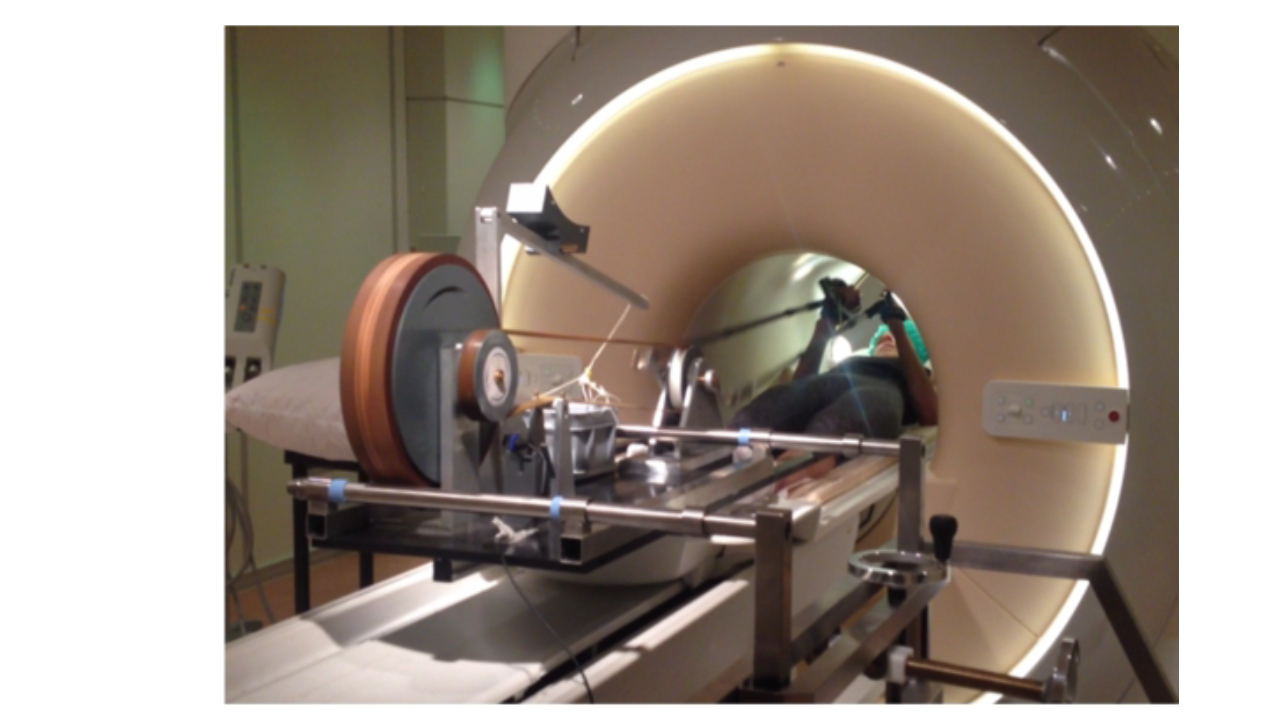
Ergometer: A previously described MR-compatible mechanically-braked bicycle ergometer adapted for asynchronous arm-cycling5 was fitted with a mounting system for the mobile Lode MR ergometer carrier (Lode, The Netherlands) allowing adaptable positioning over the patient bed of a 70-cm bore Philips Ingenia 3 Tesla MR system (Philips Healthcare, The Netherlands) (Figure 1).In vivo 31P-MRS: Healthy volunteers (18-55y/5M/9F) were positioned supine head-first on the patient bed of the MR scanner, lower arms upright at a 90o angle and upper arms stabilized by sandbag supports. A 6 cm diameter single turn 31P surface coil (Rapid Biomedical, Germany) was fastened over the biceps muscle of the right upper arm. Subjects were instructed by a coach to perform arm-cycling at 90 rpm by moving their lower arms between -45o and +45o in the z-direction on an audio signal. After a practice bout, subjects were moved into the magnet center and image-guided shimming was performed. In vivo 31P MR spectra from the biceps muscle were collected at rest, during arm-cycling and subsequent metabolic recovery (block pulse, flip angle 45°; TR: 4000 ms; NSA 2; 2048 data points; bandwidth 3000 Hz). Data acquisition during arm-cycling was synchronized with arm-cycling as described elsewhere5.
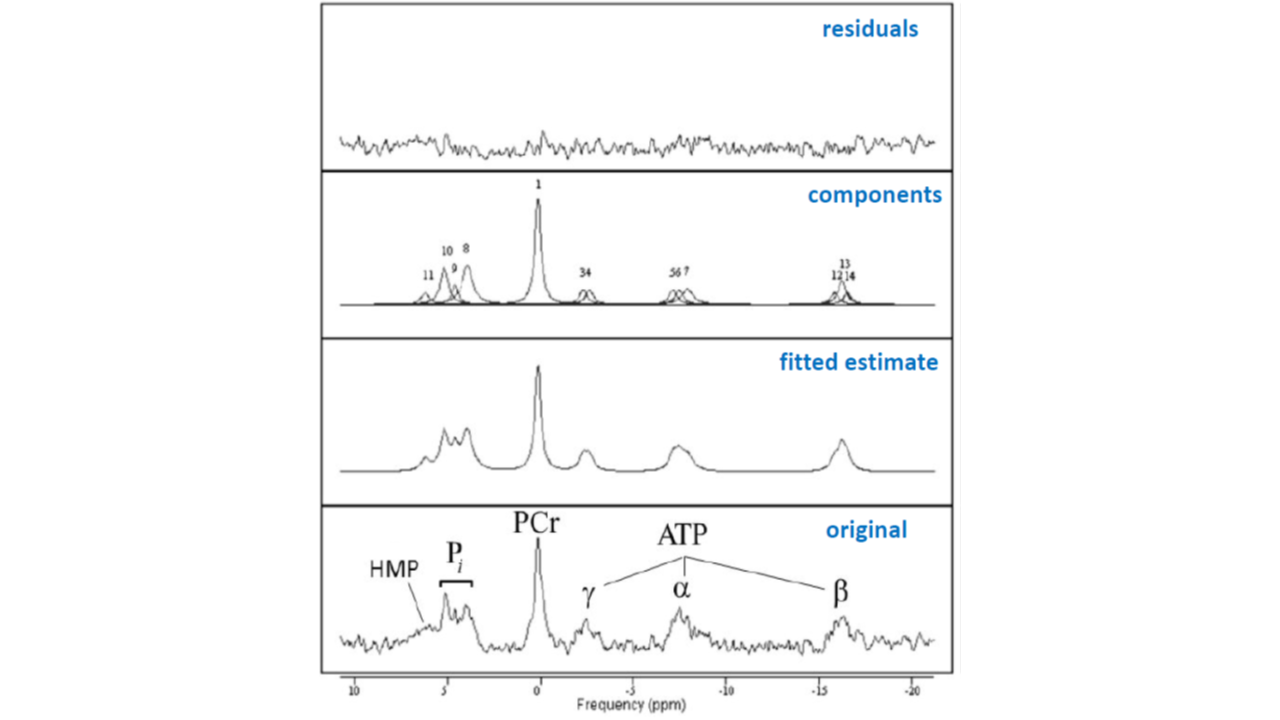
Data Processing and analysis: FIDs were analyzed using AMARES time domain fitting (www. jMRUI.org) with custom starting value- and prior knowledge files. Myofiber pH was derived from the chemical shift difference between inorganic phosphate (Pi) and phosphocreatine (PCr) resonances5. Post-exercise metabolic recovery kinetics were determined by nonlinear curve fitting of mono- or double-exponential functions (Origin, USA). Recovery times were quantified as ‘time to 95% of full recovery’ (95%RT; in s).
Results
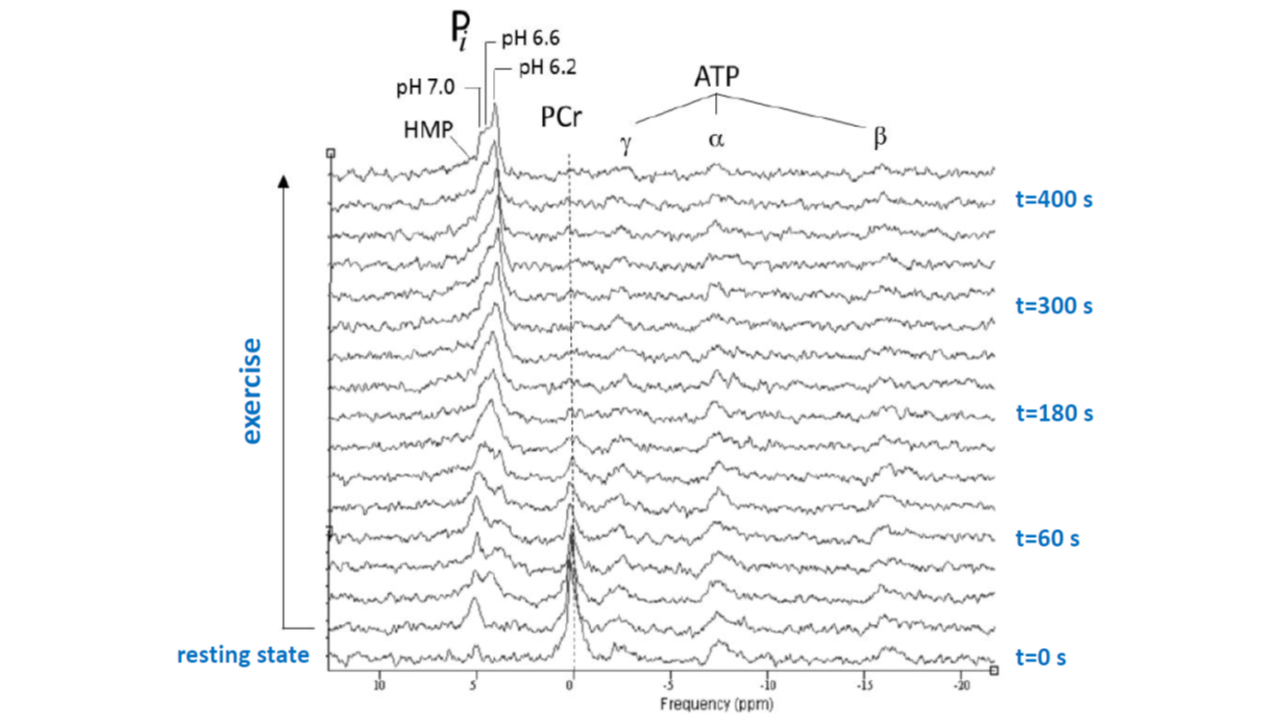
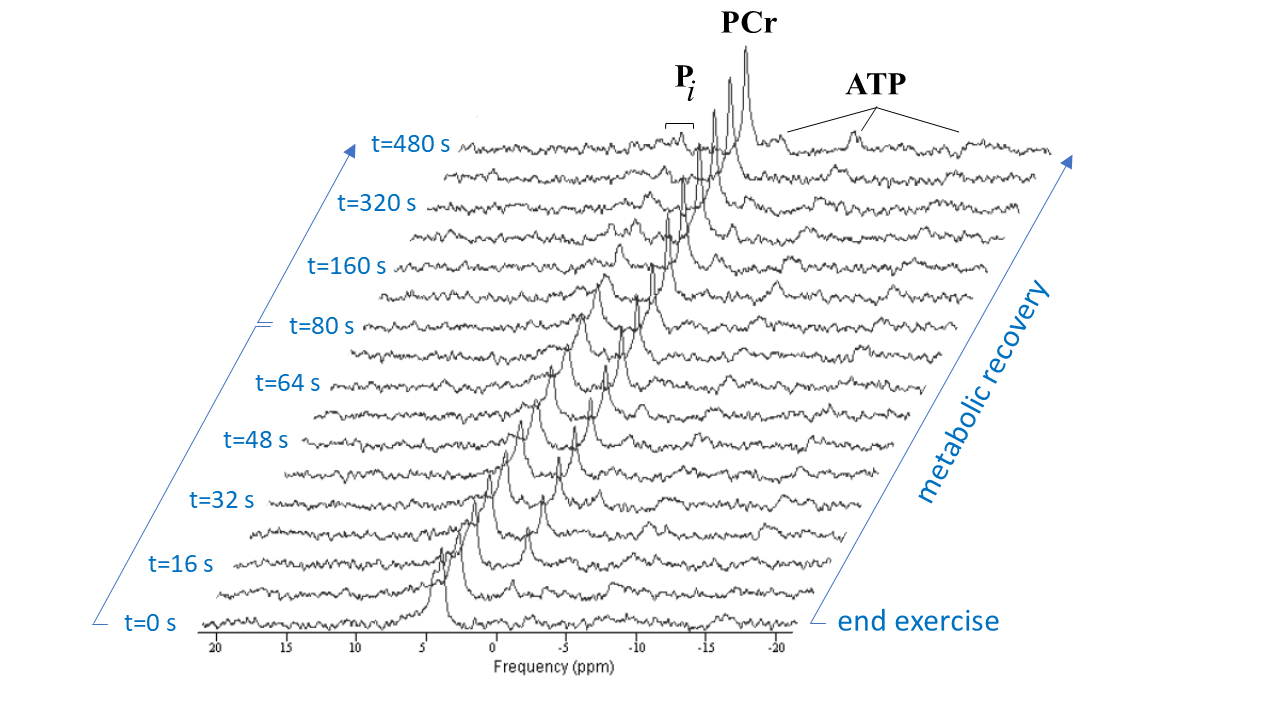
Figure 2 shows a stack plot of in vivo 31P spectra recorded from the biceps muscle of a study subject performing high-intensity arm-cycling for 7 min. The extraordinary temporal dynamics of multiple distinct resonances between 5.2 and 3.7 ppm downfield of PCr were observed in all subjects. These resonances were attributed to Pi accumulating in mechanically and metabolically distinct myofiber phenotypes associated with progressively recruited distinct motor units of the biceps muscle during voluntary arm-cycling. Figure 3 shows the results of AMARES fitting of the 31P MR spectrum at t=60 s identifying three distinct pools of accumulated Pi at myoplasmic pH vales of 7.1, 6.6 and 6.1, respectively, in the active biceps muscle that we attributed to recruited red, IM and white fibers, respectively3. Figure 4 shows a stack plot of in vivo 31P spectra recorded from the biceps muscle during post-exercise metabolic recovery. Myoplasmic pH in white fibers remained at 6 for minutes into recovery in all subjects (not shown). Quantitative analysis of 95RT for Pi_red, Pi_IM and Pi_white, respectively, in each subject yielded group average values (± SE) of 49 ± 10 s (n=9), 44 ± 9 s (n=6) and 340 ± 19 s (n=10), respectively. The ratio of 95RT_Pi_red/95%RT_Pi_white was 6.9 ± 1.7.Discussion
Post-exercise dynamics of Pi and PCr inform on the integrative oxidative ATP synthetic capacity of myofibers6 determined by their mitochondrial density as well as capillary contact points and embedding3. Recent advances in understanding of mitochondrial physiology explain why changes in myoplasmic pH do not affect the membrane potential that drives oxidative phosphorylation7. As such, the post-exercise recovery time of Pi accumulated in distinct pools of fibers with discrete myoplasmic pH values during preceding exercise informs on the integrative oxidative capacity of each pool. Our finding of a sevenfold range in Pi 95%RT and therefore integrative oxidative capacity among red, white and IM fiber types in human muscle agrees well with the sole previous in vivo finding in a human limb muscle4. Notably, this number is of the same order of magnitude as the difference in capillary contact points between red and white fibers documented in murine muscle3. The latter is interesting in light of the classic notion that the oxygen consumption capacity of skeletal muscle far outstrips the blood supply capacity of the central circulation8.Acknowledgements
This work was supported by grants from the Prinses Beatrix Foundation for Muscular Disease and the Spieren voor Spieren Foundation in the Netherlands.References
1. Meyerspeer M, Boesch C, Cameron D et al (2020) 31P magnetic resonance spectroscopy in skeletal muscle: Experts’ consensus recommendations. NMR Biomed 34: e4246
2. Mancini D, Walter G, Reicheck N et al (1992) Contribution of skeletal muscle atrophy to exercise intolerance and altered muscle metabolism in heart failure. Circulation 85:1364-73.
3. Glancy B, Hsu LY, Dao L et al (2014) In vivo microscopy reveals extensive embedding of capillaries within the sarcolemma of skeletal muscle fibers. Microcirculation 21: 131-47.
4. Vandenborne K, McCully K, Kakihira H et al (1991) Metabolic heterogeneity in human calf muscle during maximal exercise PNAS 88: 5714-18.
5. Vegter RJ, van den Brink S, Mouton LJ et al (2021) MR-compatible arm-crank ergometry: a new platform linking whole body calorimetry to upper-extremity biomechanics and arm muscle metabolism. Front Physiol 12: 5995
6. Meyer RA (1988) A linear model of muscle respiration explains monoexponential phosphocreatine changes Am J Physiol 254: C548-53.
7. Schlame M (2019) Mitochondrial cristae as insulated transformers of metabolic energy. EMBO J 38: e103472.
8. Andersen P, Saltin B (1985). Maximal perfusion of skeletal muscle in man. J Physiol 366: 233-249.
Figures