1021
Assessment of skeletal muscle energy metabolism by 31P MRS in COVID19 and Multiple Sclerosis patients: technical and clinical insights1Université de Lyon, INSA-Lyon, Université Claude Bernard Lyon 1, UJM-Saint Etienne, CNRS, Inserm, CREATIS UMR 5220, U1206, Lyon, France, 2Siemens Healthineers, Saint-Denis, France, 3Wolfson Brain Imaging Center, University of Cambridge, Cambridge, United Kingdom, 4LIBM - Laboratoire Interuniversitaire de Biologie de la Motricité,Université Jean Monnet Saint Etienne, Université Claude Bernard Lyon 1, Université Savoie Mont Blanc, Saint-Etienne, France, 5Department of Radiology, Michigan State University, East Lansing, MI, United States, 6anaesthetics and intensive care department, UJM-Saint-Etienne, Centre Hospitalier Universitaire de Saint-Étienne, Saint-Etienne, France
Synopsis
Dynamic 31P MRS was performed during a standardized exercise of the lower leg, in patients with chronic fatigue enrolled in 2 clinical studies: multiple sclerosis patients and COVID19 patients that were hospitalized in intensive care unit and requiring respiratory assistance. In this work, we also revisit certain assumptions on the metabolite T1 and question shortcuts often made to shorten 31P protocol for a better patient’s compliance.
Introduction
Evaluating skeletal muscle energy metabolism is of medical interest in monitoring neuromuscular degenerative or cardiovascular diseases and evaluating muscle fatigability. 31P-MRS is a non-invasive technique of choice to dynamically assess the concentration of phosphorylated metabolites, which are directly related to the respiratory capacity of mitochondria1-3. However, implementing a standardized dynamic acquisition protocol that can be transposed to different longitudinal studies on large patient cohort raises methodological questions. Therefore, dynamic 31P MRS during a standardized lower leg exercise was performed in patients enrolled in 2 clinical studies, exploring chronic fatigue in, respectively, multiple sclerosis (MS) patients and COVID19 patients hospitalized in intensive care unit with respiratory assistance. This work also discusses assumptions and shortcuts often made to shorten the 31P protocol for better patient compliance.Material & Method
NMR spectroscopy and imaging were performed on a 3T clinical MRI (MAGNETOM PRISMA, Siemens Healthineers). 31P-MRS acquisitions were performed in 36 MS patients, 18 COVID19 patients, and 35 matched controls (age/weight/sex). The non-localized MR-FID sequence implements saturation bands obtained with adiabatic pulses to minimize the signal from unstressed muscle and bone4. Two additional acquisitions were made with TR=30sec (12 acquisitions) and TR=4sec (32 acquisitions) at rest and before exercise to obtain spectra in the resting state. T1 was estimated with monoexponential fit, for each metabolite to determine the correction factors. The platform was equipped with an MRI-compatible ergometer (ErgoSpect), with its calf module (Trispect). Subjects were lying supine with the dual 1H/31P surface coil (Rapid GMBH) under its calf muscle. The dynamic acquisitions included the rest phase of 40s (10 acquisitions), and an exercise phase lasting 2min (30 acquisitions); the patients were asked to perform periodic ergometer-controlled plantar flexions every 4s, synchronized with the MRS acquisitions, and a final recovery and resting phase of 6min (90 acquisitions).The data were processed using MatLab (The MathWorks) and the QUEST (QUantitation based on QUantum ESTimation) method5. After a manual phasing of the data using PhaseTool GUI6, a 5 Hz exponential apodization filter, QUEST metabolite basis set, was used as prior knowledge and was constituted with Phosphocreatine (PCr), Inorganic Phosphate (Pi), α-, β-, and γ-Adenosine Tri Phosphate (ATP). The cQUEST implementation estimated amplitude, frequency, and phase parameters for each metabolite. A mono-exponential fit was performed on the PCr amplitude recovery period to extract the rate of PCr resynthesis (τPCr). The millimolar concentration assessment of phosphorus metabolites was based on the standard assumption that [ATP] is 8.2 mmol/L cellular water1. The pH was calculated from the frequency difference between PCr and Pi, as proposed in 3, 7. The concentration of diprotonated phosphate, [H2PO4-], can be calculated according to 7. The concentration of adenosine diphosphate (ADP) can be calculated as a function of pH and PCr, assuming creatine kinase (CK) balance3. We also examine PCr hydrolysis during plantar exercise. To assess the qualtity of the fit, the resulting residual signals (raw spectra minus estimated spectra) were used over the whole dynamic experiment. Comparisons between the three groups were performed for all measured parameters using a one-way ANOVA with Bonferroni adjusted multiple comparisons using Stata17(College Station, USA). Statistical significance was set to p<0.05.
Results
We observed significant differences between the two populations and the healthy controls for the τPCr, resting [Pi], [ADP], and [H2PO4] (Table). Significant differences between MS and controls were also found for the T1, resting and post-exercise [PCr]. A significant difference between COVID19 and controls was found for resting and post-exercise [PCr], post-exercise [H2PO4] and pH change.Discussion
In five COVID-19 patients, metabolite concentrations (ATP, PCr) were greatly diminished during the exercise protocol initially suggesting profound metabolite depletion (Figure 1). More than the signature of an underlying physiological process, such abnormal behaviors, with measured amplitudes of PCr and Pi peaks that do not present the expected inverse behavior during the exercise (Figure 1 left), are likely to result from a displacement of the investigated leg during the requested effort. Our processing routine allows us to reveal these anomalies and adjust the first point of the τPCr fit manually. The visual peak of Pi between the 39th and 42nd acquisitions serves as an objective criterion to determine the onset of the recovery phase. In case no precautions are taken, the rate of change of the τPCr depending on the choice of the first point can vary up to 70% (Figure 2). Finally note that a significant difference was found between the T1PCr of MS patients and controls. This supports the choice of a protocol with long TR measurement in order to take into account metabolite T1 weighting for each subject measurement. A slight trend of increasing metabolite T1 was observed in the studied patient populations; however, this observation cannot be generalized to other populations.Conclusion
In the context of translating a methodological protocol to a broader scale applicable in clinical studies, vigilance points are mandatory throughout the process, from acquisition to quantification. Quality control should be done during the acquisitions and processing of the data. Longitudinal studies are needed to explore the capacity of the metabolic parameters to catch disease progression in MS, or healing in COVID19, and their relationship to other functional parameters or fatigue.Acknowledgements
This work was partly supported by the LABEX PRIMES (ANR-11-LABX-0063), Siemens Healthineers and Jabrane Karkouri was supported by the European Union’s Horizon 2020 research and innovation programme under grant agreement No 801075.
References
1. G. J. Kemp, M. Meyerspeer, and E. Moser, “Absolute quantification of phosphorus metabolite concentrations in human musclein vivo by31P MRS: a quantitative review,” NMR Biomed., vol. 20, no. 6, pp. 555–565, Oct. 2007, doi: 10.1002/nbm.1192.
2. A. Santos-Díaz and M. D. Noseworthy, “Phosphorus magnetic resonance spectroscopy and imaging (31P-MRS/MRSI) as a window to brain and muscle metabolism: A review of the methods,” Biomedical Signal Processing and Control, vol. 60, p. 101967, Jul. 2020, doi: 10.1016/j.bspc.2020.101967. [3] M. Meyerspeer et al., “31P magnetic resonance spectroscopy in skeletal muscle: Experts’ consensus recommendations,” p. 22.
4. Y. Luo, R. A. de Graaf, L. DelaBarre, A. Tannús, and M. Garwood, “BISTRO: An outer-volume suppression method that tolerates RF field inhomogeneity: B 1 -Insensitive Outer-Volume Suppression,” Magn. Reson. Med., vol. 45, no. 6, pp. 1095–1102, Jun. 2001, doi: 10.1002/mrm.1144.
5. H. Ratiney, M. Sdika, Y. Coenradie, S. Cavassila, D. van Ormondt, and D. Graveron-Demilly, “Time-domain semi-parametric estimation based on a metabolite basis set,” NMR Biomed., vol. 18, no. 1, pp. 1–13, Feb. 2005, doi: 10.1002/nbm.895.
6. P. Blümler, MATLAB NMR-Library. Mainz, Germany: Max Planck Institute for Polymer Research. [Online]. Available: https://www.blogs.uni-mainz.de/fb08-physics-halbach-magnets/software/
7. C. W. Sundberg, R. W. Prost, R. H. Fitts, and S. K. Hunter, “Bioenergetic basis for the increased fatigability with ageing,” J Physiol, vol. 597, no. 19, pp. 4943–4957, Oct. 2019, doi: 10.1113/JP277803.
Figures
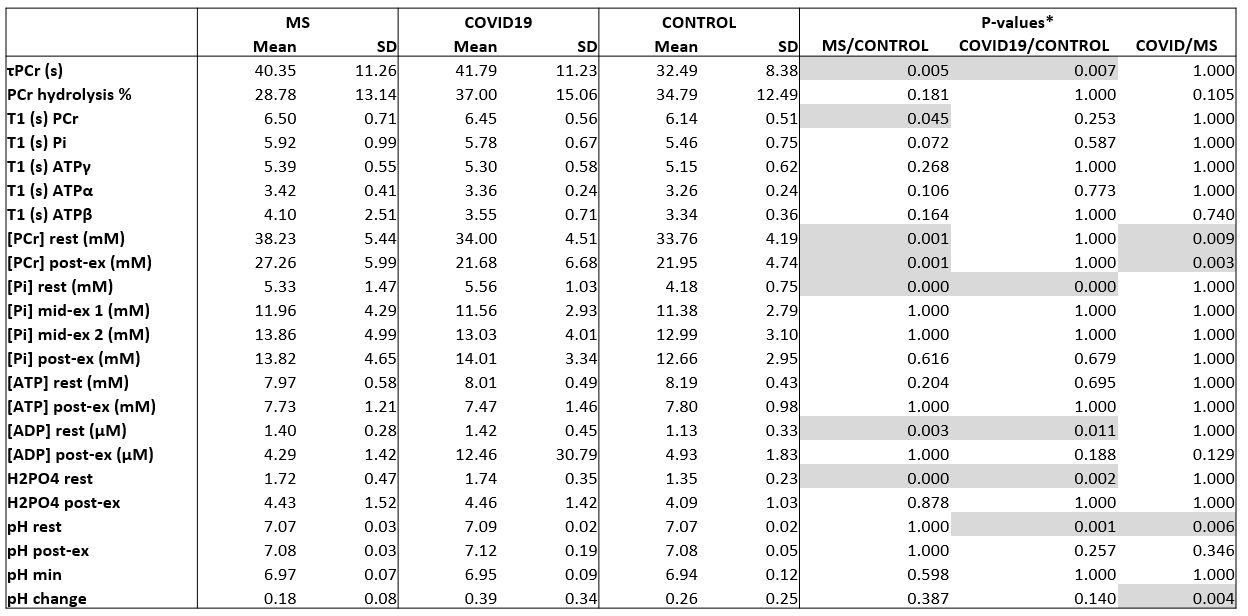
Table: Results obtained on the three patient cohorts, mean and standard deviation. T-test results between MS and COVID19 populations versus controls. *one-way ANOVA with Bonferroni adjusted multiple comparisons using Stata17(College Station, USA). Statistical significance was set to p<0.05.
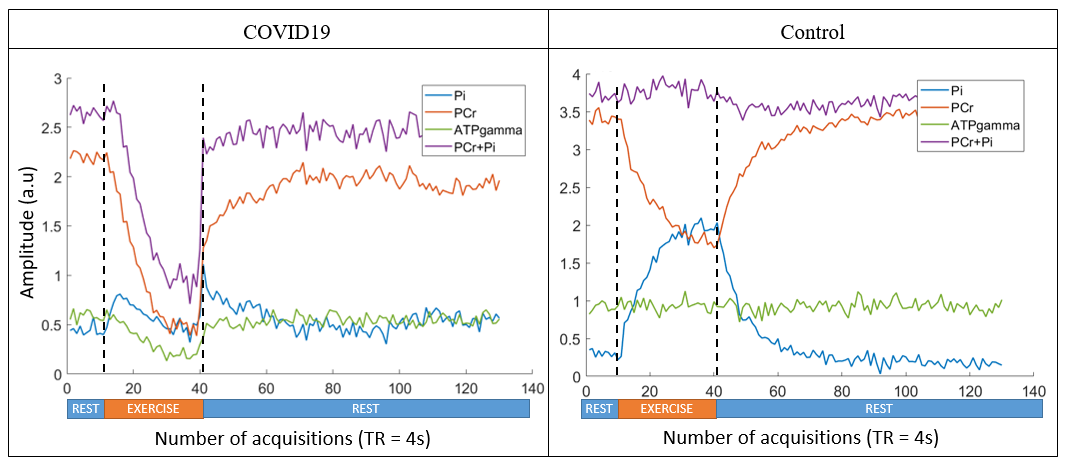
Figure 1: Metabolite amplitudes during the protocol. Left: Patient of the COVID19. Right: Control. Highlighting of the exercise and rest phases. During the exercise phase, the COVID19 patient shows abnormal attenuation of these metabolite signals.
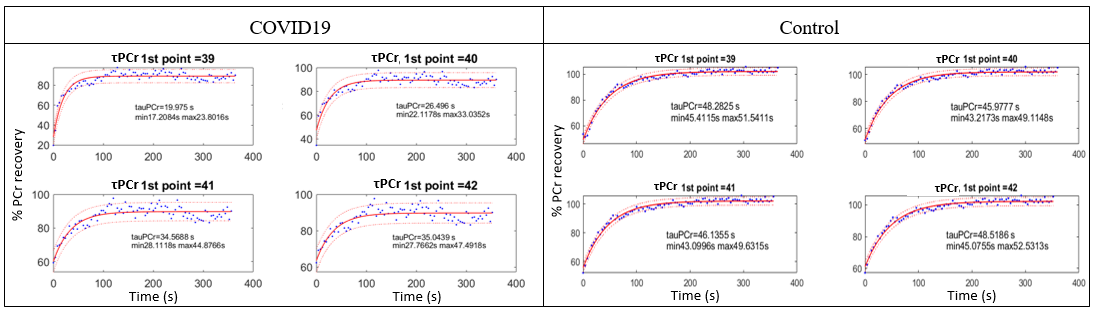
Figure 2: PCr fit procedure to trace back to TauPCr and result according to the first point considered. Left: Patient of the COVID19 cohort. Right: Control. For the COVID19 patient, the variation of the PCr rate according to the first point is consequent.