1013
Comparison of T2*-weighted image analysis with quantitative T2* maps in different stages of myocardial infarction in a pig model study with 7T cMRI1Chair of Molecular and Cellular Imaging, Comprehensive Heart Failure Center, University Hospital Wuerzburg, Wuerzburg, Germany, 2Department of Internal Medicine I, Cardiology, University Hospital Wuerzburg, Wuerzburg, Germany
Synopsis
In the field of ultra-high field MRI, T2* mapping is a promising technique for the non-invasive assessment of myocardial pathophysiology. Preclinical studies have already shown the potential to detect structural changes in infarcted myocardial tissue. Quantitative T2* imaging is very demanding with regard to measurement- and postprocessing time. Hence, we compared in this study the simpler and faster grayscale analysis of T2*-weighted images with quantitative T2* techniques. This was done in early and late acute infarct healing stages in a large animal model by comparing T2* maps with grayscale T2*-weighted images.
Introduction
In the field of ultra-high field MRI, T2* mapping is a promising technique for the non-invasive assessment of myocardial pathophysiology. Although T2* maps are mainly used in clinical practice to detect iron accumulation, preclinical studies have already shown that they have the potential to detect structural changes in infarcted myocardial tissue [1, 2]. The reliable T2* mapping computations require multiple gradient echo (mGRE) images with incrementing echo time (typically n>5) that limit both temporal and spatial resolution. The consideration of this study was whether analysis of a limited number (n=2) of 7T cMRI T2*-weighted images could provide sufficient information for clinically relevant aims regarding early (3-4 days) and late (10-14 days) myocardial tissue changes after myocardial infarction. We compared pixel- and segment-based quantitative T2* maps with analysis of the grayscale T2*-weighted images performed using widely available free software for MR-image analysis.Methods
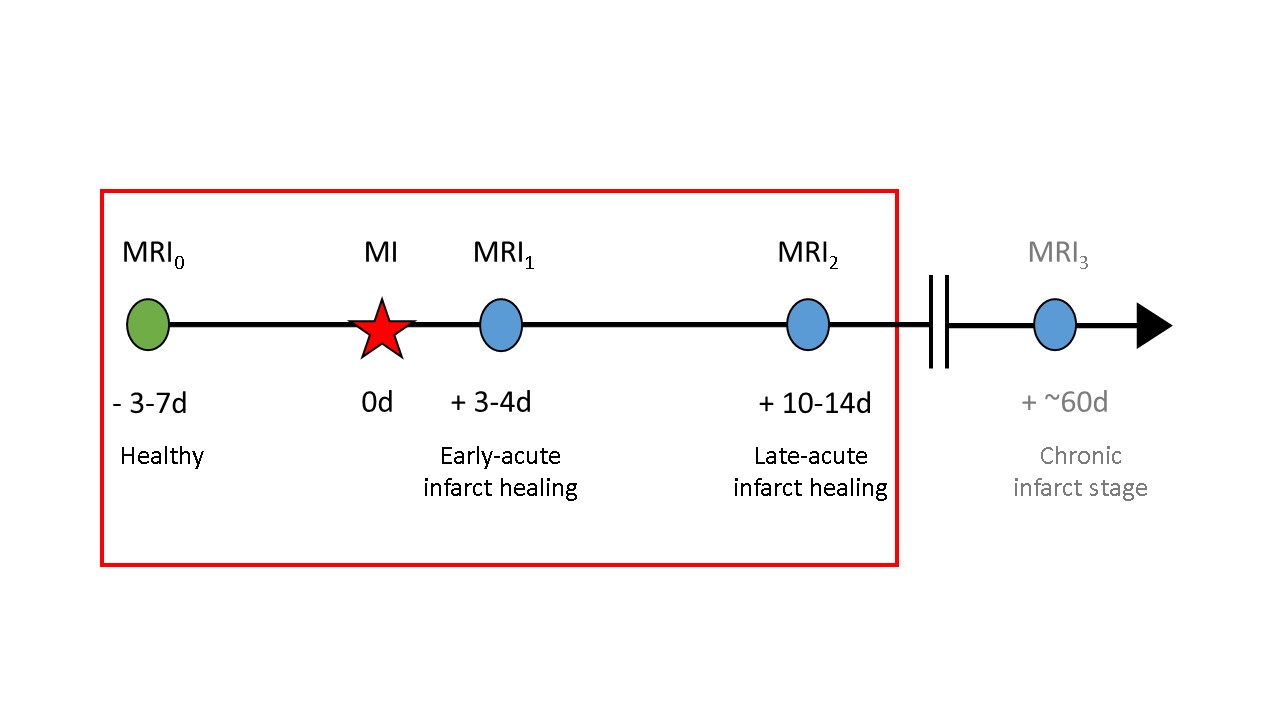
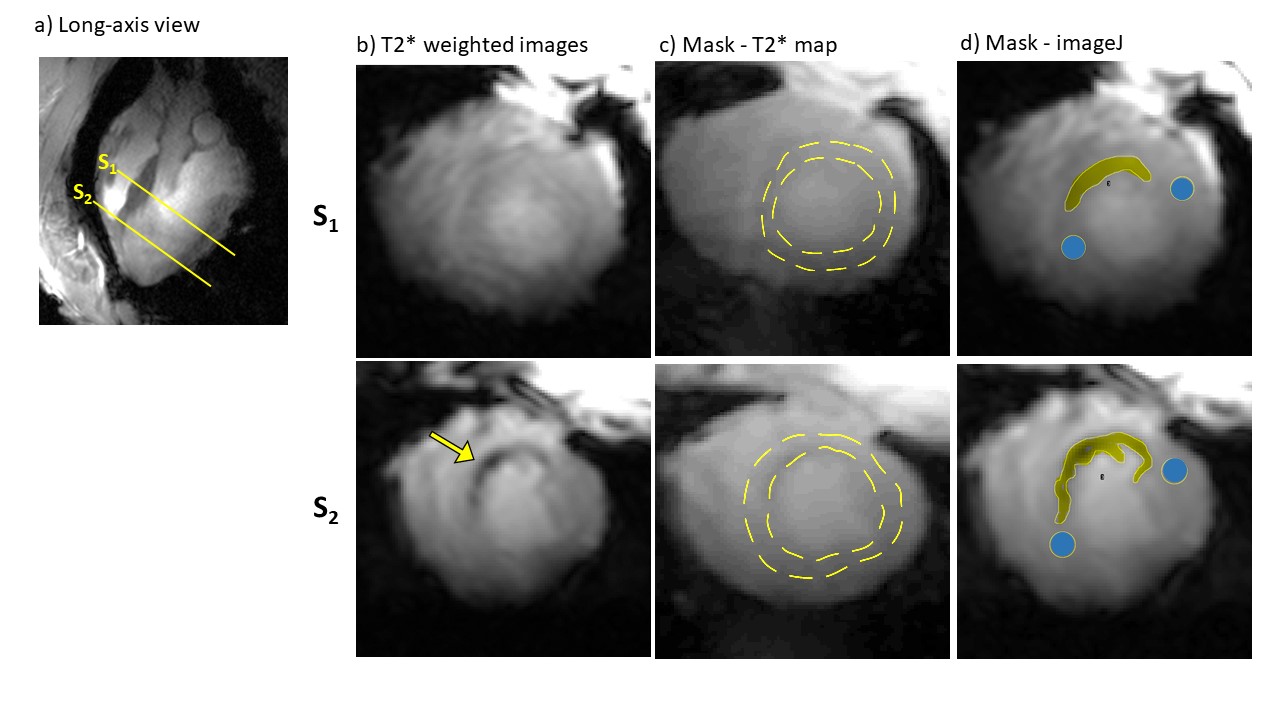
With permission of the local Animal Welfare Committee (55.2 DMS 2532-1134-16, Government of Lower Franconia), 8 German landrace pigs were included in our study. We induced myocardial infarction (MI) with an occlusion of the left anterior descending artery (LAD), followed by reperfusion after 90 minutes. 3 in-house designed weight-matched 8Tx/16Rx cardiac array coils were used for measurements on the Magnetom™ "Terra" 7T MR scanner (Siemens, Erlangen, Germany) [3]. 4 MRI scans were performed: MRI0 (3-7 days pre-MI), MRI1 (3-4 days post-MI), MRI2 (10-14 days post-MI) and MRI3 (~60 days post-MI), corresponding to early and late acute healing and chronic MI stage (Figure 1). In this study, only the images of MRI0-MRI2 were considered. To obtain good image quality, the T2* measurements were cardiac triggered by an acoustic system (EasyACT, MRI.Tools). Using the multi-echo gradient echo sequence, 9 TE times ranging from 1.1-14.6ms and an in-plane pixel size of 2.2x2.5mm were recorded with a contiguous stack (10-13 slices of 6mm thickness) in short-axis heart view orientation. The analysis of T2* was performed in 3 different ways (Figure 2). After manual segmentation of the inner and outer contours of the left ventricle in the short-axis view, the pixel-based T2* maps of the left-ventricle were computed. Afterwards, the splitting of the myocardium contours according to the AHA scheme [4] was done and segment-based T2* maps were generated. The in-house developed Matlab scripts (Mathworks, Natrick, USA) were used in both cases. The T2* data analysis was performed with the free software imageJ (https://imagej.net). The infarcted region and two reference (remote) areas on both sides were selected by the operator based on the optically observed contrast difference. Grayscale mean value (Gm) and standard deviation (Gstd) in these areas were measured in the echo 1 and echo 5 images to compute the relative grayscale value contrast (GR = Gm(TE=1.09ms)/Gm(TE=4.83ms)) and the coefficient of variation (CoV=Gstd/Gm).Results
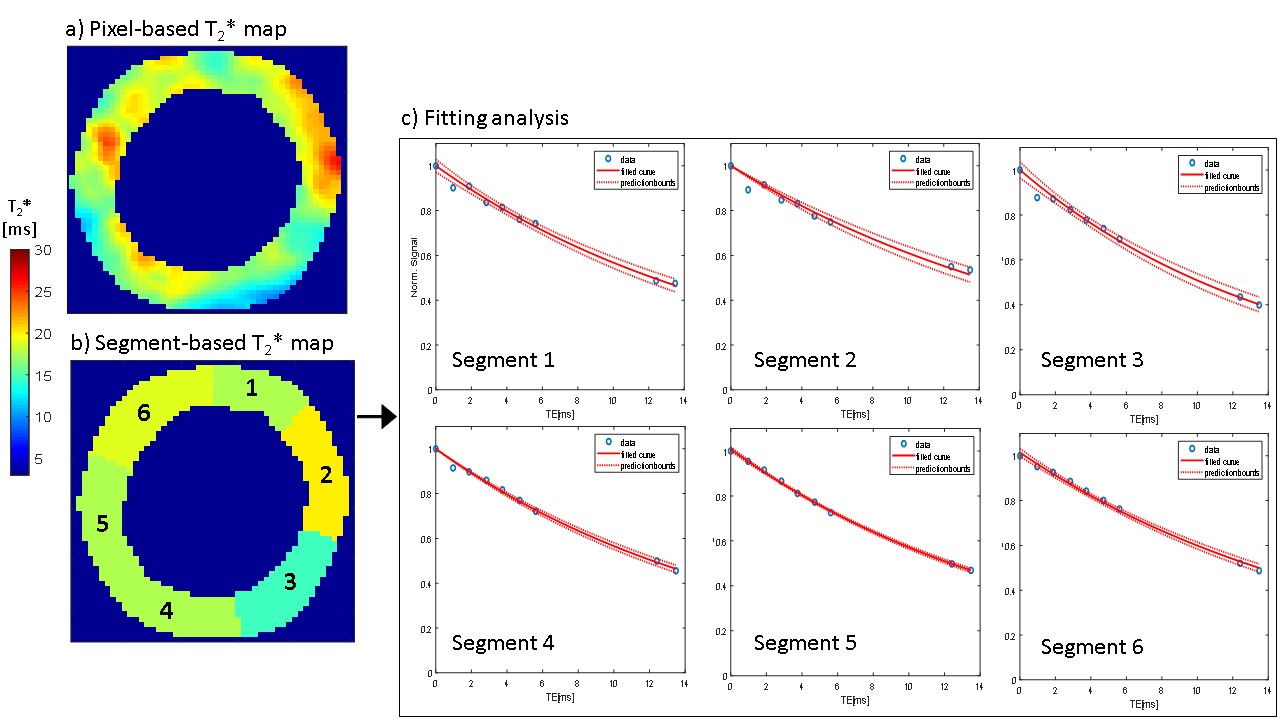
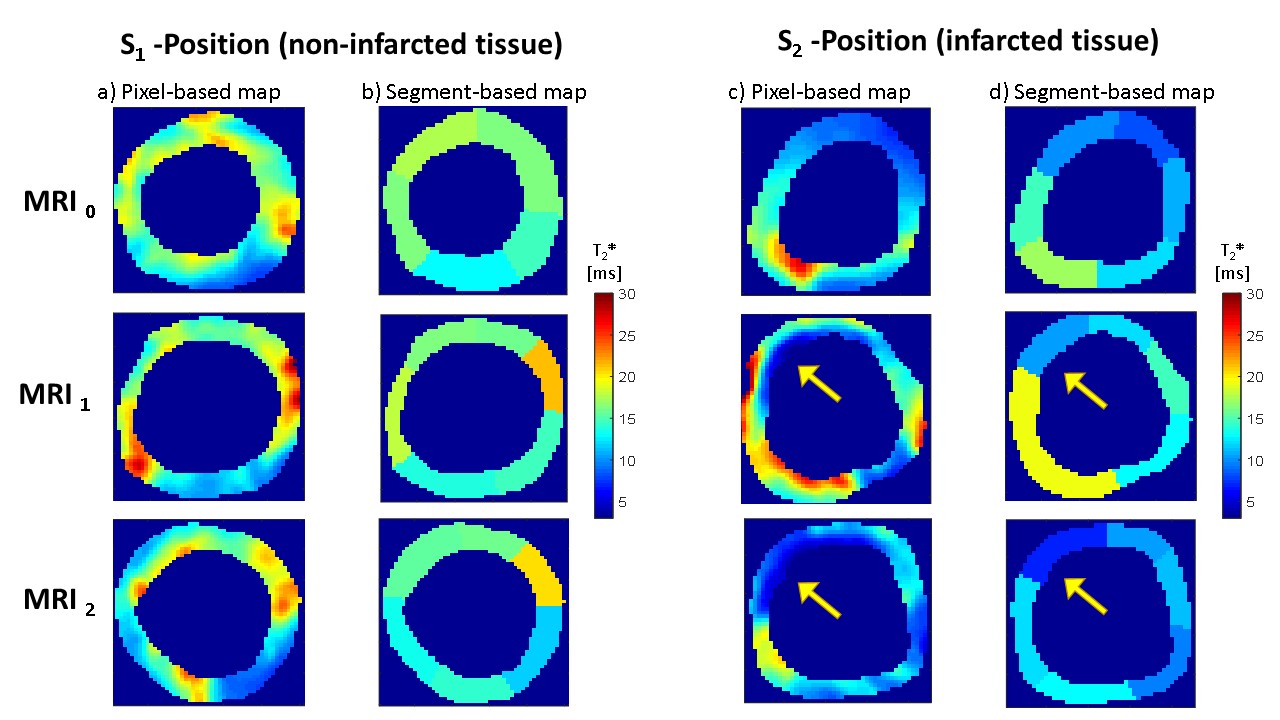
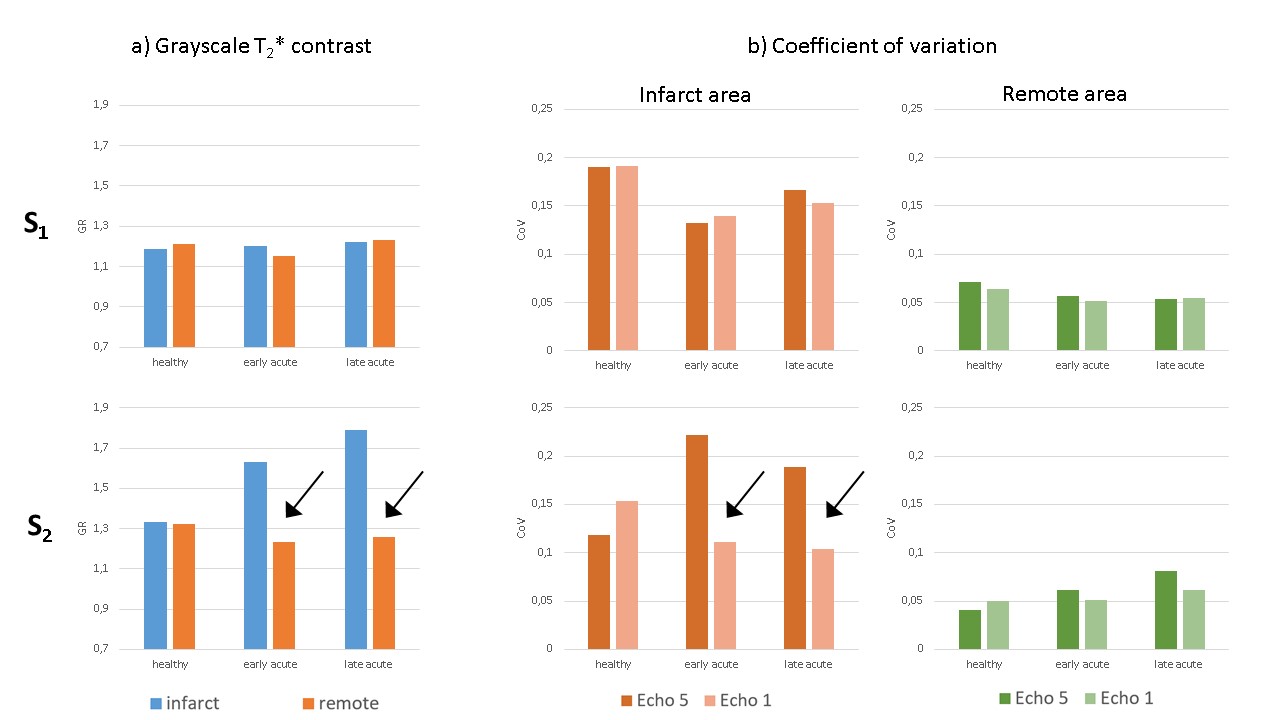
Infarct tissue shows a strong signal reduction in the T2*-weighted images compared to non-infarcted tissue (Figure 2). Figure 3 demonstrates the generation of pixel- and segment-based T2* maps with typical T2* values in the range of 10-20ms throughout the myocardium. One should notice that posterior and lateral wall segments have a native reduction of T2* due to increased susceptibility influence at the interface with lung tissue not fully compensated by the B0-shimming [5]. Figure 4 shows examples of the evolution of T2* in maps in 2 different positions. S1 position shows the native distribution of T2* in tissue non-affected by MI (localisation: basal to the MI), while S2 position is located in the infarcted zone. T2* values are significantly reduced in infarcted tissue. This effect is observed in both early and late acute infarct healing stages. Figure 5 shows the results of the analysis of the grayscale in T2*-weighted images. Both the T2* relative grayscale contrast and the coefficient of variation (CoV) show the significant difference in the infarcted and non-infarcted regions.Discussion
Our results show that for early and late infarct healing stages tissue alterations can be identified by both full T2* maps reconstruction and the simplified grayscale analysis using T2*-weighted images. Comparing the relative grayscale contrast, the infarcted zone shows significantly higher values than in non-infarcted tissue (MRI0 and S1-position). The difference of CoV of echoes 1 and 5 varies between 0.3 (non-infarct) to 0.8-1.0 (infarct). To exclude the possibility that this development over time is physiological, both the remote and infarcted areas are shown in the S1 position to demonstrate that the values remain similar in echoes 1 and 5 (b). Since we expect T2*-weighted images to provide similar information to T2* maps, it may be possible to optimize T2* analysis. In particular, it might be possible to reduce the number of images measured (instead of 9 echoes needed for generating the T2* maps, we assume that 2 echoes are sufficient). This leads not only to a higher spatial resolution but also to a considerable reduction of the measurement time within one cardiac phase. The analysis itself can be simplified, as no IT knowledge, but also no expensive licenses for professional software (e.g. MEDIS Suite) are required.Conclusion
Manual grayscale contrast analysis may be an additional and potentially complementary and simpler method to T2* maps to analyze cardiac tissue remodeling in early and late acute infarct healing stages.Acknowledgements
Financial support: German Ministry of Education and Research (BMBF, grants: 01EO1004, 01EO1504) Steven Nguyen and Dr. Oleg Poznansky are acknowledged for their help in the animal experiments and Alena Kollmann for discussion on data processing.
Parts of this abstract will be used in the medical doctor thesis of Julia Aures.
References
[1] Hülnhagen T, Paul K, Ku M-C, Serradas Duarte T, Niendorf T. Myocardial T2* mapping with ultrahigh field magnetic resonance: Physics and frontier applications. Front Phys. 2017;5: 22
[2] Köhler S., Hiller KH, Waller C, Jakob PM, Bauer WR, Haase A. Visualization of myocardial microstructure using high-resolution T2* imaging at high magnetic field. Magn Reson Med. 2003;49: 371– 375
[3] Elabyad IA, Terekhov M, Lohr D et al. A Novel Mono-surface Antisymmetric 8Tx/16Rx Coil Array for Parallel Transmit Cardiac MRI in Pigs at 7T. Sci Rep. 2020;10, 3117
[4] Cerqueira M, Weissman N, Dilsizian V, Jacobs A, Kaul S et al. Standardized myocardial segmentation and nomenclature for tomographic imaging of the heart: a statement for healthcare professionals from the Cardiac Imaging Committee of the Council on Clinical Cardiology of the American Heart Association. Circulation. 2002;105: 539–542
[5] Hock M, Terekhov M, Stefanescu MR, Lohr D, Herz S, Reiter T, Ankenbrand M, Kosmala A, Gassenmaier T, Juchem C, Schreiber LM. B0 shimming of the human heart at 7T. Magnetic Resonance in Medicine. 2021;85, 182–196
Figures