1011
Clinical evaluation and reproducibility of 3D whole-heart free-breathing joint T1/T2 quantification with isotropic resolution.1School of Biomedical Engineering and Imaging Sciences, King's College London, London, United Kingdom, 2MR Research Collaborations, Siemens Healthcare Limited, Frimley, United Kingdom
Synopsis
Myocardial tissue characterization including quantification of fibrosis and oedema plays an important role in the evaluation of many myocardial diseases. T1 and T2 maps are typically acquired sequentially in 2D under several breath-holds. However, misregistration artifacts, spatial resolution and volumetric coverage remain a limitation. To address this, a high resolution, 3D whole-heart motion-compensated joint T1/T2 water/fat sequence has been proposed and validated in a phantom and in healthy subjects. Here, we demonstrate the feasibility of the proposed approach to simultaneously acquire whole-heart co-registered T1, T2 maps as well as water and fat volumes in ~9min in patients with cardiovascular disease.
Introduction
Myocardial tissue characterization including quantification of fibrosis and oedema plays an important role in the evaluation of many myocardial diseases1. T1 mapping has proven to be a valuable tool to assess acute ischemic injury or amyloidosis among other diseases, while T2 mapping has shown value for assessing inflammation2,3. T1 and T2 maps are typically acquired sequentially in 2D under several breath-holds2,4. However, misregistration artifacts, low through-plane spatial resolution and incomplete myocardial coverage remain limitations. To address this, a high resolution, motion-compensated joint T1/T2 water/fat sequence has been recently proposed and validated in phantom and healthy subjects5. In this study, we demonstrate the feasibility of the proposed approach to obtain whole-heart, motion-compensated, simultaneously acquired, and co-registered T1, T2 maps as well as water and fat images in ~9min in patients with cardiovascular disease.Methods
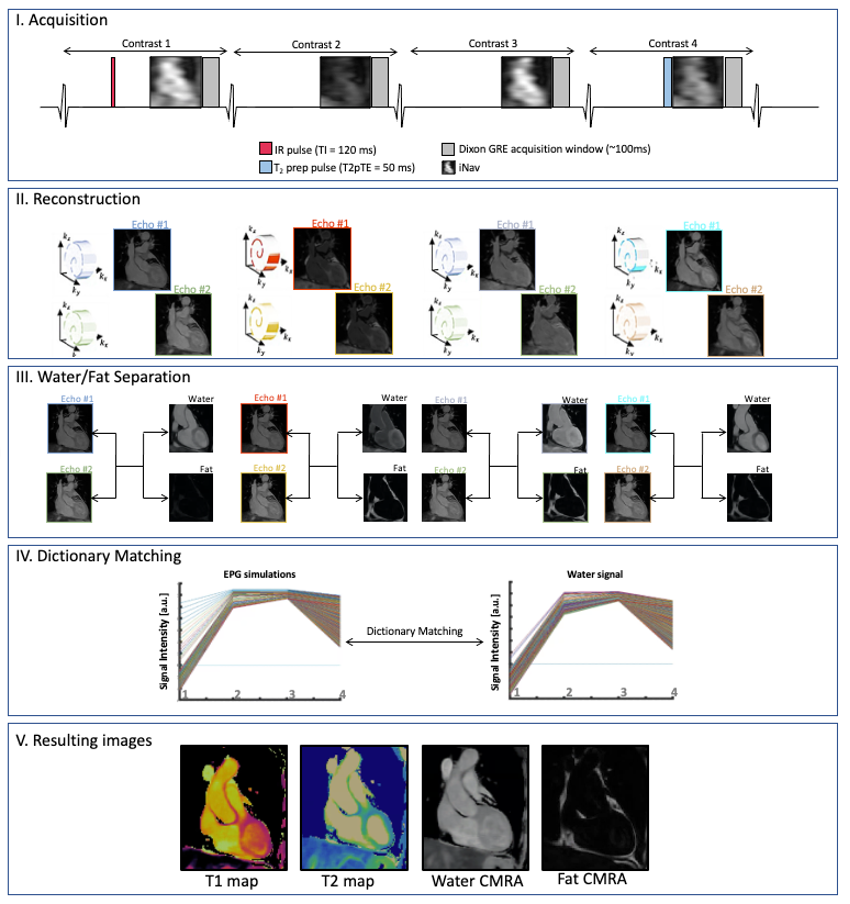
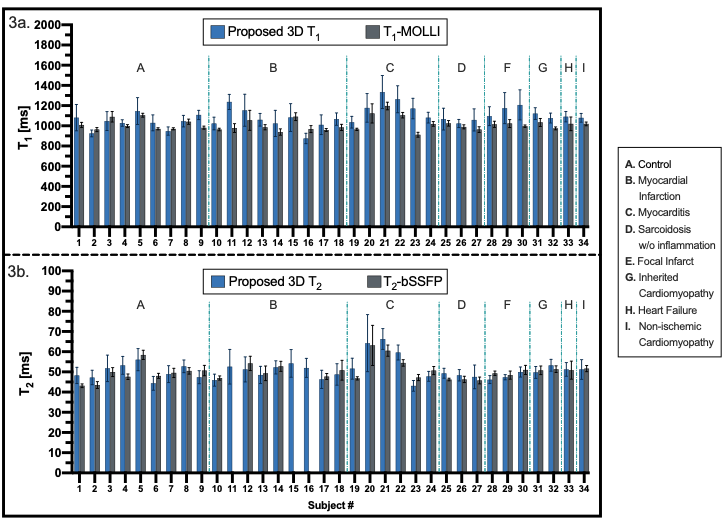
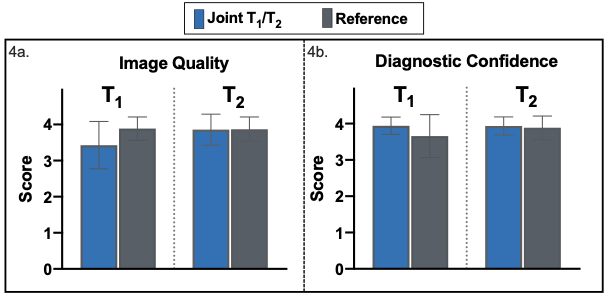
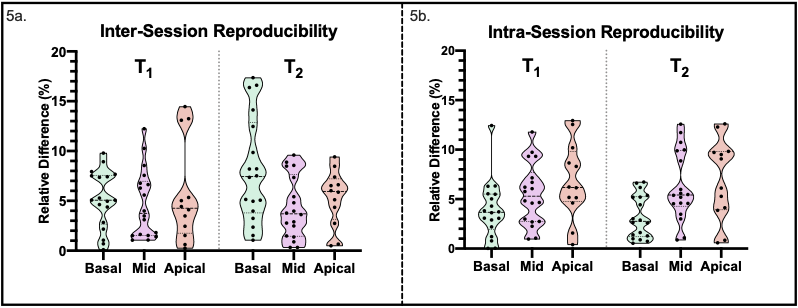
The joint T1/T2 prototype sequence3 (Fig. 1) consists of four interleaved, ECG-triggered spoiled gradient-echo 3D volumes with 2-point bipolar Dixon encoding acquired with a 4x-undersampled Variable Density Cartesian trajectory4. The first and fourth volume were preceded by an inversion recovery (TI=120ms) pulse and a T2-preparation pulse (T2prep duration=50ms) respectively, whereas no magnetization preparation pulses were applied prior to the second and third volume. Non-rigid motion corrected reconstruction was applied to each in- and out-of-phase volume, employing multi-contrast patch-based higher-order low-rank regularization5. A water-fat separation algorithm6 was then applied, and water image signal evolution across the four volumes was obtained voxel-wise. A patient-specific dictionary of pre-calculated T1/T2 combinations was simulated using Extended-Phase-Graph (EPG7) simulations and matched against the measured water image signal evolution. Thirty-four adult participants with suspected cardiovascular disease (n=34; 11 female; mean age=53±12y, body mass index=28.4±5.9kg/m2) were scanned on a 1.5T scanner (MAGNETOM Aera, Siemens Healthcare, Erlangen Germany). Acquisition parameters included FA=8˚, 2 mm3 isotropic resolution, subject specific mid-diastolic trigger-delay and acquisition window of ~100ms, TR=6.67ms, TE1/TE2=2.38/4.76ms, total scan time=~9min. Multi-slice pre- and post-contrast T1-MOLLI and T2-bSSFP maps, as well as Late Gadolinium Enhanced (LGE) images were acquired in a short axis (SA) orientation at the apical, mid-cavity and basal levels for comparison and as part of clinical routine. The 3D whole-heart co-registered T1/T2 maps were segmented in SA orientation. Subsequently, multi-slice AHA 16-segment8 bullseye plots were generated and a quantitative comparison between joint T1/T2 maps and their respective reference scans was performed at basal, mid-ventricular and apical levels. The 17th apical segment was excluded from all analyses due to expected high variability. Image quality and diagnostic confidence of joint T1/T2 maps against reference maps were evaluated by two expert readers using a 4-point Likert scoring scale ranging from 1 (uninterpretable maps / no diagnostic confidence) to 4 (neglectable blurring or residual artifacts / full diagnostic confidence) for image quality / diagnostic confidence respectively. In addition, an in vivo reproducibility study was carried out on three healthy subjects (n=3; 2 female, mean age = 31±2 years) throughout two different sessions (mean interval = 780 ± 15 days) to assess inter-session reproducibility. Each subject underwent two consecutive scans during the second session to assess intra-session reproducibility. The corresponding quantitative analysis was performed segment-wise.Results
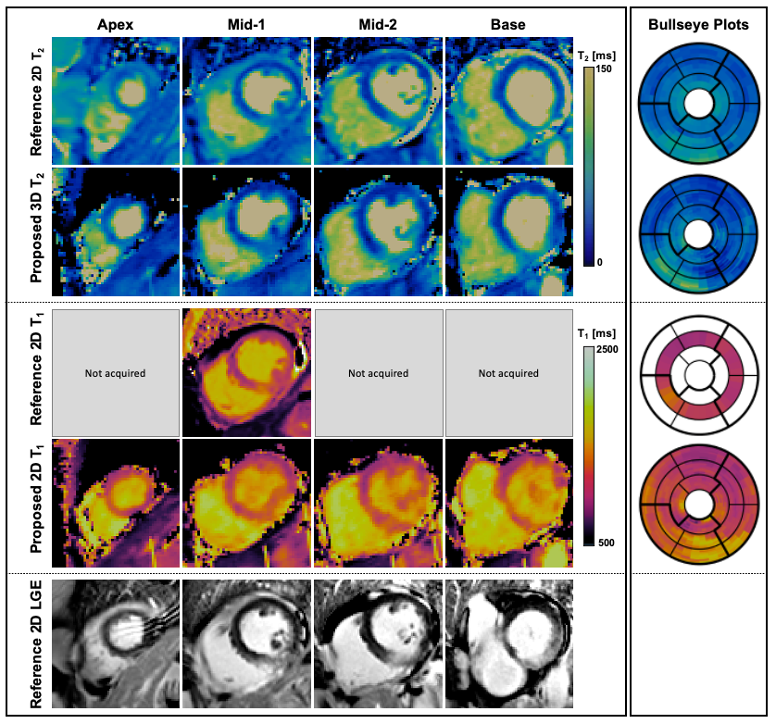
Short-axis motion-corrected joint T1/T2 maps, with their corresponding reference maps, along with LGE images in short-axis orientation, are shown in Fig. 2 for a representative patient presenting with an acute myocardial infraction in the right coronary artery (RCA) territory. Increased myocardial T1 and T2 values in the basal to mid-inferoseptum and inferior wall, extending to the apical inferior wall are observed in the proposed joint T1/T2 maps and confirmed by the reference parametric maps in the slices available, plus a near transmural sub-endocardial enhancement of the basal to mid-inferoseptum and inferior wall in the LGE scan. The extension of the abnormal T1 values is better perceived in the proposed whole-heart T1 map, compared to the single-slice T1-MOLLI scan available only at mid-ventricular level. Fig. 3 shows T1 and T2 quantification from proposed joint T1/T2 maps and their reference maps for each subject of the clinical study. Quantification was performed over all available slices for each AHA segment that correspond to mid-ventricular level (i.e., segments 7-12). Image quality and diagnostic confidence (Fig. 4) show similar scores for the proposed and reference methods. Reproducibility study (Fig. 5) show an inter-session variability of 5.1±3.7 % and 5.2±3.4% for T1 and T2 respectively and intra-session variability of 6.0±4.3 % and 5.3±3.6 % for T1 and T2 respectively.Discussion and Conclusions
The proposed free-breathing motion corrected 3D joint T1/T2 sequence allows the acquisition of isotropic T1and T2 maps and complementary co-registered water and fat visualization in a single scan with a total scan time of ~9 min. The technique has been validated in patients presenting with diverse cardiovascular diseases with low inter-session and intra-session variances demonstrating its potential to identify T1 and T2 alterations associated with cardiovascular diseases that might be otherwise missed through incomplete coverage by the multi-slice alternatives currently present in the clinical routine.Acknowledgements
This work was supported by the following grants: EPSRC 1) EP/P032311/1; 2) EP/P007619/1; 3) EP/P001009/1; 4) EP/V044087/1; the Wellcome/EPSRC Centre for Medical Engineering (WT 203148/Z/16/Z), and Fondecyt 1210637. This research was supported by the Department of Health through the National Institute for Health Research (NIHR) comprehensive Biomedical Research Centre award to Guy’s & St Thomas’ NHS Foundation Trust in partnership with King’s College London and King’s College Hospital NHS Foundation Trust and by the NIHR MedTech Co-operative for Cardiovascular Disease at Guy’s and St Thomas’ NHS Foundation Trust.References
1. Kim, P.K. et al. Korean J. Radiol. (2017). 18:113-131. doi:10.3348/kjr.2017.18.1.113
2. Messroghli, D.R. et al. J. Cardiovas. Magn. Reson. (2017). doi:10.1186/s12968-017-0389-8.
3. Milotta, G. et al. Magn. Reson. Med. (2020). doi:10.1002/mrm/28330.
4. Prieto C. et al. J. Magn. Reson. Imaging. (2015). doi:10.1002/jmri.24602
5. Bustin A. et al. Magn. Reson. Med. (2018). doi:10.1002/mrm.27354.
6. Liu J. et al. Magn. Reson. Med. (2016). 78(5):1862-1869. doi:10.1002/mrm.26569.
7. Weigel M. J. Magn. Reson. Imaging. (2015). doi:10.1002/jmri.24619.
8. Cerqueira M. et al. Circulation. (2002). doi:10.1161/hc0402.102975.
Figures