1008
Chemical Shift Artifact Correction for 19F MRI using Spectral Hadamard Encoding1Radiology - Medical Physics, University Medical Center, Faculty of Medicine, University of Freiburg, Freiburg, Germany, 2Cardiology and Angiology I, University Medical Center, Faculty of Medicine, University of Freiburg, Freiburg, Germany
Synopsis
Chemical shift artifact correction is achieved via spectral Hadamard encoding of the individual resonances using composite RF pulses. During decoding individual images of the resonances are created that can be combined to a final composite image. The method is demonstrated in 19F MRI of perfluorooctyl bromide that can be used to label monocytes for inflammation. Compared to other correction methods Hadamard decoding can be implemented directly in the image reconstruction, and the full SNR advantage of the image combination can be realized.
Introduction
19F MRI of fluorinated substances such as perfluorocarbons (PFC) has been used to study tissue oxygenation, temperature, or inflammation. In inflammation studies, PFCs are intravenously injected into the blood stream where they are taken up by monocytes that migrate to the inflamed tissue [1-2]. Several PFCs have been proposed for 19F MRI such as perfluoro-15-crown-5 ether (PFCE) or perfluorooctyl bromide (PFOB) [3]. PFCE is advantageous for MRI as it has only a single resonance, but it persists in liver and spleen for several months which makes it unsuitable for human use. PFOB on the other hand has already been safely applied in clinical studies as part of a blood substitute, but it has a more complex 19F spectrum leading to chemical shift artifacts during 19F MRI.Several correction methods exist for chemical shift artifacts such as deconvolution [4-6] or cycled readout gradients [7]. Spectral deconvolution is in general an ill-posed mathematical problem leading to a high noise sensitivity, and cycled RO gradients require computationally intensive reconstructions. Here we introduce an alternative method for chemical shift artifact correction which is based on spectral Hadamard encoding of the different PFOB resonances with a subsequent shift correction and superposition of the signal intensities.
Methods
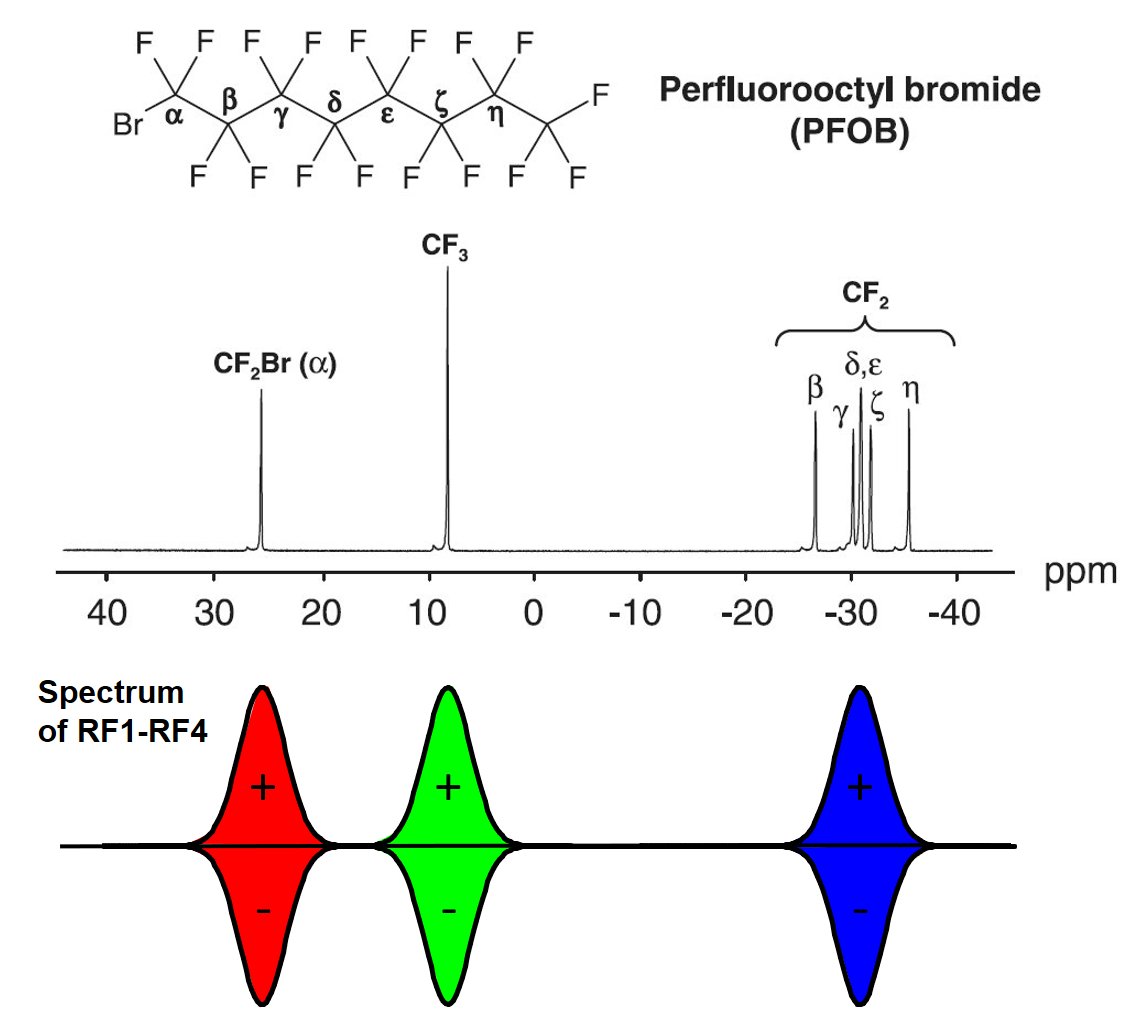
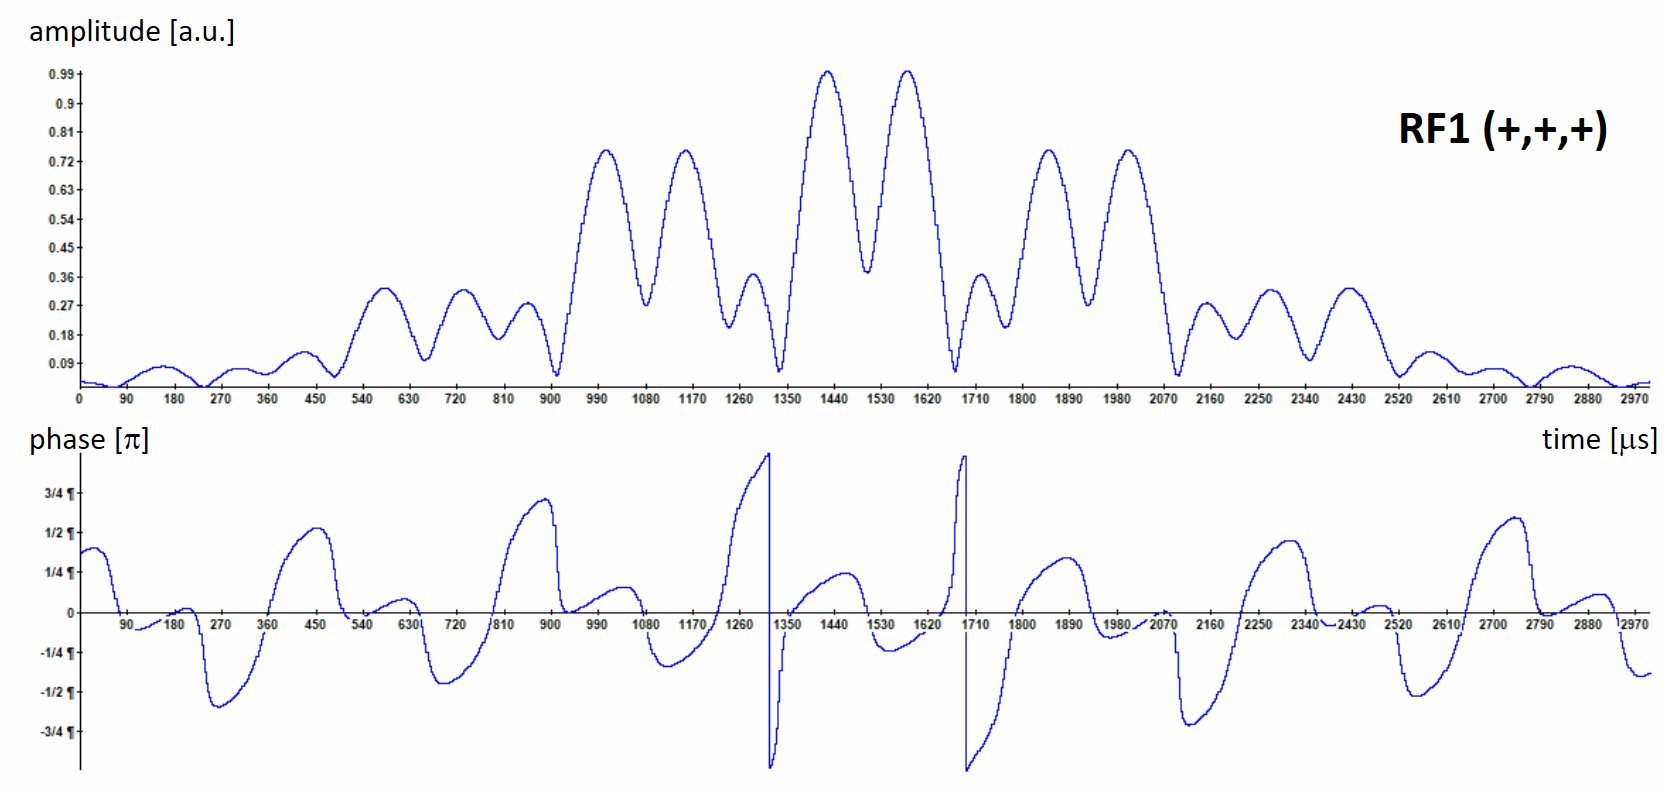
The 19F PFOB spectrum has three distinct resonance regions [8]: the CF2Br resonance at $$$\delta_1$$$=26.7ppm, the central CF3 resonance at $$$\delta_2$$$=8.6ppm, and the complex CF2 resonances (β-η) centered at $$$\delta_3$$$=‑31.5ppm (Fig. 1). In 19F MRI at 3T with a readout bandwidth of 260Hz/px these resonances lead to chemical shift artifacts in readout direction that are separated by up to 26 pixels.To separate these resonances, 4 composite excitation pulses RF1-RF4 were calculated that excite each resonance $$$(\delta_1,\delta_2,\delta_3)$$$ with a Gaussian pulse (width: 10 ppm). The sign of the individual excitations in RF1-RF4 was changed using a Hadamard encoding scheme, i.e. in RF1 the signs were $$$(+,+,+)$$$, in RF2 $$$(+,-,+)$$$, in RF3 $$$(+,+,-)$$$ and in RF4 $$$(+,-,-)$$$. Thus, the signal of the individual resonances can be separated by a pointwise linear combination of the 4 images $$$ S_i $$$ acquired with RF pulse $$$ i $$$:
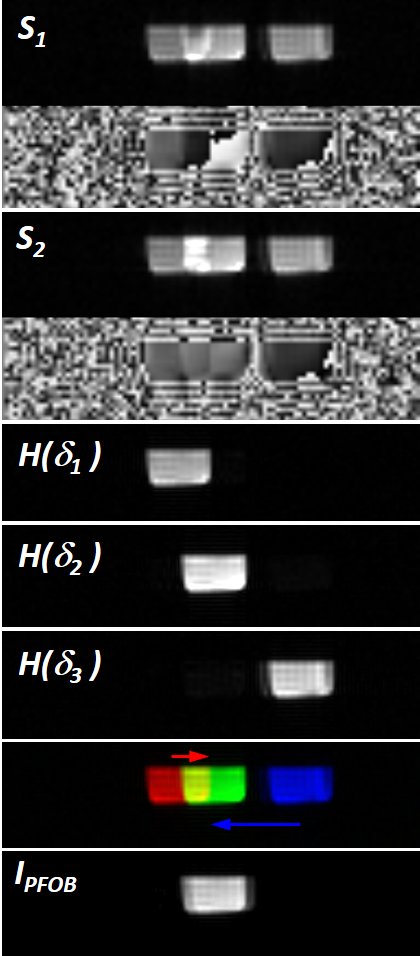
$$ H(\delta_1) = S_1 + S_2 + S_3 + S_4, $$ $$ H(\delta_2) = S_1 - S_2 + S_3 - S_4, $$ $$ H(\delta_3) = S_1 + S_2 - S_3 - S_4 $$ After this Hadamard decoding, the chemical shifts in readout direction in $$$ H(\delta_i) $$$ are corrected and the complex images are combined to form a final PFOB image after correction for the off-resonance phase $$$\phi_k = \gamma B_0 \delta_k TE$$$ at the echo time TE:
$$ I_{PFOB} = H(\delta_1) e^{-i \phi_1} + H(\delta_2) e^{-i \phi_2} + H(\delta_3) e^{-i \phi_3} $$ To demonstrate the feasibility of this correction method, a 3D 19F FLASH sequence was implemented with 3ms-long non-selective RF pulses RF1-RF4 followed by a conventional 3D Cartesian image encoding. Four Hadamard-encoded images of a PFOB sample were acquired at a clinical 3T MRI system (PRISMA, Siemens) using a dedicated 19F 1ch Tx/2ch Rx coil and the following imaging parameters: BW=260Hz/px, FOV=384mm, TR=10ms, TE=4ms, matrix=32x96x96, TA=4x30.7s.
Results
The magnitude and phase images $$$S_1$$$ and $$$S_2$$$ of the individual acquisitions are shown in Fig. 3 together with the Hadamard-decoded images $$$ H(\delta_i) $$$. The decoding provides an excellent suppression of the other resonances, and it increases the SNR from (46,62,55) as measured in the non-overlapping regions of the chemical shift artifacts to (86,123,109) after decoding for resonance $$$(\delta_1,\delta_2,\delta_3)$$$ which is consistent with the expected SNR increase by a factor of 2 from the 4-fold averaging during Hadamard decoding. The coherent addition of the 3 shifted and Hadamard-decoded images then yields a final PFOB image with an SNR of 192, again consistent with the expected SNR increase by √3=1.7.Discussion and Conclusion
Separation of multiple resonances in 19F MRI of PFOB is possible with the presented Hadamard encoding scheme which provides significant SNR improvement over narrow-band excitation concepts [9]. Compared to deconvolution methods, Hadamard decoding does not require regularization and can be implemented as a fully automated part of the PFOB image reconstruction without any user interaction. A better separation of the individual chemical shift artifacts could also be achieved with lower readout bandwidths [10], but this separation method puts unnecessary constraints on the sequence parameters. The need to acquire 4 acquisitions typically does not present a time penalty, as 19F MRI often requires multiple averages to overcome the low SNR from the low fluorine concentration in the target tissues. With a block length of 22 = 4 in the Hadamard scheme an additional resonance line could be encoded so that for example PFOB and PFCE could be imaged simultaneously.Acknowledgements
This work was supported in parts by the SFB1425, funded by the Deutsche Forschungsgemeinschaft (DFG, German Research Foundation #422681845).References
1. Rothe M, et al. In vivo 19F MR inflammation imaging after myocardial infarction in a large animal model at 3 T. MAGMA. 2019; 32(1):5-13.
2. Bönner F, et al. Monocyte imaging after myocardial infarction with 19F MRI at 3 T: a pilot study in explanted porcine hearts. Eur Heart J Cardiovasc Imaging. 2015; 16(6):612-20.
3. Jacoby C, et al. Probing different perfluorocarbons for in vivo inflammation imaging by 19F MRI: image reconstruction, biological half-lives and sensitivity. NMR Biomed. 2014; 27(3):261-71.
4. Lee HK, et al. Correction for chemical-shift artifacts in 19F imaging of PFOB: simultaneous multislice imaging. Magn Reson Med. 1991; 21(1):21-9.
5. Lee HK, et al. Correction of chemical-shift artifacts in 19F imaging of PFOB: a robust signed magnitude method. Magn Reson Med. 1992; 23(2):254-63.
6. Meissner M, et al. Revealing signal from noisy (19) F MR images by chemical shift artifact correction. Magn Reson Med. 2015; 73(6):2225-33.
7. Schoormans J, et al. An iterative sparse deconvolution method for simultaneous multicolor 19 F-MRI of multiple contrast agents. Magn Reson Med. 2020; 83(1):228-239.
8. Shukla HP, et al. A Comparison of Three Commercial Perfluorocarbon Emulsions as High-Field 19F NMR Probes of Oxygen Tension and Temperature. J Magn Reson B. 1995; 106(2):131-141.
9. Staal AHJ, at al. 19F MRI Imaging Strategies to Reduce Isoflurane Artifacts in In Vivo Images. Mol Imaging Biol. 2021 Epub ahead of print
10. Bock M, et al. Simultaneous Fluorine Imaging of 5-FU and FBAL. ISMRM 1998, p. 1831
Figures