1007
MR chemical exchange saturation transfer study of myocardium creatine dynamic change in an acute infarct porcine model1Sun Yat-Sen University Cancer Center, State Key Laboratory of Oncology in South China, Collaborative Innovation Center for Cancer Medicine, Guangzhou, China, 2Shenzhen Institute of Advanced Technology, Chinese Academy of Sciences, Shenzhen, China, 3UIH America, Inc., Houston, TX, United States, 4Central Research Institute, United Imaging Healthcare, Shanghai, China
Synopsis
This study investigated the dynamic alteration of myocardium creatine in infarct hearts using CEST MRI. Seven pigs underwent cine, Cr CEST and LGE imaging 3 and 14 days after MI. Significant increase of stroke volume and ejection fraction and decrease of infarct angle were observed at day 14 compared to that at day 3. Meanwhile, Cr CEST signals increased significantly in the infarct and its adjacent myocardium, and negatively correlated with infarct angle. The improved metabolic activity was associated with function recovery, indicating that Cr CEST MRI is promising to provide complementary information for heart remodeling at the molecular level.
Introduction
Creatine (Cr) plays a critical role in the buffering and transport of chemical energy to maintain the dynamic demands of the heart [1]. Measurement of Cr may provide useful information for evaluating myocardial metabolic state. Superior over 1H MRS, chemical exchange saturation transfer (CEST) MRI enables Cr imaging with better spatial resolution and higher detection sensitivity [2]. The present study aims to investigate dynamic change of myocardium Cr in infarct heart remodeling process using CEST MRI, which may provide complementary information for better understanding of heart remodeling at the molecular level.Materials and Methods
MRI study: The study was approved by the local Institutional Animal Care and Use Committee. Seven adult Bama pigs underwent MRI studies on a 3T scanner (uMR 790, Shanghai United Imaging Healthcare, Shanghai, China) 3 (D3) and 14 days (D14) after myocardium infarction (MI) induction, respectively. Cardiac quiescent period was identified from cine imaging (0.95×0.95×8.0 mm3, TR/TE=3.1/1.5 ms, 25 retrospectively reconstructed cardiac phases, flip angle=50°). ECG-triggered and respiration-navigated single-slice CEST scans were performed at the short-axis plane covering infarction (1.1×1.1×8.0 mm3, matrix size=270×288, TE=1.2 ms, flip angle=50°, iPAT=2). The CEST pulse sequence was illustrated in Fig. 1. In brief, six Gaussian-shaped saturation pulses with equivalent B1 of 3.8 μT were applied in the CEST preparation module (pulse duration=40 ms, inter-pulse delay=40 ms, flip angle=2700°), as optimized previously [3]. Data was acquired using a bSSFP readout at cardiac quiescent period. In addition to a reference scan without RF irradiation, 31 CEST-weighted images were collected with saturation frequency offsets equally distributed between ± 4.5 ppm. Finally, LGE imaging was completed 5-10 minutes after the contrast agent injection (0.1 mmol/kg, gadopentetate, Kangchen, Guangzhou, China) using PSIR technique (0.63×0.63×8.0 mm3, TR/TE/TI=4.37/1.78/350 ms, flip angle=25°).Data analysis: Cines on the slice of CEST imaging were loaded into Medis Suite 3.2 (Medis Medical Imaging Systems, Leiden, Netherlands) for LV structure and function measurements, including myocardium mass (MM), end-diastolic volume (EDV), end-systolic volume (ESV), stroke volume (SV), and ejection fraction (EF). CEST data was processed using custom-written MATLAB codes. The algorithm of minimizing residual complexity [4] was employed to co-register CEST-weighted images and manual adjustment was conducted if necessary. Pixel-wised Z-spectrum (MZ) was normalized by the signal without RF irradiation (M0), interpolated by smoothing splines, and centered to the water resonance [5]. Then, the normalized Z-spectrum was fitted using a probabilistic combination of three-pool Lorentzian functions to resolve saturation transfer effects of magnetization transfer (MT), direct water saturation (DWS) and Cr pool with their chemical shifts at -1.5, 0 and 1.8 ppm, respectively [6]. The amplitude of the Cr pool is defined as the Cr CEST. Infarcted myocardium was identified as hyperintense in the LGE T1w images, with infarct angle recorded. The remaining myocardium was circumferentially divided into six equiangular radial segments. The two segments immediately adjacent to infarction were classified as the adjacent region, and the remaining four segments were categorized as the remote region [7]. Cr CEST signal was measured in each region and global myocardium. Student’s t-test was employed with P<0.05 considered statistically significant.
Results and Discussion
Figure 2 compares multiparametric MR images of a representative infarct porcine at D3 and D14 after MI induction. Pronounced scar compaction was observed at D14, resulting in smaller infarct angle compared to that at D3. Noticeably lower Cr CEST signal was found to be largely consistent with the scar region shown on the LGE T1w images at both time points. Additionally, substantially higher Cr CEST contrast was exhibited at D14 than that at D3, especially in the infarct myocardium and its adjacent areas.Cardiac structural and functional indices on the slice of CEST imaging were compared between D3 and D14 after MI induction (Fig. 3). The changes of myocardium mass, EDV, and ESV were not statistically significant between the two time points. In contrast, significant increase of SV and EF, and decrease of infarct angle were observed at D14 compared to that at D3.
Figure 4 displays the Cr CEST signal change in the infarct, adjacent and remote regions as well as the entire myocardium over the studied period. Statistically significant increase of Cr CEST signal was found in the infarct, adjacent, and entire myocardium. Meanwhile, alteration of Cr CEST signal in the remote region was insignificant.
Quantitatively, none of LV mass, EDV, ESV, SV or EF exhibited significant correlation with global or regional Cr CEST signals (Table 1). Whereas, significantly negative correlations of Cr CEST signals with infarct angle were observed in the infarct, adjacent, and entire myocardium. The results demonstrated that the larger the infarct angle, the lower the Cr CEST signal, implying the extent of CK metabolic abnormality to be likely associated with infarct size.
Conclusion
Significant increase of Cr CEST signals was observed in infarct and its adjacent myocardium from day 3 to day 14 after MI injury. The indicated metabolic acitivity improvement may be associated with cardiac structural and functional recovery. The study shows that Cr CEST MRI is promising to provide complementary information for better understanding of heart remodeling at the molecular level.Acknowledgements
Grant Support: National Natural Science Foundation of China (81571668, 81871348 and 91859102).
References
[1] Zervou S, Whittington HJ, Russell AJ, Lygate CA. Augmentation of Creatine in the Heart. Mini reviews in medicinal chemistry 2016;16(1):19-28.
[2] Kogan F, Haris M, Singh A, Cai K, Debrosse C, Nanga RP, et al. Method for high-resolution imaging of creatine in vivo using chemical exchange saturation transfer. Magn Reson Med 2014;71(1):164-72.
[3] Zhou Z, Nguyen C, Chen Y, Shaw JL, Deng Z, Xie Y, et al. Optimized CEST cardiovascular magnetic resonance for assessment of metabolic activity in the heart. J Cardiovasc Magn Reson 2017;19(1):95.
[4] Myronenko A, Song X. Intensity-Based Image Registration by Minimizing Residual Complexity. IEEE Transactions on Medical Imaging 2010;29(11):1882-1891.
[5] Stancanello J, Terreno E, Castelli DD, Cabella C, Uggeri F, Aime S. Development and validation of a smoothing-splines-based correction method for improving the analysis of CEST-MR images. Contrast Media Mol Imaging 2008;3(4):136-149.
[6] Haris M, Singh A, Cai K, Kogan F, McGarvey J, Debrosse C, et al. A technique for in vivo mapping of myocardial creatine kinase metabolism. Nat Med 2014;20(2):209-14.
[7] Wu EX, Wu Y, Nicholls JM, Wang J, Liao S, Zhu S, et al. MR diffusion tensor imaging study of postinfarct myocardium structural remodeling in a porcine model. Magn Reson Med 2007;58(4):687-95.
Figures
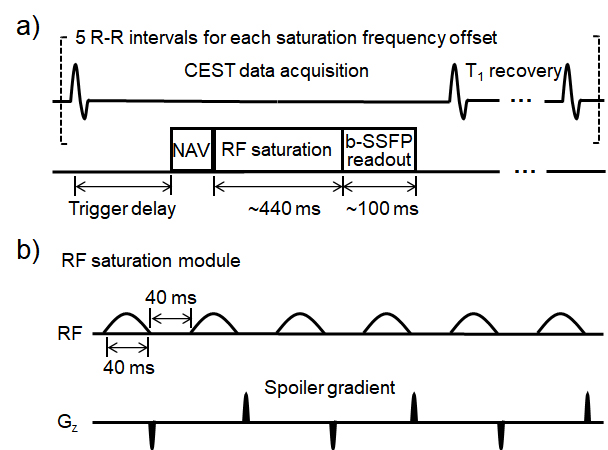
Figure 1. (a) Diagram of the cardiac CEST pulse sequence, with details of the CEST saturation module shown in (b).
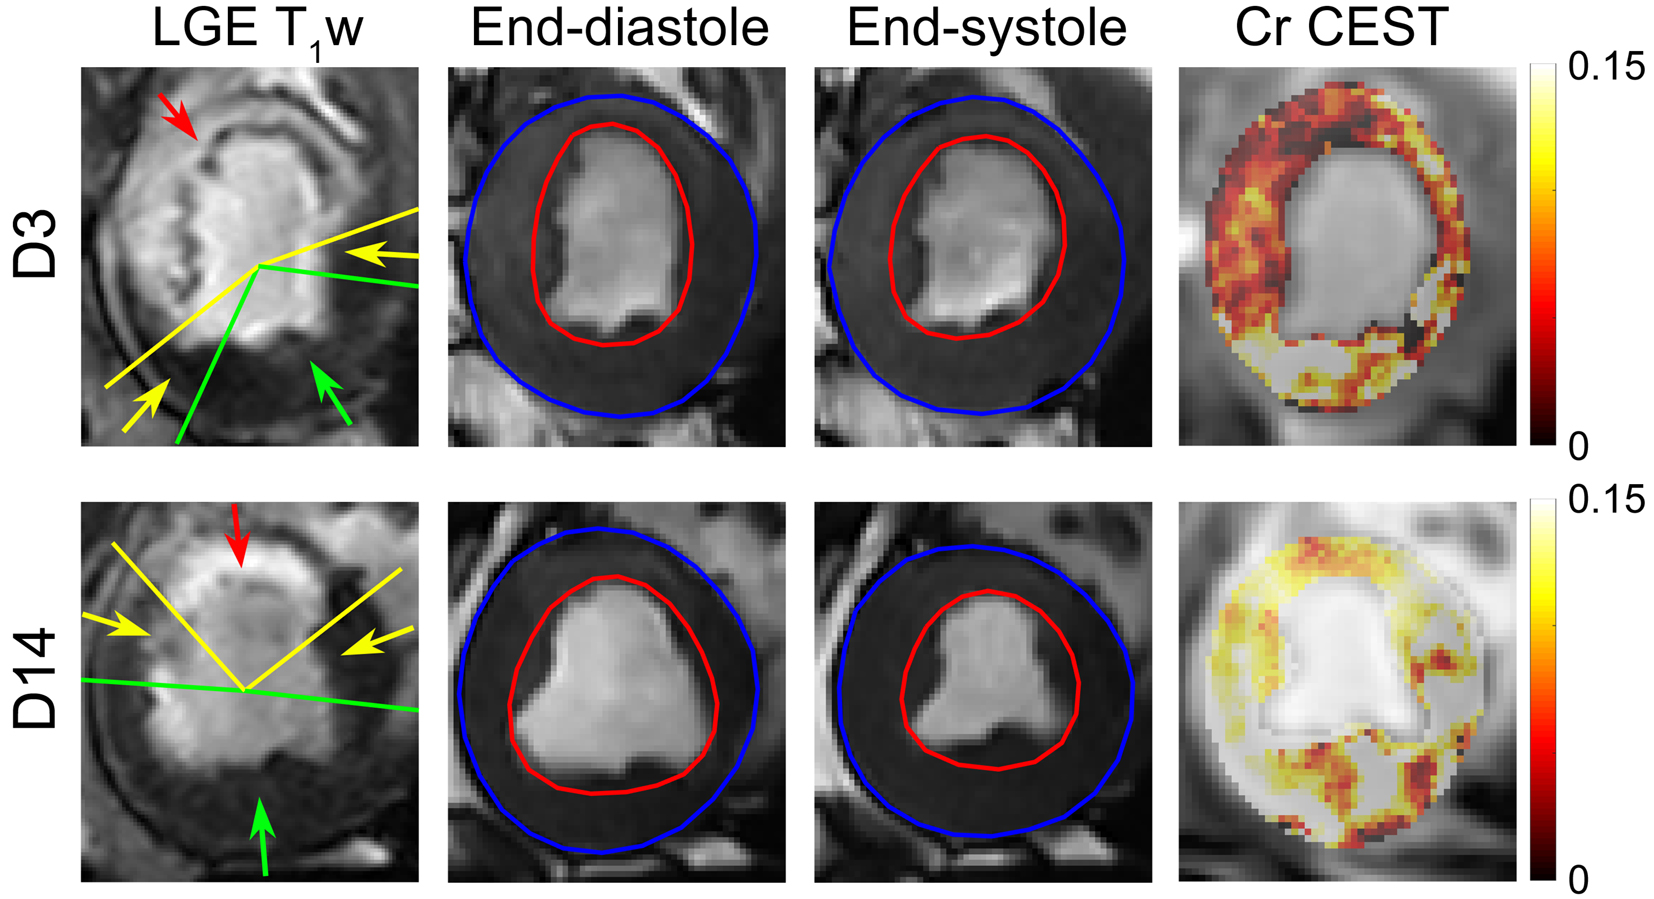
Figure 2. Comparison of multiparametric MR images of a representative porcine three (D3) and fourteen (D14) days after myocardium infarction induction, including LGE T1w images from which infarct (red arrow), adjacent (yellow arrows) and remote (green arrow) regions were defined, cine images at end-diastolic (ED) and end-systolic (ES) cardiac phases, and Cr CEST maps overlaid on CEST-weighted images, respectively.

Figure 3. Comparison of cardiac structural and functional indices, including myocardium mass, end-diastolic volume, end-systolic volume, stroke volume, ejection fraction and infarct angle between day 3 (D3) and day 14 (D14) after myocardium infarction induction.

Figure 4. Comparison of Cr CEST signal in the (a) infarct, (b) adjacent, (c) remote, and (d) entire myocardium between day 3 (D3) and day 14 (D14) after myocardium infarction induction.
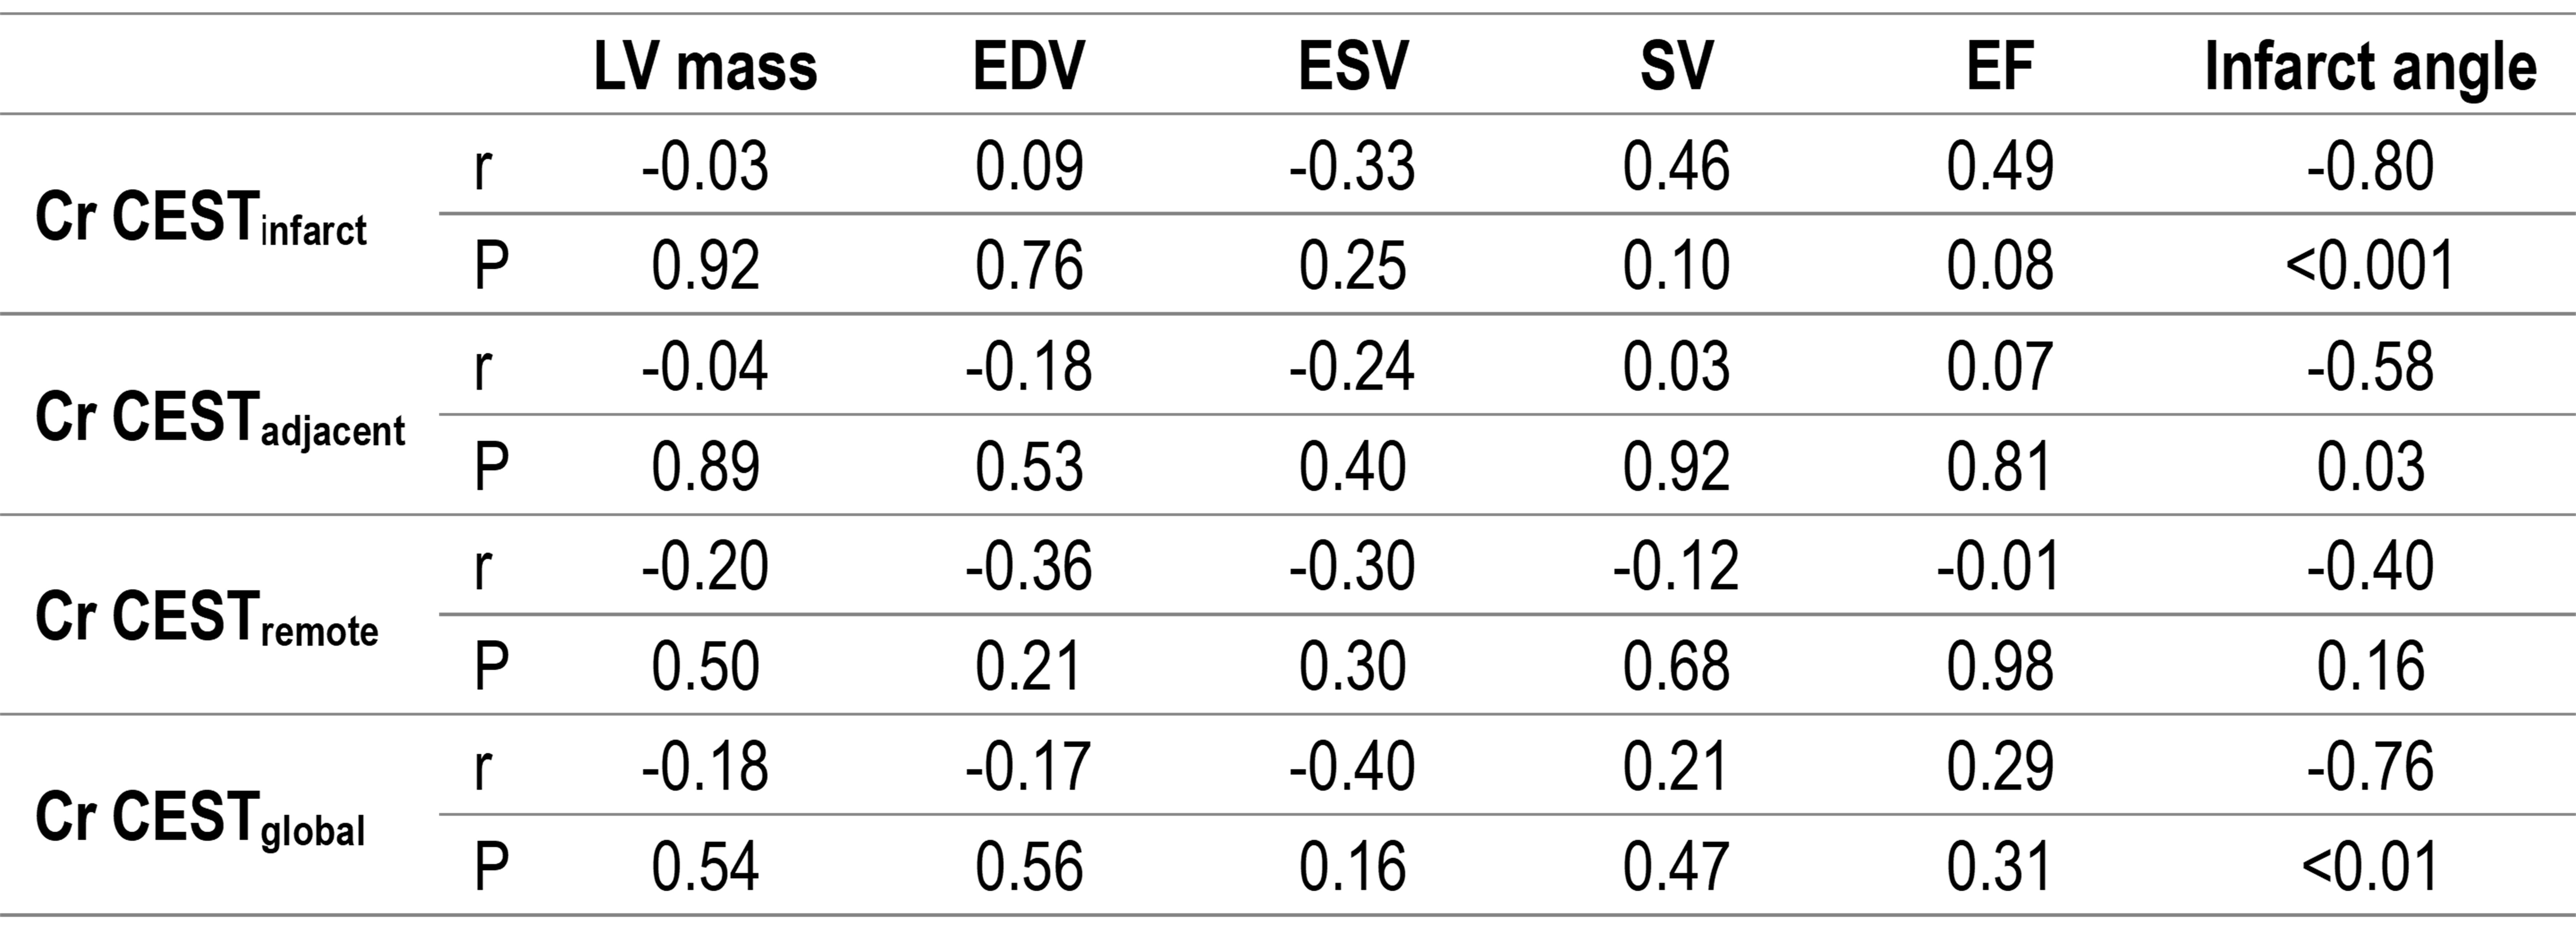
Table 1. Correlation of Global and Regional Cr CEST Signal with Cardiac Structural and Functional Indices