1004
3D joint T1/T1ρ mapping and water-fat imaging for contrast-agent free myocardial tissue characterization1School of Biomedical Engineering and Imaging Sciences, King's College London, London, United Kingdom, 2MR Research Collaborations, Siemens Healthcare Limited, Frimley, United Kingdom
Synopsis
In patients with suspected myocardial infarction, late-gadolinium enhancement (LGE) images are often acquired to detect focal and diffuse scarring. T1ρ is a sensitive marker for assessment of macromolecular-water interaction and has shown potential for non-contrast enhanced imaging of fibrosis. Here we propose a novel free-breathing, 3D whole-heart joint T1/T1ρ mapping sequence with Dixon encoding to provide 3D T1 and T1ρ maps and co-registered water and fat volumes with isotropic resolution for comprehensive contrast-agent free myocardial tissue characterization. Preliminary 3D joint T1/T1ρ mapping and water/fat imaging results demonstrate good agreement in phantoms and promising results in-vivo in healthy volunteers and patients.
Introduction
In patients with suspected myocardial infarction, late-gadolinium enhancement (LGE) images are often acquired in concert with T1 maps acquired pre and post gadolinium contrast injection to detect focal and diffuse scarring. In patients with renal dysfunction or contrast agent allergy, a non-contrast enhanced (non-CE) approach would be of great value. Furthermore, characterization of fibrofatty infiltration of the myocardium has been shown to be clinically relevant1. T1ρ is a sensitive marker for assessment of macromolecular-water interaction and native T1ρ mapping has shown potential for non-CE imaging of fibrosis as an alternative to LGE2. Additionally, joint mapping sequences may improve accuracy and protocol efficiency, avoid misregistration over sequentially acquired sequences and provide anatomical images for further diagnosis3. Moreover, segmentation and analysis should be greatly simplified and improved as contours can be shared between contrasts. Here we propose a novel free-breathing, 3D whole-heart joint T1/T1ρ mapping sequence with Dixon encoding to provide non-CE 3D T1 and T1ρ maps and co-registered water and fat volumes with isotropic resolution for comprehensive myocardial tissue characterization and simultaneous evaluation of the cardiac and coronary anatomy.Methods
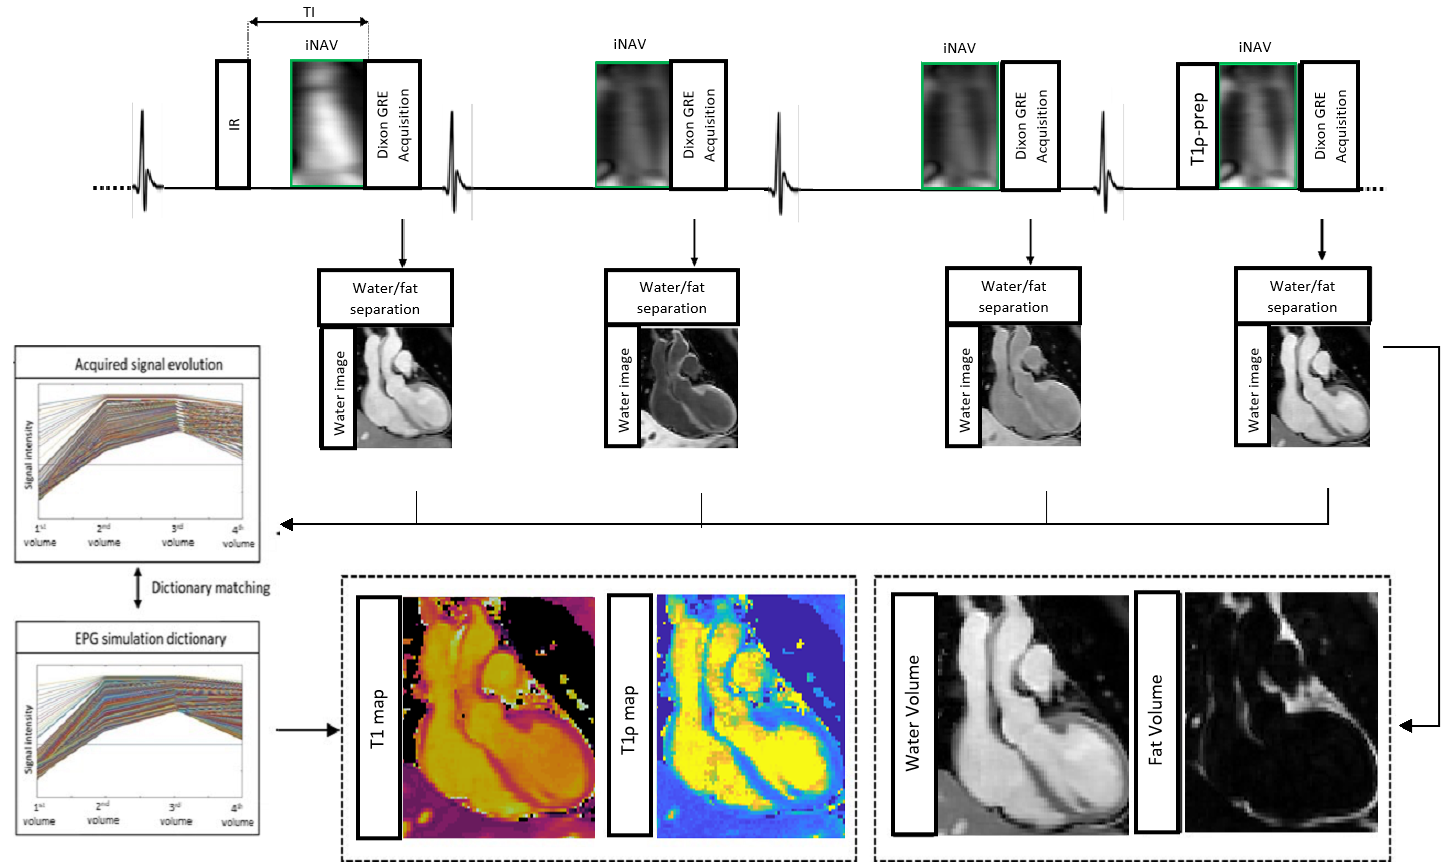
The ECG-triggered 3D joint T1/T1ρ prototype sequence (Fig. 1) consists of a repeating set of preparation modules over 4 heartbeats (HBs): IR preparation, no preparation, no preparation and T1ρ preparation. A 2-point bipolar Dixon gradient echo read-out is used (TE1/TE2/TR=2.38/4.76/6.71ms, flip angle=8o, bandwidth=453 Hz/pixel, spatial resolution=2mm isotropic) in every HB. To accelerate the acquisition, a variable-density 3D Cartesian trajectory with spiral profile order (VD-CASPR) and golden angle step4 is used to acquire 3x-4x undersampled data. 2D image navigators (iNAVs)5 are acquired prior to each spiral interleaf and used to perform beat-to-beat translational Right-Left (RL)/Foot-Head (FH) respiratory motion estimation and correction, as well as to bin the 3D data into 4 respiratory bins for estimation of bin-to-bin 3D non-rigid motion6. The eight 3D image contrasts (out-of-phase (OP) and in-phase (IP) echoes for each HB) are reconstructed using non-rigid motion corrected HD-PROST, with patch-based multi-dimensional low-rank regularisation7. Water and fat HB images are subsequently estimated from the reconstructed IP/OP HB images8. An EPG simulation9 of the sequence (12 HBs) was implemented in MATLAB using the mean RR interval and acquisition window per subject, and the last set of 4HBs averaged over the first 30% of each imaging acquisition yielding a dictionary with Np~46.3k T1/T2/T1ρ parameter combinations. Dictionary matching was performed by maximising the inner-product of the dictionary (normalised per parameter combination) and water HB images (normalised per image voxel) computed voxel-by-voxel.Results
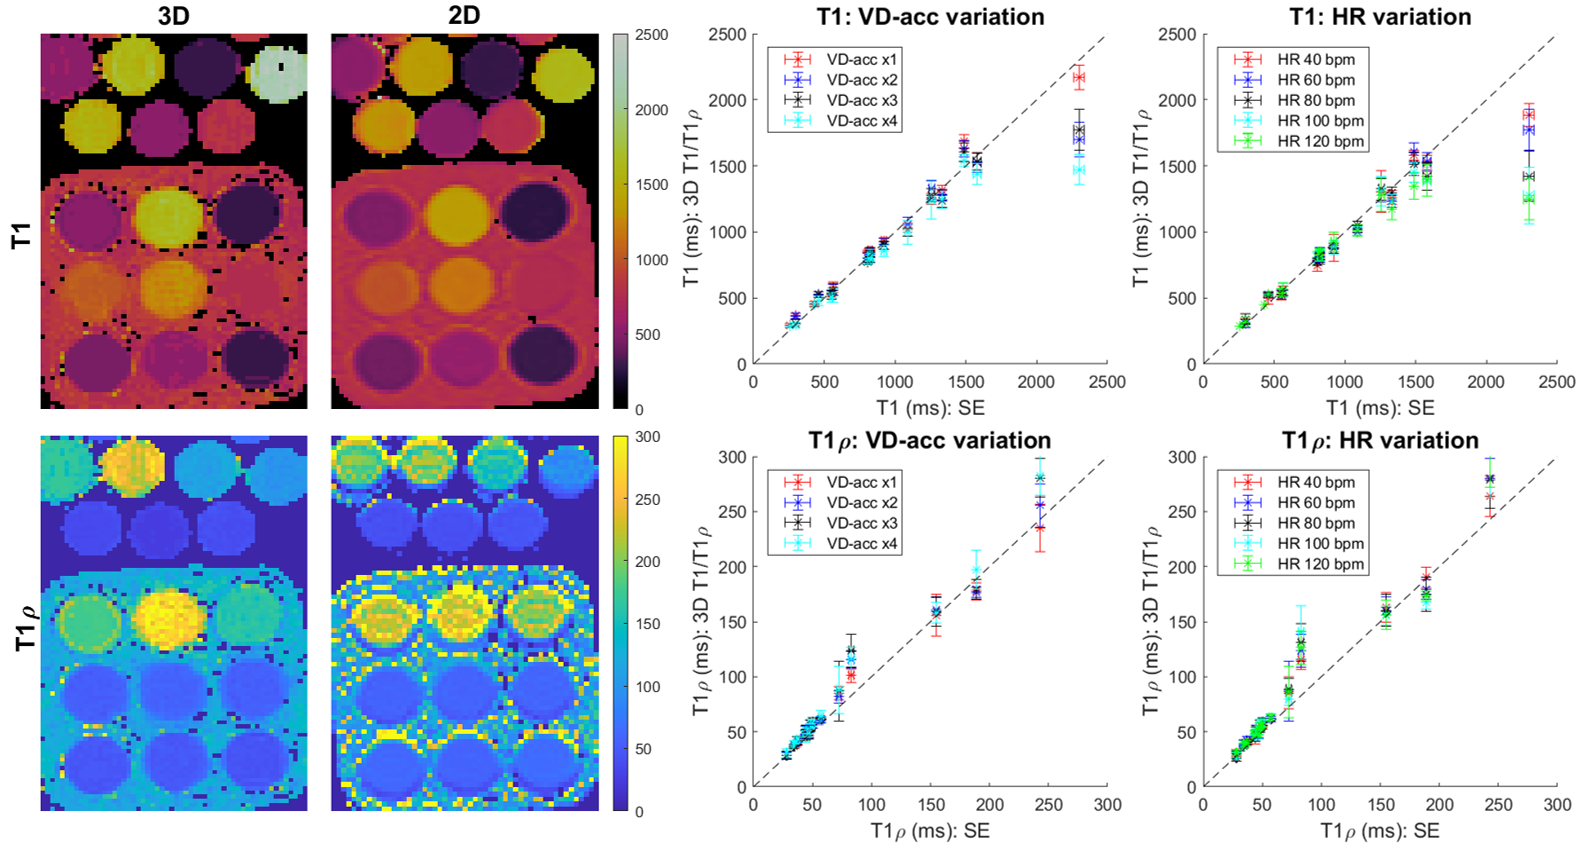
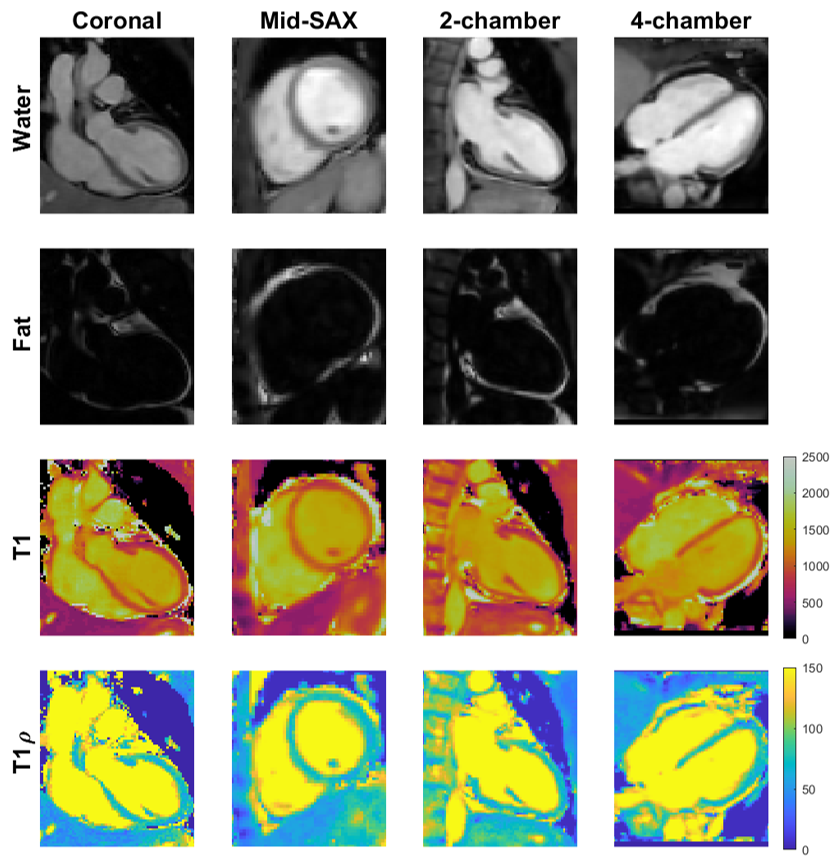
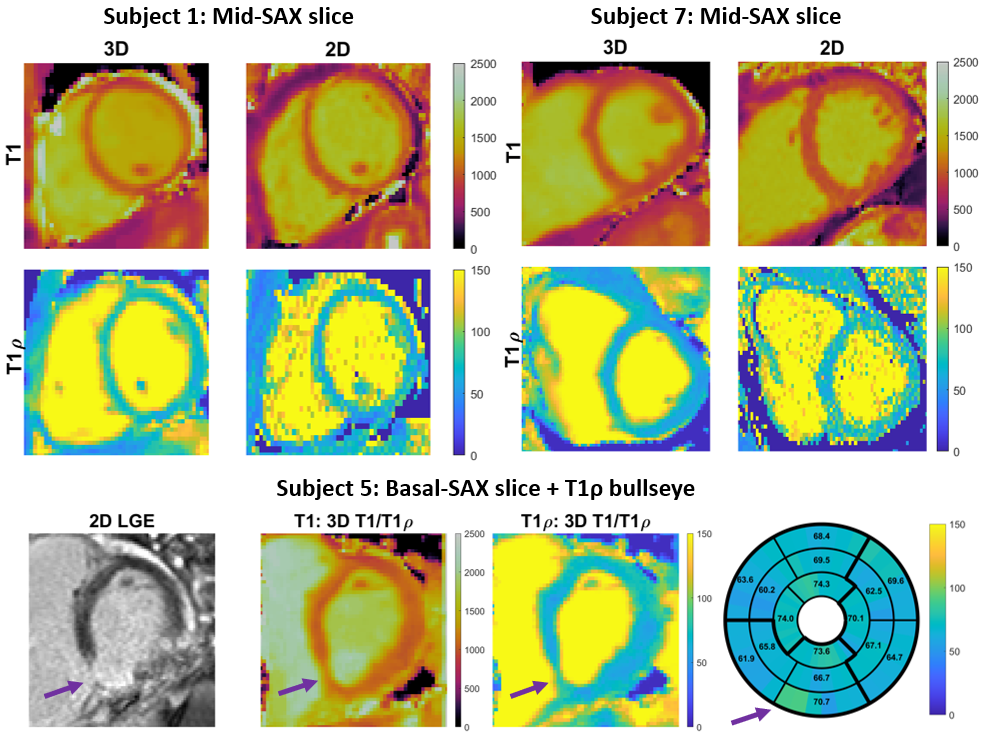
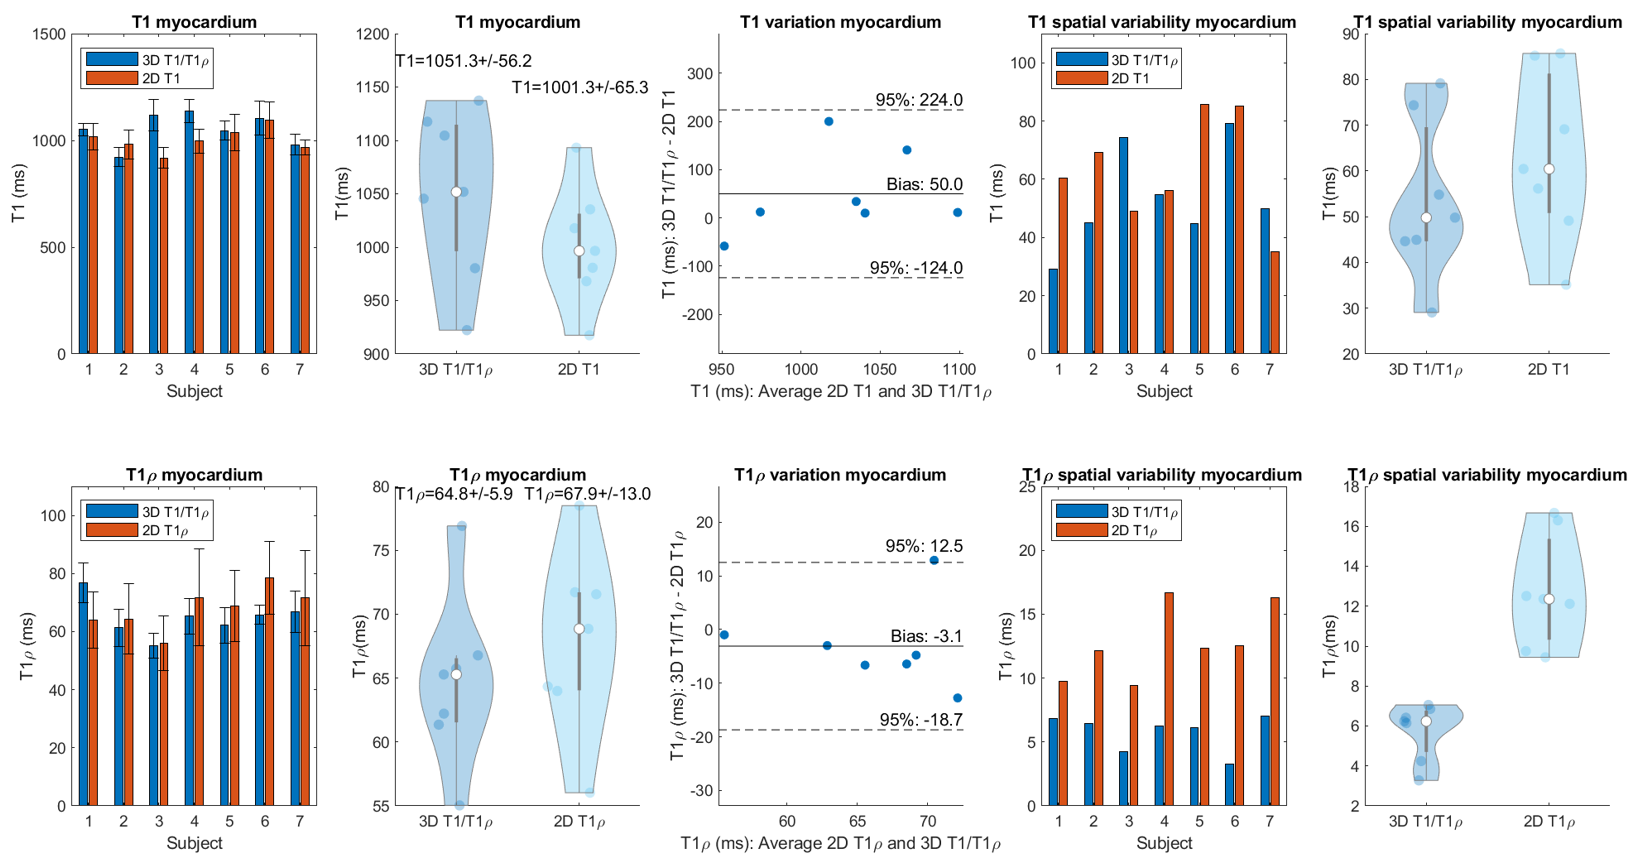
Data was acquired on a 1.5T MR scanner (MAGNETOM Aera, Siemens Healthcare, Erlangen, Germany) with an 18-channel body coil and 32-channel spine coil. Phantoms: Two phantom experiments were performed by varying simulated heart rate (HR) and VD-CASPR acceleration (VD-acc), with good agreement between estimated T1 and T1ρ values and those from 2D spin-echo (SE) measurements, 2D MOLLI10 and 2D T1ρ11 over the range of T1 and T1ρ values typical for myocardium, blood, and scar values (Fig. 2). In-vivo: Data was acquired in 2 healthy volunteers (subjects 2,3) and 5 patients (subjects 1,4-7, with subject 5 positive for scar in LGE), using VD-acc=x3 (subjects 1-3) and x4 (subjects 4-7). An acquisition window of ~100-150 ms was chosen at mid-diastole. Total scan-time was ~12.3/~9.3 mins (VD-acc x3/x4). Fig. 3 shows different views of the 3D volume of Water (4th HB), Fat (4th HB), T1 and T1ρ maps in a patient. Fig. 4 illustrates mid-ventricular short-axis (SAX) views of the proposed 3D T1/T1ρ maps, 2D MOLLI and 2D T1ρ for 2 patients. Fig. 4 also shows a comparison between 3D T1/T1ρ and a clinical 2D LGE sequence12 in a patient. An infarct can be observed in the inferior region of the 2D LGE image, and the basal-inferior segment of a high-resolution 16-segment AHA model indicates a localised increase in T1ρ here. For all subjects, the myocardium of a mid-SAX slice was segmented for the proposed 3D T1/T1ρ mapping, 2D MOLLI and 2D T1ρ. Fig. 5 illustrates a comparison of mid-SAX septal myocardium values between the proposed and reference sequences across all subjects. For T1, mean septal values for the proposed 3D T1/T1ρ sequence (1051.3±56.2 ms) are higher than for 2D MOLLI (1001.3±65.3 ms) and with a slight decrease in T1 spatial variability for the proposed sequence. This bias could be explained by the known underestimation of T1 by MOLLI13. For T1ρ, mean septal values for the proposed 3D T1/T1ρ sequence (64.8±5.9 ms) are slightly lower than 2D T1ρ (67.9±13.0 ms) with a significantly lower spatial variability for the proposed sequence. The septal T1ρ value reported here is slightly higher than that recently reported of 58.0±4.1 ms11.Conclusions
Preliminary 3D joint T1/T1ρ mapping and fat imaging results demonstrate good agreement in phantoms and promising results in-vivo. Further work will include acquisition of a larger cohort of patients with suspected myocardial infarction (with LGE as reference) to assess suitability of T1ρ maps as an alternative to LGE imaging. The inclusion of an additional T1ρ-prep module (with a different spin-locking duration) will be considered to improve sensitivity to T1ρ. Also, the inclusion of an additional T2-prep module will be considered to explore the possibility of 3D joint T1/T1ρ/T2 mapping.Acknowledgements
This work was supported by the following grants: (1) EPSRC EP/P032311/1, EP/P007619/1, EP/P001009/1; (2) BHF programme grant RG/20/1/34802 and (3) Wellcome/EPSRC Centre for Medical Engineering (WT 203148/Z/16/Z).References
1. Kellman P, Hernando D, Shah S, et al. Multiecho dixon fat and water separation method for detecting fibrofatty infiltration in the myocardium. Magn Reson Med. 2008;61(1):215-221.
2. Witschey W R T, Zsido G A, Koomalsingh K, et al. In vivo chronic myocardial infarction characterization by spin locked cardiovascular magnetic resonance. J Cardiovasc Magn Reson. 2012;14(1):37.
3. Milotta G, Bustin A, Jaubert O, et al. 3D whole-heart isotropic-resolution motion-compensated joint T1/T2 mapping and water/fat imaging. Magn Reson Med. 2020;84:3009-3026.
4. Prieto C, Doneva M, Usman M, et al. Highly efficient respiratory motion compensated free-breathing coronary MRA using golden-step Cartesian acquisition. J Magn Reson Imaging. 2015;41(3):738–746.
5. Henningsson M, Koken P, Stehning C, et al. Whole-heart coronary MR angiography with 2D self-navigated image reconstruction. Magn Reson Med. 2012;67(2):437–445.
6. Cruz G, Atkinson D, Henningsson M, et al. Highly efficient nonrigid motion-corrected 3D whole-heart coronary vessel wall imaging. Magn Reson Med. 2017;77(5):1894-1908.
7. Bustin A, Cruz G, Jaubert O, et al. High-dimensionality undersampled patch-based reconstruction (HD-PROST) for accelerated multi-contrast MRI. Magn Reson Med. 2019;81(6):3705-3719.
8. Liu J, Peters D C, Drangova M. Method of B0 mapping with magnitude-based correction for bipolar two-point Dixon cardiac MRI. Magn Reson Med. 2016;78(5):1862-1869.
9. Weigel M. Extended phase graphs: Dephasing, RF pulses, and echoes – Pure and simple. J Magn Reson Imaging. 2015;41(2):266-295.
10. Messroghli D R, Radjenovic A, Kozerke A, et al. Modified Look-Locker Inversion Recovery (MOLLI) for High-Resolution T1 Mapping of the Heart. Magn Reson Med. 2004;52:141-146.
11. Qi H, Bustin A, Kuestner T, et al. Respiratory motion-compensated high-resolution 3D whole-heart T1ρ mapping. J Cardiovasc Magn Reson. 2020;22:12.
12. Holtackers R J, Chiribiri A, Schneider T, at al. Dark-blood late gadolinium enhancement without additional magnetization preparation. J Cardiovasc Magn Reson. 2017;19(1):64.
13. Kellman P, Hansen M S. T1-mapping in the heart: Accuracy and precision. J Cardiovasc Magn Reson. 2014;16(2)
Figures