1001
Analysis of resting state functional connectivity of white matter tracts in spinal cord of squirrel monkey using Graph Theory1Vanderbilt University Medical Center, Nashville, TN, United States
Synopsis
The goal of this study was to investigate the nature of spontaneous BOLD fluctuations in white-matter (WM) of spinal-cord and to use these to identify the intrinsic functional architecture of WM tracts and their correlations with the gray-matter (GM) hubs. Connectivity measures were obtained using resting state BOLD signals between WM-WM and WM-GM regions, followed by network analysis using graph-theory. We found WM and GM hubs on the dorsal side exhibit greater temporal correlation as exhibited by their stronger node strength in resting state. Also, within segment WM-WM and WM-GM correlations were found to be stronger than those between segments.
Introduction
While BOLD signals have been reliably detected in gray matter (GM) in a large number of studies, such signals have rarely been reported from white matter (WM)1. The reasons put forward is lower blood flow and volume in WM as well as lower energy requirements for WM functions than GM2,3. However, it is clear from our own and other studies that although BOLD effects are weaker in WM, using appropriate detection and analysis methods they are robustly detectable in brain both in response to stimuli and in resting state4,5,6. Recently we also demonstrated the existence of spontaneous BOLD fluctuations in WM tracts of spinal cord (SC), similar to those found in brain, using independent component analysis (ICA), which is a data driven approach to decompose BOLD signal into spatially independent functional hubs7. However, the intrinsic functional architecture of the WM tracts of SC and their relationships with GM hubs are unclear. In this study we address these issues by investigating the resting state functional connectivity between WM-WM hubs and between WM-GM hubs of SC, and then we perform network analysis based on graph-theory principles. Graph-theory is a mathematical way of representing complex networks in the form of nodes and edges and provides statistical measures describing the strength of the functional hubs8.Methods
Images of five axial slices covering C3-C7 cervical segments of 20 anaesthetized squirrel monkeys (56 runs) were acquired using a custom neck coil on a Varian/Agilent 9.4T MRI spectrometer. Resting state fMRI data (300 dynamics) were acquired using a fast gradient echo sequence (flip angle = ~18°, TR = 46.88ms, TE: 6.5ms, 3s per volume). Motion, physiological signal correction (RETROICOR) and band pass filtering (0.01-0.1 Hz) were performed on the fMRI time series, followed by co-registering to a customized template using FSL in order to facilitate group level analyses9,10. Group spatial ICA was performed by temporal concatenation of the resting state data from all runs using GIFT software separately on GM and WM masked regions11. 45 spatially independent regions of interest (ROI) were extracted from the WM (5-slices) and 35 such ROIs were extracted from the GM (5-slices) by performing ICA. Next, functional connectivity was computed between the WM regions and between WM-GM regions of all slices by correlating (Pearson’s correlation r) their fMRI time series. After that, network analysis was performed on the functional connectivity matrix based on graph-theory principles8. In graph-theory, a network is defined by a collection of nodes (vertices), and links (edges) between pairs of nodes. Nodes in our study represented the WM and GM ROIs (from all the slices) while links represented functional connectivity values (r) between them. We also computed the node strengths, which are the sums of weights of links connected to each node, averaged over the number of links to the node.Results
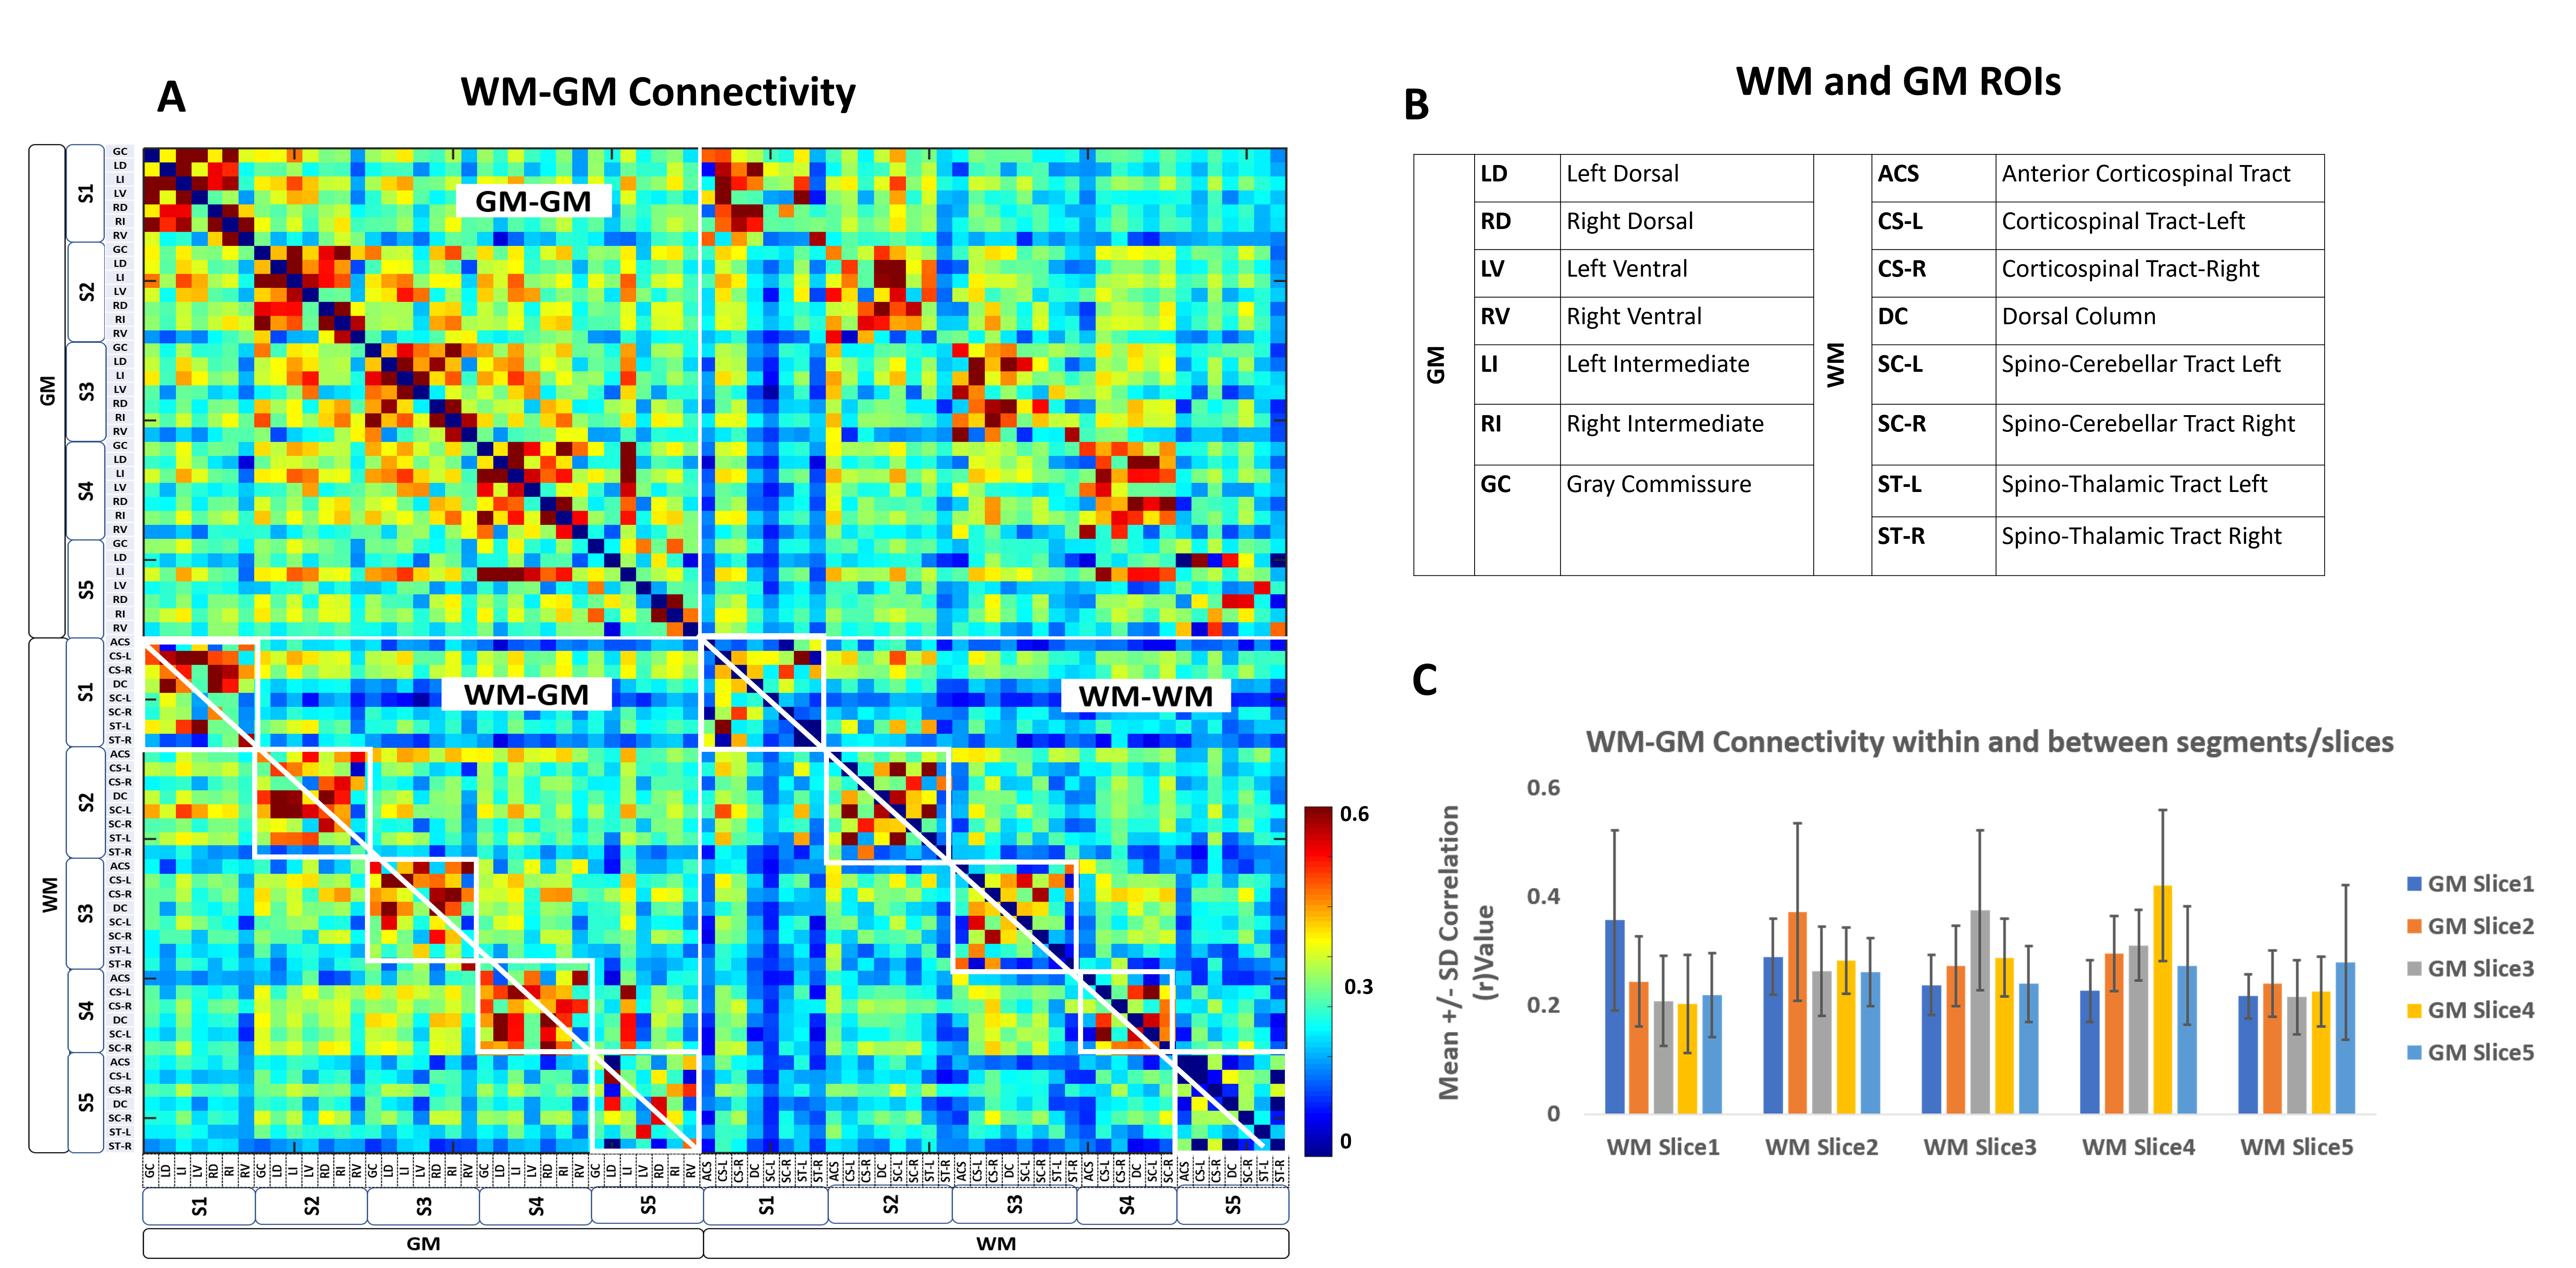
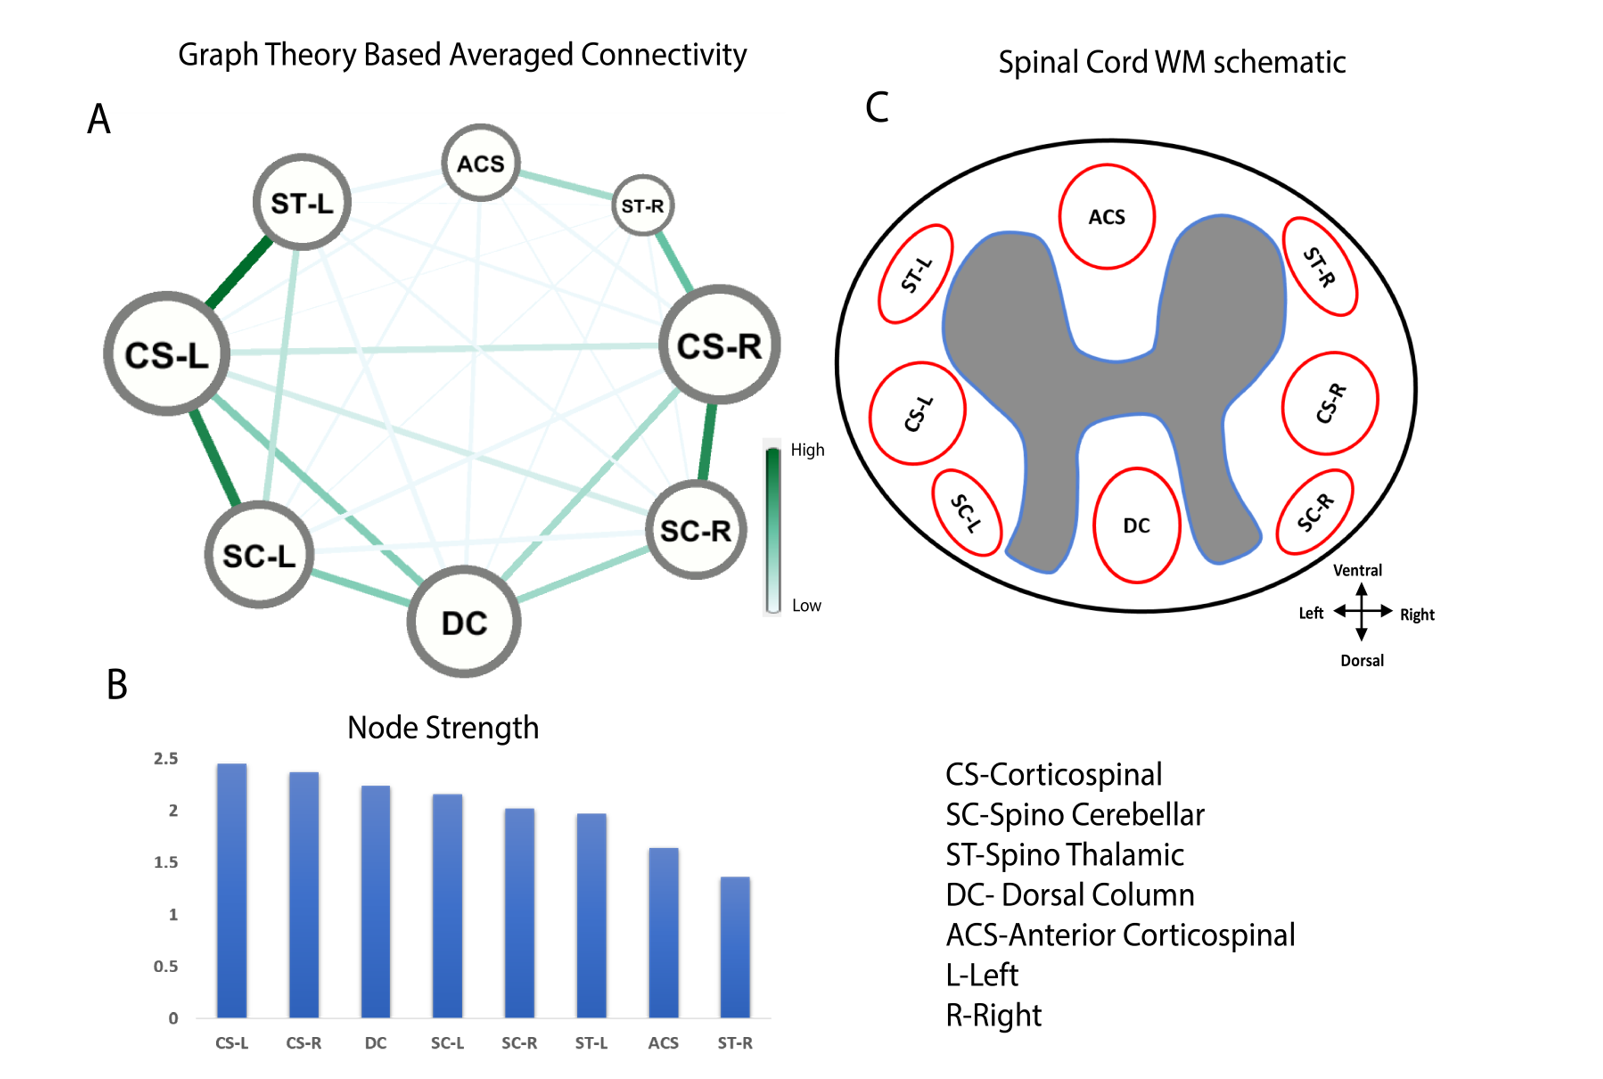
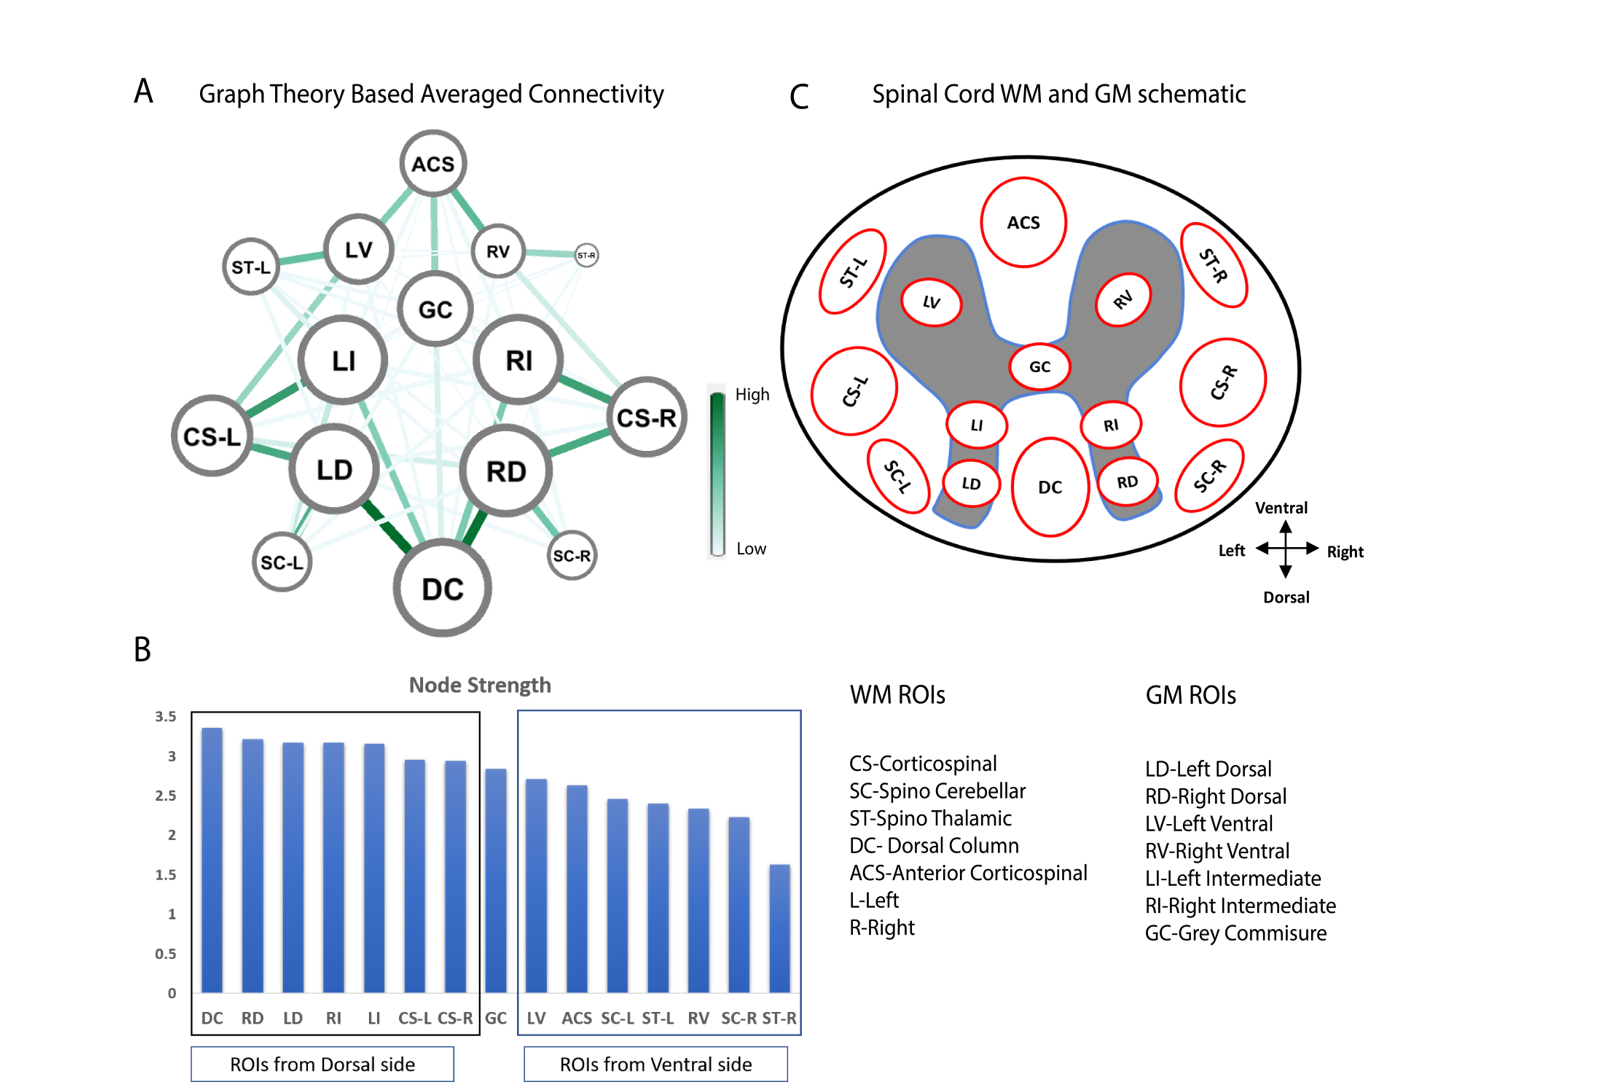
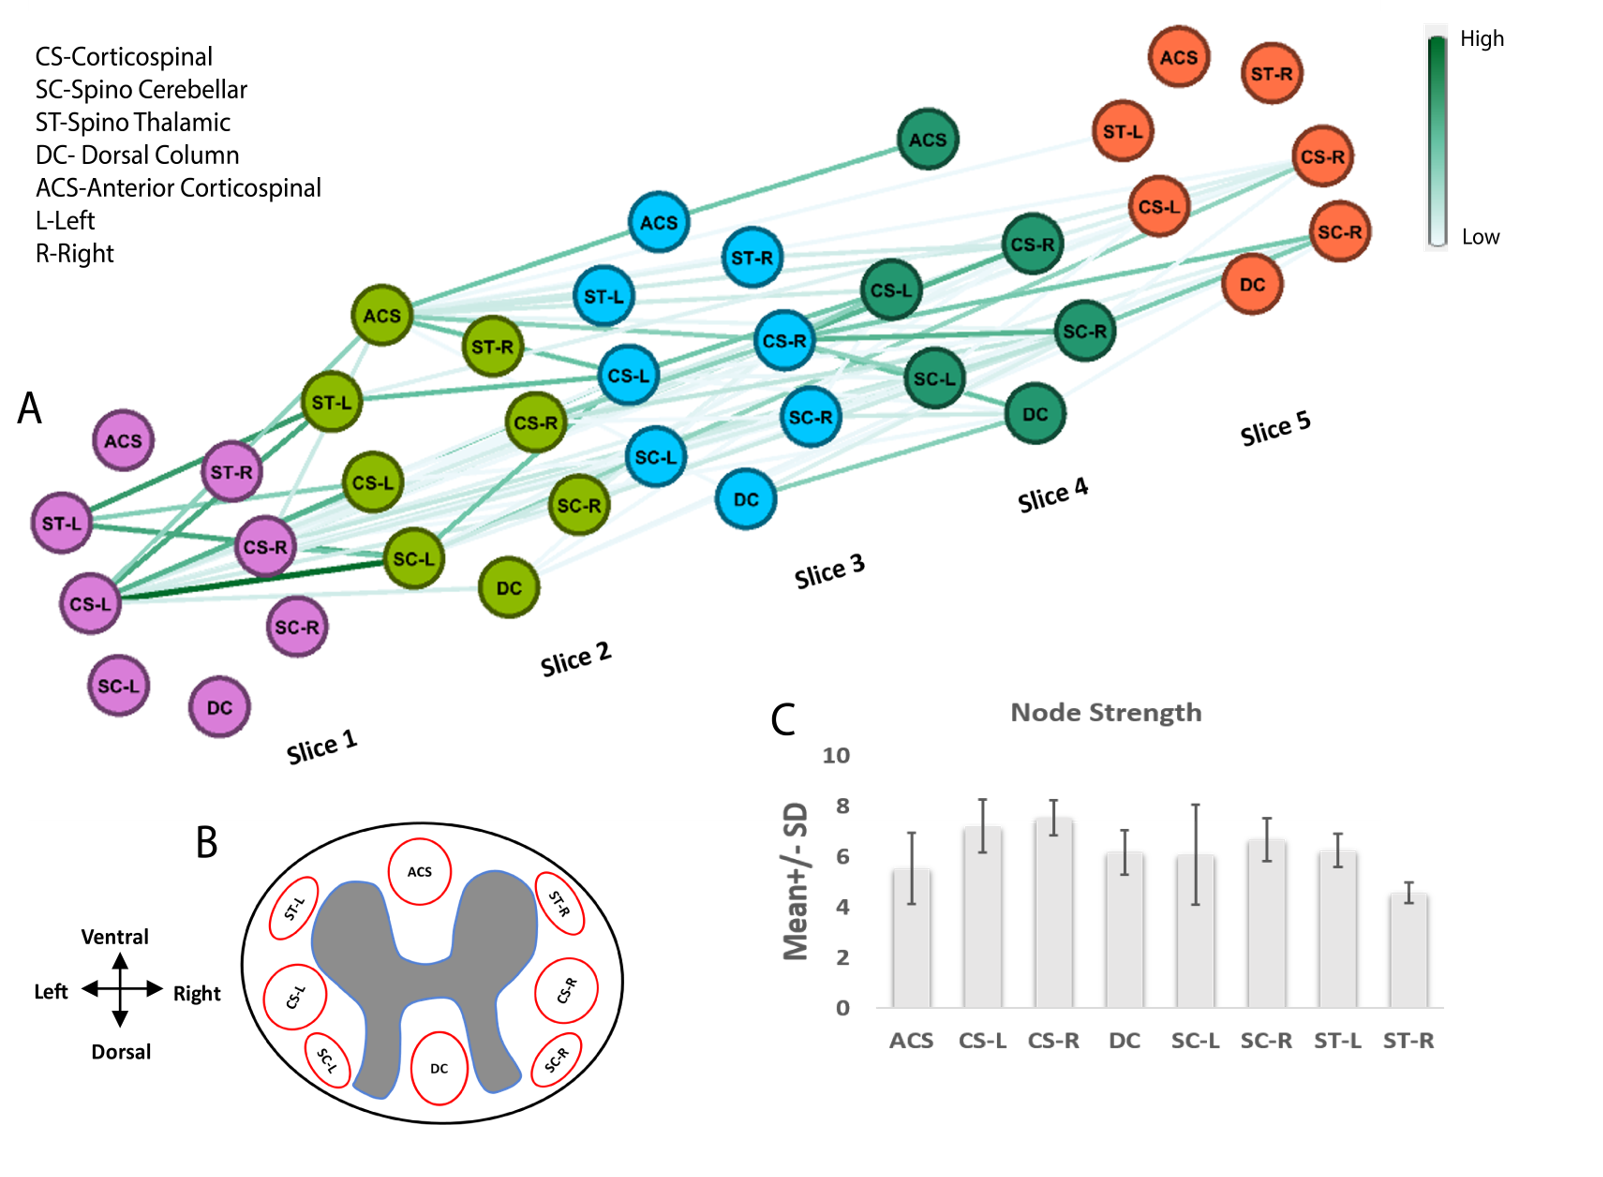
Eight regions/hubs of spontaneous BOLD fluctuations were observed in the WM of individual slices (not all were reliably detected in all slices) which corresponded closely to histologically-identified locations of WM tracts in SC (Figure1A). Similarly, seven such regions were observed in GM of SC (Figure1B) as reported in our previous study on GM of SC12. Figure2A represents the inter-ROI connectivities of the WM and GM hubs from all slices expressed in the form of a correlation matrix. Figure 2C shows that the mean connectivity of WM hubs with GM hubs are strongest within the same segment compared to those with other segments. Same observation was noticed for WM-WM correlations (results not shown). Figure3 and Figure4 provides a graphical display of the functional connectivity between WM-WM and WM-GM ROIs respectively, within a segment (averaged over three segments). The left and right cortico-spinal tract has the highest node strength whereas the right spino-thalamic tract has the lowest strength among the WM-WM correlations within a segment/slice (Figure3B). Among the WM-GM correlations, ROIs on the dorsal side showed higher node strengths compared to those in the ventral side (Figure4B). Figure5 shows a graphical display of WM-WM correlations between the five segments. Some WM tracts are visibly more connected than others. Cortico-spinal tracts (left and right) stand out as the ones with highest average node strength.Discussion and Conclusion
Spontaneous BOLD fluctuations are observed in regions of SC WM which are grossly symmetric and coincide with known anatomical locations of WM tracts. WM hubs appeared strongly connected with other WM and GM hubs but higher correlations were observed with hubs from the same segment than those with other segments. It is apparent that the variations of correlations between WM-WM and WM-GM are not random, but rather manifest a pattern suggesting that WM and GM functional hubs in the dorsal side exhibit overall greater temporal correlation (as suggested by their stronger node strength) suggesting dominant somatosensory information processing during resting state. The correlations between WM regions may indicate an apparent “relayed” connectivity if different WM tracts are influenced by the same GM hubs. Whether BOLD signals in WM are related to intrinsic neural activity, or are the result of vascular changes in neighboring GM still remains unclear. Overall, the present study provide certain insights into the WM functional connectivity of SC which demands greater attention in future studies.Acknowledgements
This study is supported by NINDS Grants R01 NS092961 and DOD Grant W81XWH-17-1-0304. Authors Li Min Chen and John C Gore share equal contribution.References
1. Gore J.C, et al. Functional MRI and resting state connectivity in white matter-a mini-review. Magn. Reson. Imaging. 2019.
2. Rostrup E, Law I, et al. Regional differences in the CBF and BOLD responses to hypercapnia: a combined PET and fMRI study. Neuroimage. 2000.
3. Harris JJ, Attwell D. The energetics of CNS white matter. J Neurosci .2012.
4. Ding Z, et al. Visualizing functional pathways in the human brain using correlation tensors and magnetic resonance imaging. Magn Reson Imaging.2016.
5. Wu X, et al. Functional connectivity and activity of white matter in somatosensory pathways under tactile stimulations. Neuroimage. 2017.
6. Huang Y, et al. Detection of functional networks within white matter using independent component analysis. Neuroimage. 2020
7. Sengupta A, et al. Detection of intra-spinal resting state correlations between white matter tracts in spinal cord using BOLD fMRI and their changes with injury. ISMRM 29th Annual Meeting & Exhibition, 2021, Virtual Conference. Abstract: 652.
8. Rubinov, M. & Sporns, O. Complex network measures of brain connectivity: Uses and interpretations. Neuroimage. 2010.
9. Glover, G. H., Li, T. Q. & Ress, D. Image-based method for retrospective correction of physiological motion effects in fMRI: RETROICOR. Magn. Reson. Med. 2000.
10. Jenkinson, M. & Smith, S. A global optimisation method for robust affine registration of brain images. Med. Image Anal. 2001.
11. Calhoun, V. D., Adali, T., Pearlson, G. D. & Pekar, J. J. Group ICA of Functional MRI Data: Separability, Stationarity, and Inference. Proc. ICA .2001.
12. Sengupta A, et al. Functional networks in non-human primate spinal cord and the effects of injury. Neuroimage. 2021.
Figures